Transcription
Short-Circuit, Coordination, and Arc-Flash Studies forData Centers: Best Practices and PitfallsKarl A. Homburg, PE, Staff Power Systems Engineer, Square D Engineering Services1. AbstractData Center power systems present unique challenges for the application of electrical equipment.These challenges, such as multiple operating modes, must be carefully implemented if thedesired system performance under normal and abnormal conditions is to be achieved. Thispaper describes the challenges that a typical data center presents to the system study engineer,common pitfalls that must be avoided, and describes how a well-performed system study iscrucial to the successful performance of a data center power system.2. Power System Analysis SoftwareWhile it is possible to perform power system studies utilizing hand calculations, the complexitiesof data center power systems would tend to make these calculations tedious at best. Due to thehigh reliability requirement of data centers they are usually designed with several possibleoperating scenarios for many different contingencies. Every operating scenario is essentially acompletely separate power system that may have completely different fault currents, arc-flashincident energy levels and power flows. It is also possible that some contingency scenarios, likeoperation on generator power, may require protective relays to be programmed with multiple setsof trip characteristics based on the scenario they are operating under. The best way to find andmitigate problems with the design of a data center is on the computer where changes are lessexpensive than changes to equipment and there is reduced risk of downtime before equipment isin service. With the proper software, multiple contingency and operating scenarios can becompletely evaluated ahead of time.3. Short-Circuit, Coordination and Arc-Flash StudiesA power system study is an extremely important document for any power system. Today eventhe smallest power systems are having power system studies performed to comply with morestringent codes and regulations. Due to the high reliability requirement imposed upon theoperation of data centers it is an absolute necessity.A power system study typically consists of short circuit, coordination, and arc-flash hazardstudies. While sometimes these individual areas may be considered separately they are all verymuch interrelated and it is recommended that these be performed at the same time, by the sameentity, to ensure the most accurate results.Data centers also present additional challenges to the engineer tasked with performing a powersystem study. Many data centers are served by multiple utility sources and generators that canbe operated in several different configurations. All configurations must be considered in order forthe engineering study to completely predict the operation and identify any shortcomings in thepower system.3.1.Short Circuit Study3.1.1. BackgroundThe purpose of a short circuit study is to identify the maximum available fault current at alllocations, called busses, in the power system. It is then compared with the ratings of theRevision 0 11/09www.criticalpowernow.comCopyright 2009 Schneider Electric. All Rights Reserved.Page 1 of 20
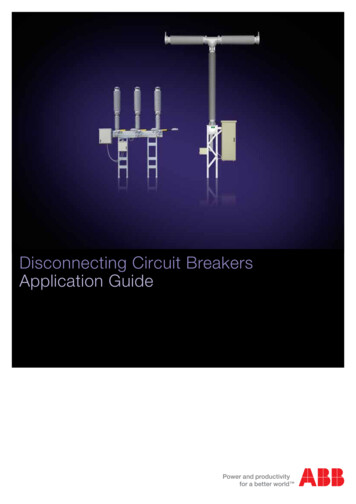
Short-Circuit, Coordination, and Arc-Flash Studies for Data Centersindividual power system components to determine if the equipment is adequately rated to safelywithstand or interrupt the calculated fault current.The results of the short circuit study are also used in both the coordination study and the arc-flashstudy. How this information is used will be discussed later.The results of the study are usually presented in a table like that shown in Fig. 1. The table listseach bus, its voltage, the type of equipment connected to the bus, the calculated available faultcurrent as well as the equipment’s short circuit rating. The table then indicates whether theequipment is adequately or inadequately rated for the available short circuit current.Fig. 1 Short-Circuit Coordination Comparison TableIf equipment is found to be inadequately rated for the available fault current, action must betaken. The National Electrical Code, as well as other regulations, require that all electricalequipment be adequately rated for the available fault current. Equipment that is inadequatelyrated can be a serious safety hazard. As such it may result in melted or bent bus bars, enclosurerupture or even a failure of the intended interrupting device to interrupt the fault, any of which canlead to more extensive fault damage and/or loss of service continuity than would otherwise be thecase.Revision 0 11/09www.criticalpowernow.comCopyright 2009 Schneider Electric. All Rights Reserved.Page 2 of 20
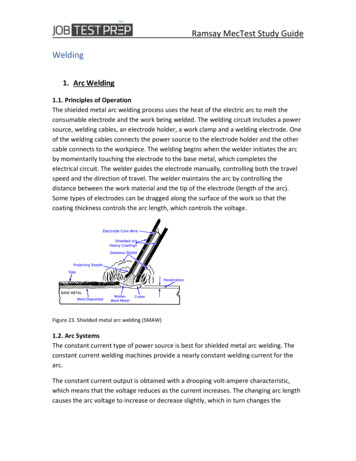
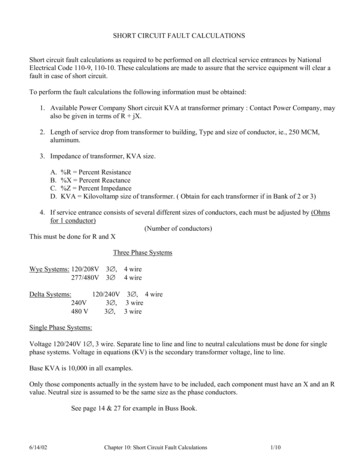
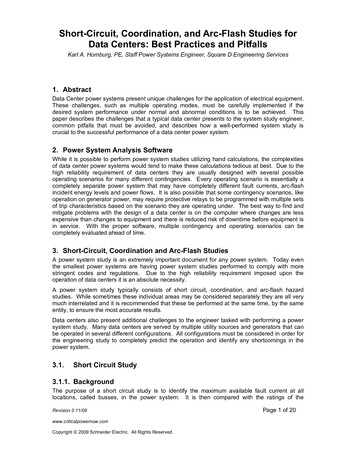
Short-Circuit, Coordination, and Arc-Flash Studies for Data Centers3.1.2. Short Circuit Study – PitfallsData centers present some pitfalls when performing a short circuit study. Since the short circuitstudy is concerned with the maximum available fault current, we need to look at the operatingscenario that will supply the most fault current and consider all sources of fault current. In mostcases the operating scenarios and motor information are not readily apparent upon examining theone-line diagram of the power system. The system study engineer must obtain this informationfrom the system designer.Fig. 2 Fault Currents with Open TieFig. 3 Fault Currents with Closed TieRevision 0 11/09www.criticalpowernow.comCopyright 2009 Schneider Electric. All Rights Reserved.Page 3 of 20
Short-Circuit, Coordination, and Arc-Flash Studies for Data Centers3.1.2.1.Motor ContributionOne often overlooked source of fault current are motors operating on the system. Large datacenters may have very large chillers and air handlers to deal with the heat generated by theequipment within. It is not uncommon mistake for some system designers to choose short circuitrating of equipment based on an infinite bus calculation of the transformers feeding them whileneglecting the contribution of motors in the system. A typical motor will contribute 6 times its fullload current as fault current. If little margin is included when short circuit ratings are chosen themotor contribution could easily push the distribution equipment over the edge.3.1.2.2.Parallel OperationOften data centers are not designed to parallel sources during steady state operations. Somedesigns however may operate one or more transformers in parallel with one or more generators.If this is the case all of the operating scenarios must be considered to determine the scenario thatproduces the maximum available fault current. Fig. 2 and Fig. 3 show the difference in faultcurrent on a main tie main system with the tie breaker both open and closed. If the utility hasbeen assumed to be an infinite bus the available fault current would be double. Since real utilitysources are not infinite busses the available fault current from the utility will have a significanteffect on the secondary fault current. In most cases it will be much less than double but stillsignificantly more than the current available from a single transformer. This effect can be evenmore significant when multiple generators are paralleled.Even in data centers that do not intentionally operate with parallel sources many of them doexperience some time in which sources are paralleled. This is the case if switching is performedas a closed transition. Under this scenario sources are briefly paralleled to allow the switching ofsources without interruption to the load. If this is done automatically the time the sources areparalleled is very brief, up to only a few seconds. If the switching is done manually the time canbe significantly longer based on the time needed for the worker operating the equipment. Duringthe time that the sources are paralleled the power system equipment is exposed to the muchlarger fault current of the paralleled sources.There are differing opinions as to whether switchgear should be operated in a closed transitionscenario while only rated for the open transition fault current. One common view holds that if theclosed transition is automatically controlled by a control system such that the tie breaker and bothmains are closed for only a very short period of time it is acceptable to choose the equipmentbased on the open tie fault current. This is because the probability of a fault during this very briefperiod of time is extremely low and workers are not typically standing in front of the equipmentduring operation.Conversely if the closed transition is done by a worker manually operating circuit breakers thetime period the breakers are closed is significantly longer and the worker is in close proximity tothe switchgear. In these cases equipment that is fully rated for the closed tie fault current istypically recommended. It should be noted that there is, by no means, universal agreement onwhat ratings to use for a closed transition. It is ultimately the responsibility of the engineer ofrecord to make the decision.3.1.2.3.Single Line to Ground FaultsSingle line to ground fault can be a concern when a delta-wye connected 3 phase 4 wire systemor wye-grounded generators are employed especially when the substation transformers orgenerators are very close or are close coupled to the distribution switchgear. When the distanceis small the zero sequence impedance is significantly smaller than the positive and negativesequence impedance. This difference can cause the single line to ground fault magnitude to beup to theoretical maximum of 150% of the magnitude of a three phase fault.Revision 0 11/09Page 4 of 20www.criticalpowernow.comCopyright 2009 Schneider Electric. All Rights Reserved.
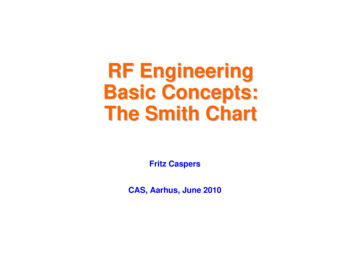
Short-Circuit, Coordination, and Arc-Flash Studies for Data CentersFig. 2 shows a one-line diagram of a main-tie-main service entrance with the tie breaker open.The transformers are assumed to be close coupled to the switchgear. As can be seen in thefigure the available single line to ground fault is about 105% of the available three phase fault.Fig. 3 shows what happens when the tie breakers are closed. Not only does the three phase faultcurrent increase dramatically but so does the difference between the three phase fault and thesingle line to ground fault. When the transformers are paralleled the single line to ground fault isabout 109% of the three phase fault.Fortunately after even as little as a few tens of feet for smaller transformers the zero sequenceimpedance increases to the point where the single line to ground fault will be less than the threephase fault. For the example we have been using it would take about 90 feet of cable to reducethe SLG fault current to the level of the 3P fault current. If dealing with a closed tie situation therequired cable length approximately doubles to about 180 feet.3.1.2.4.X/R RatioThe X/R ratio is a measure of the ratio of the inductive reactance (X), consisting of the inductivecomponents of cable, transformer, generator, etc., impedances, to the resistive components (R)of those impedances; the applicable ANSI [1] [2] and IEEE [3] standards are very specific on themethod for calculating it. Every practical electrical power system has some inductive impedance,making the X/R ratio always larger than zero. An inductor stores energy in a magnetic field,which requires current flow. Because this energy cannot be dissipated instantaneously aninductor opposes changes to current flow. For fault conditions, this means that after a fault isinitiated there will be a DC offset to the fault current; the higher the X/R ratio, the higher the DCoffset. This DC offset must be taken into account when calculating the interrupting duty of faultinterrupting devices such as circuit breakers. The result, for low-voltage interrupting devices, isthat the fault duty that is used in comparison to the interrupting rating of the device will be higher(theoretical maximum is 31% higher for a molded-case circuit breaker with interrupting ratinggreater than 20kA) than the actual calculated fault current if the X/R ratio calculated at the point ofthe fault is greater than the X/R ratio for which the device has been tested. This can become anissue if the device has an interrupting rating only marginally higher than the available faultcurrent. Such a scenario unfortunately, occurs often in data center applications, especially whererelatively large low-voltage generators are operated in parallel.3.2.Coordination Study3.2.1. BackgroundThe purpose of a coordination study is to determine the proper settings for overcurrent protectivedevices in the power system. Ideally the selection of the proper settings will both protect thepower system equipment as well as remove only the smallest portion of the electrical system asnecessary from service in order to isolate a fault. In most cases however compromises must bemade in order to provide the best overall system reliability.In order to determine the proper setting for the Overcurrent protective devices they are plotted ontime-current curve graphs (TCCs). The time-current characteristics of properly coordinateddevices will not overlap on a TCC graph. An example of a TCC graph is shown in Fig. 5. Thedevices in this TCC graph correspond to the devices shown in the one-line diagram in Fig. 4.Revision 0 11/09www.criticalpowernow.comCopyright 2009 Schneider Electric. All Rights Reserved.Page 5 of 20
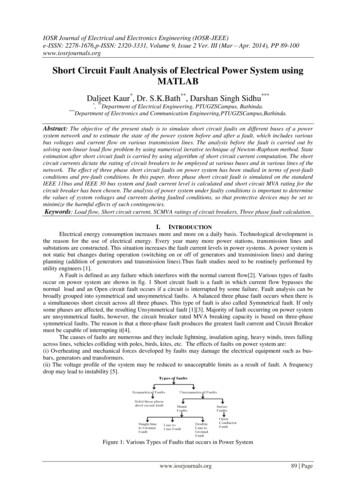
Short-Circuit, Coordination, and Arc-Flash Studies for Data Centers3.2.2. Interpreting a TCC GraphThe TCC graph relies on the information determined in the short circuit analysis to determinewhere the device time-current curve is cut off. Each device will have its characteristic cut off atthe maximum fault current available for the bus it is connected to. As stated earlier, most of thetime when there is no overlap on the TTC graph the devices can be said to coordinate.Many data centers utilize ANSI draw-out style switchgear, or similar, “hybrid,” switchboardconstruction, at the service entrance. This type of switchgear has the benefit of being able toconduct rated fault currents for time periods up to 30 cycles. This withstand capability allows theinstantaneous function of the main circuit breaker to be turned off in many cases avoiding overlapand providing for better coordinationThere are couple of exceptions to the no overlap concept. If two devices are operating in acurrent-limiting mode at the available fault current, the curves will fall below 0.01s on the TCCgraph. Even though they do not show overlap on the graph additional techniques are required tojudge selectivity. Generally this occurs with fuses and requires the use of fuse ratio tables todetermine selectivity.With circuit breakers there are some instances where the overlap of device characteristics doesnot necessarily mean that the devices do not coordinate. Most often this occurs with thermalmagnetic circuit breakers. This is illustrated in Fig. 5. Several circuit breaker manufacturerspublish what are called selectivity tables for their circuit breakers. These are similar to the fuseratio tables that have existed for fuses for many years. Fig. 6 shows a portion of such a table asit relates to the thermal magnetic circuit breakers presented in Fig. 5. Listed in the table is anupstream breaker, a downstream breaker and a maximum available fault current for which thedownstream breaker will open and clear a fault before the upstream breaker opens. Generally anote similar to the one shown in Fig. 5 is added to the TCC to indicate that the breakerscoordinate even though they overlap.Fig. 4 One-Line of Example TCCRevision 0 11/09www.criticalpowernow.comCopyright 2009 Schneider Electric. All Rights Reserved.Page 6 of 20
Short-Circuit, Coordination, and Arc-Flash Studies for Data CentersFig. 5 Typical TCC GraphRevision 0 11/09www.criticalpowernow.comCopyright 2009 Schneider Electric. All Rights Reserved.Page 7 of 20
Short-Circuit, Coordination, and Arc-Flash Studies for Data CentersFig. 6 Circuit Breaker Selectivity Table3.2.3. Coordinating Parallel GeneratorsThe coordination of parallel generators can pose a challenge. It is not uncommon for the feederbreakers in generator paralleling switchgear to have a similar long time trip rating as thegenerator breakers. In such an instance it may be impossible to adjust the devices to have goodselective coordination while providing protection that matches the generator’s decrement curve.If two identically sized generators with identical impedance characteristics are operating inparallel, the fault current will be split approximately equally between the two generators. Thismeans that the generator breakers will only see half of the fault current that a feeder breakerwould see. Using this relationship, the generator breaker curves can be shifted to the right by afactor of two. This shifting of the curves allows a visual representation of the actual conditionsthat exist during the parallel operation. The same methodology applies to numbers of generatorbreakers greater than two – the curves would be shifted by a factor of 3 for 3 breakers, 4 for 4breakers, etc. Strictly speaking, such shifting of curves applies only to faulted conditions wherethe fault is downstream of both breakers with shifted curves, and not to overloads. If only one ofthe sources is in operation, however, fault overcurrent coordination would still be based on thenon-shifted curves.This technique could also be applied to a generator paralleled with a transformer or twogenerators of different sizes. The scaling factors would simply need to be adjusted based on theratio of the impedances of the sources.Fig. 7 is a sample one-line of two parallel generators. The generator paralleling switchgear feedsa distribution switchboard that then feeds several UPSs, one of which is shown. Fig. 8 shows aRevision 0 11/09www.criticalpowernow.comCopyright 2009 Schneider Electric. All Rights Reserved.Page 8 of 20
Short-Circuit, Coordination, and Arc-Flash Studies for Data CentersTCC drawing based on the one-line. As can be seen perfect selective coordination is obtained allthe way up to the switchboard feeder breaker. There is a lack of selective coordination with thegenerator breaker however. This is because the generator breaker had to be adjusted so that thegenerator is adequately protected for short-circuit conditions.Since there are two parallel generators Fig. 9 shows the generator breaker and decrement curveshifted to the right. Since there are two generators the curves were shifted by a factor of two. Ascan be seen, when two generators are operating in parallel perfect selective coordination exists.Fig. 7 Parallel Generator Example TCCs One-Line DiagramRevision 0 11/09www.criticalpowernow.comCopyright 2009 Schneider Electric. All Rights Reserved.Page 9 of 20
Short-Circuit, Coordination, and Arc-Flash Studies for Data CentersFig. 8 Parallel Generator Example TCC – Un-shiftedRevision 0 11/09www.criticalpowernow.comCopyright 2009 Schneider Electric. All Rights Reserved.Page 10 of 20
Short-Circuit, Coordination, and Arc-Flash Studies for Data CentersFig. 9 Parallel Generator Example TCC - ShiftedRevision 0 11/09www.criticalpowernow.comCopyright 2009 Schneider Electric. All Rights Reserved.Page 11 of 20
Short-Circuit, Coordination, and Arc-Flash Studies for Data Centers3.3.Arc-Flash Study3.3.1. BackgroundAn arc-flash hazard analysis has become a standard part of many system studies. The purposeof the analysis is to determine the available arc-flash incident energy at all of the busses in thepower system so that electrical workers are aware of the potential hazard and can make informedchoices about personal protective equipment.The foundations of arc-flash analysis are the IEEE-1584-2002 [4] and NFPA 70E-2009 [5]standards. The calculation methodologies require the results of the short circuit and coordinationstudies. The results of these studies must be applied carefully to the arc-flash analysis so thatrealistic estimates of the available incident energy are made.3.3.2. Multiple Operating ScenariosOnce again, multiple operating scenarios will need to be considered by the system studyengineer in order to properly calculate the incident energy levels in the system. Unlike shortcircuit studies where we are concerned with the maximum available fault current with arc-flashstudies we are really concerned with all possible available fault currents. In many cases thehighest incident energy levels are produced by the scenario that produces the lowest availablefault current. This is because fault currents that fall just below the instantaneous or short timepickup of circuit breakers will last for a much longer time period and therefore expose an electricalworker to more energy.3.3.3. PDUs and TransformersAccording to IEEE 1584, busses operating at 240V or less fed by transformers less than 125kVAin size do not need to be considered in an arc-flash hazard analysis and can be assumed to beCategory 0 (1.2 cal/cm 2) Many data centers, however, use transformers larger than 125kVA intheir PDUs. This can pose a problem if trying to keep the incident energy levels in the powersystem low.There are two problems with 480 to 208V transformers related to arc-flash within data centers.The first has to do with the physical construction of the PDUs and the second is related to the lowlevel of arcing faults on the 208V terminals of the transformer.3.3.3.1.Low Level Arcing FaultsThe arcing fault current on the secondary of a 480 to 208V transformer is usually relatively lowwhen compared to the instantaneous pickup of the 480V breaker feeding the PDU. Due to thisthe primary breaker usually takes several seconds to clear a fault on the 208V side. When thearc-flash calculations are stopped at two seconds, per IEEE 1584, a Category 3 arc-flashhazard/risk rating is very common. It should be noted, that for locations where clear egress is notpossible, it may be prudent to extend the calculations past 2 seconds. Unfortunately, there arevery few cost effective solutions to decrease the hazard at this location in a power system. Onework-around is to consider the equipment construction and layout.3.3.3.2.PDU ConstructionTypically, PDUs are constructed with the 208V secondary breakers and a branch circuitpanelboard within the same enclosure. This poses two risks. First the primary of the transformerrepresents a 480V hazard while a worker is performing work on the 208V components. Thesecond risk is exposure to the line side of the 208V secondary breakers. As discussed earlierRevision 0 11/09Page 12 of 20www.criticalpowernow.comCopyright 2009 Schneider Electric. All Rights Reserved.
Short-Circuit, Coordination, and Arc-Flash Studies for Data Centersthis location is quite often Category 3. Since all of the components are in the same enclosure thisrating must be applied to the entire PDU.There is a possible solutions to this problem.3.3.3.2.1. Provide Separate Enclosure for PanelboardsA solution is to move the branch circuit panelboards to a separate enclosure. Most of the timethe 208V breaker feeding the branch circuit panelboard is capable of interrupting the arcing faultfast enough to allow for a Category 0 rating at the panel. By moving it to a separate enclosurethe worker is no longer exposed to the unprotected transformer secondary when working on thebranch circuit panelboard. The hazard still exists in the PDU but workers need access to thePDU much less often then the panelboards.3.3.4. UPS Systems and Arcing Fault CurrentsIt has been common practice when performing arc-flash studies to assume that a UPS systemwill switch into bypass during an arcing fault. If the arcing fault current is too low, however, thismay not be the case.Information about the behavior of a UPS system for low level arcing faults is difficult to obtainfrom most of the major UPS manufacturers. The information that is available shows that differentUPS models have different behaviors even from the same manufacturer.In general, if the arcing fault current is less than the overload rating of the UPS the unit will notswitch into bypass and the only current flow will be from the output of the UPS itself.For slightly higher faults the unit may operate in what one manufacturer called pulsed parallelmode in which both the UPS output and the bypass are paralleled for approximately 40milliseconds at which time the UPS output breaker will open leaving only the bypass to supply thefault.The third scenario is one in which the fault current significantly exceeds the UPS overload rating.In this case the UPS will immediately switch to bypass mode.The scenario that produces the worst case incident energy level could vary significantlydepending on the UPS size, available fault current and overcurrent protection types. Eachsystem should be carefully considered in consultation with the UPS manufacturer’s publisheddata to make a determination.3.3.4.1.UPS ExampleFor example, one particular UPS system, with a Static Transfer Switch (STS), will conduct foroverloads that exceed 155% of the on-line modules. This essentially places the UPS output andthe bypass source in parallel to feed the fault for 40 milliseconds. The downstream faulted buswill therefore experience an available fault current consisting of both the UPS inverter capabilityand the bypass source for that duration. If the fault has not cleared in that time, the STS willcontinue to conduct while the UPS output breaker opens and the bypass breaker closesTo apply this to an arc flash analysis for loads supplied by such a UPS system, the idea is tocompare the calculated arcing current at the downstream busses, supplied from the UPS to theoverload capability of the UPS (155% of the online modules). If the calculated arcing current atthe downstream bus exceeds the overload capability of the UPS, then the downstream panel canbe evaluated in Bypass mode only. If the arcing current is insufficient to cause the STS toconduct in "pulsed parallel" operation, then that downstream bus should be evaluated separatelyRevision 0 11/09www.criticalpowernow.comCopyright 2009 Schneider Electric. All Rights Reserved.Page 13 of 20
Short-Circuit, Coordination, and Arc-Flash Studies for Data Centersfor arc flash based on the UPS supply only and in bypass, with the worse case determined andreported.4. Power System DataAccurate data about the power system is essential for any system study to accurately predict itsbehavior. Sometimes even seemingly insignificant errors in the system data can producesignificant errors in the study results. This is especially the case with an arc-flash hazardanalysis.4.1.Effects of Inaccurate Data on System StudiesIt is possible for small errors in the power system data to have a very significant effect on arcflash calculations. It is therefore necessary that the power system data be as accurate aspossible. Underestimating cable lengths can cause arc-flash incident energy levels to beunderreported. Overestimating lengths could also have an effect when comparing the withstandratings of equipment when performing a short circuit analysis if the fault current fall close to theactual equipment rating.Another area that could cause significant errors is neglecting to consider the type of conduit usedfor feeders. Assuming magnetic conduit when PVC is actually used or vice-versa can have asignificant effect on the fault current calculations.Finally, a third common area that can introduce errors is the available utility fault current.4.1.1. Incorrect Cable LengthsAs stated earlier, incorrectly estimating the lengths of the power cables in the system can have anegative impact on the study results. There are two concerns that are in opposition with eachother. The first concern would be to overestimate the length. Overestimating the length wouldcause the study results to underestimate the available fault current at a bus and determining thatdevices are adequately rated when they are not. Generally, this would only be a problem for agross overestimation of the lengths since most of the time equipment rating are not chosen to betoo close to the available fault current. It is also relatively easy to guard against this situation.Simply scanning through the short circuit comparison table will quickly show devices that areclose to their interrupting rating. If there is little confidence in the accuracy of the cable lengthssome time could be spent on only these cable to obtain more accurate information.The second concern would be underestimating the cable lengths. This is an issue more relatedto the arc-flash analysis. When performing an arc-flash analysis the clearing time of theupstream devices is taken from the device time current curve based on the arcing fault currentcalculated using the equations in IEEE 1584. In order to illustrate the underlying issue Fig. 10shows a time-current curve of a circuit breaker. Also shown, is an example of an arbitrary arcingfault current that may be calculated using the IEEE 1584 equations (1850A). This current wouldbe used to determine the clearing time of the breaker. In addition to the calculated arcing faultcurrent IEEE 1584 specifies that the device clearing time also be determined at 85% of thecalculated current. The incident energy is then calculated at both arcing current levels andclearing times. The highest incident energy level of the two is reported. Since it is impossible toexactly predict the arcing fault current this is done to account for arcing fault currents that areclose to a point of discontinuity on the protective device time-current curve. With the example inFig. 10 the first calculated current falls into the instantaneous trip region of the circuit breakerclearing in less than 0.02s. The low arcing tolerance (85%) current falls into the long time regionof the breaker taking several seconds to clear, Since time is gener
X/R Ratio The X/R ratio is a measure of the ratio of the inductive reactance (X), consisting of the inductive components of cable, transformer, generator, etc., impedances, to the resistive components (R) of those impedances; the applicable ANSI [1] [2] and IEEE [3] stan