Transcription
SampleArc Flash Risk StudyUsing IEEE 1584-2018
Table of Contents1Introduction31.11.2PurposeMethod332Study Results52.12.22.32.4Fault currentsCoordinationArc Flash HazardArc Flash Risk55663Power System Model73.13.23.3SourcesScenariosAssumptions & Approximations777ACalculation Results8A.1A.2A.3A.4A.5A.6A.7Single Line DiagramInput DataFault currentsCoordinationTime-current DiagramsIEEE 1584-2018 Calculation ResultsArc Flash Risk891011131517This report has been prepared by:Vrielink Electrical ServicesDe Spinde 1708102 LG RaalteThe Netherlandswww.vrielink-es.comAuthor:Joost Vrielink
1 Introduction1.1PurposeThis is a sample arc flash risk study based on a fictional industrial power system. For moreinformation about this sample report or arc flash hazard calculation studies please contact:Vrielink Electrical ServicesEmail: contact@vrielink-es.comPhone: 316 4641 4084Or visit www.vrielink-es.com1.2MethodTo determine arc hazard level the IEEE Standard 1584 can be used to calculate the incidentenergy and arc flash boundary. The standard provides the following method for calculation:1.2.3.4.5.Gather data for a short-circuit and protective device coordination studyCalculate short-circuit currentCalculate the arcing currentDetermine the trip time for the arcing currentCalculate the incident energy in cal/cm²The equations for calculating arcing current and incident energy are empirically derived frommeasurements performed on electrical arcs. These equations have a limited range of validity forcurrent and voltage although for most industrial systems these limits are not reached.1.2.1Data CollectionDetails about the electrical distribution system are required to accurately calculate the hazardlevel. The following lists the information typically required: Utility data; fault contribution and protection settingsOne Line Diagrams showing the main electrical equipmentWhen one-line diagrams do not show complete distribution, an additional listshould be obtained of all three-phase electrical distribution panels. These are thelocations that are going to be labeled (and calculated). Loads and single-phasedistribution are not applicable.Cable List with Sizes & Lengths. If estimated, the lengths that are at least accurateto within about 5m.Relay and circuit breaker setting schedule.Typically, an onsite data collection effort is required to verify drawings are accurate. This isespecially a concern for older installations.1.2.23ScenariosWhen the electrical distribution system is operated in different modes, scenarios can becreated that simulate the entire range of operating parameters. This ensures that the worstcase hazard is found. As an example, the following scenarios may be created:Sample Arc Flash Hazard Calculation Studywww.vrielink-es.com
Maximum Utility – full contribution of all sources, including motorsMinimum Utility – minimum contribution of utility and all rotating equipment outof serviceEmergency – with emergency generators supplying part of the systemA calculation needs to be performed for all applicable scenarios, evaluation should be based onthe worst-case result. Which scenario yields the worst-case result is determined for each locationseparately.1.2.3Short-circuit EvaluationThe results of the short-circuit evaluation can be used for checking if switchgear andprotective devices are adequately rated against short-circuit currents.During data collection the short-circuit withstand of all switchgear and protective devices isgathered and compared to the maximum calculated short-circuit current. When current-limitingdevices are present (such as fuses or molded-case circuit breakers) their limiting effect will beincluded as far as documentation is available.The following parameters are evaluated: The symmetrical (RMS) withstand current for thermal withstandThe peak current for mechanical withstandAny issues with inadequate rating of equipment are immediately reported, as they can createunsafe working conditions.1.2.4Protective Device EvaluationOvercurrent devices that are modelled should be checked for miscoordination for overload andshort-circuit currents. When during an overcurrent more than one device trips, these devices aresaid to not provide full coordination, and this may present operational issues (although notnecessarily safety related). In this case alternative protection settings can be explored that doprovide improved or full coordination.A report should include a list of locations where full coordination is not available. Alternativeprotection settings can be presented with their limits, as this is usually a compromise betweenoperational stability, safety and cost. A setting evaluation will consider the following information: 1.2.54Connected loads and system stabilitySystem coordinationArc flash hazard levelsArc Flash Hazard CalculationUsing the result of the short-circuit evaluation and the protection device coordination studies,the arc flash incident energy and the associated boundary can be calculated according to theequations in IEEE Standard 1584. A report should provide the calculation results, source dataand any approximations or analytical variables used.Sample Arc Flash Hazard Calculation Studywww.vrielink-es.com
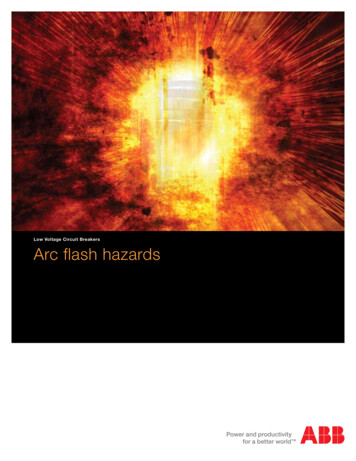
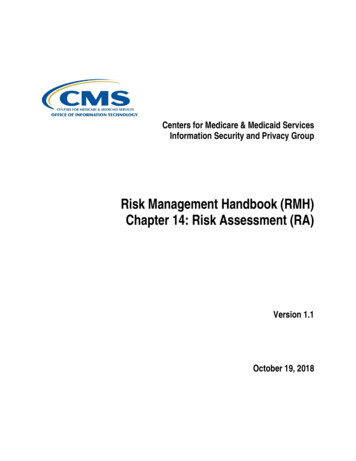
2 Study Results2.1Fault currentsFor evaluating equipment, the results of fault calculation according to IEC 60909 are comparedto withstand values of switchgear and protective devices. Equipment that is not rated highenough against short-circuit currents could fail when a fault occurs and lead to injury.symmetricalwithstand current50424236803636swgLVswgLV - pd-TswgLV - pd-GswgLV - pd-1swgLV - pd-2pnl1pnl2IEC 60909I’’k2828282828137assymetricalpeak current1108888761767676IEC 60909Ip62626262622212In this sample report no issues were found with equipment fault withstand capabilities. In casethere are this typically means equipment must be replaced or protected with fault limitingprotective devices such as fuses.2.2CoordinationA Protective Device Coordination Study is required for the arc flash hazard calculation todetermine the time it takes for arc flash currents to be interrupted. The study will also showhow protective devices (relays, circuit breakers and fuses) react when a fault occurs. If they arenot properly coordinated, a larger part of the electrical system might be shut down to isolate afault. The study will identify these problems and provide recommendations to improvecoordination and reliability of the total electrical system.In this sample study some issues with coordination are found for the main incomingprotection breakers (pd-T and pd-G) with outgoing feeder protection pd-1:pd-Tpd-Gpd-1pd-22.2.1pd-T9 kAfullpd-G9 kAfullSolutions for improved coordinationCoordination can be improved by using settings as recommended in Table lfullpd-GfullfullSample Arc Flash Hazard Calculation Studywww.vrielink-es.com
2.3Arc Flash HazardWith the results of the short-circuit fault and coordination study the arc flash hazard can becalculated. The IEEE 1584-2018 Guide results in a hazard calculation expressed in cal/cm²based on the arcing fault and duration.2.3.1Overview of results for this sample system. For more details see annex A.6 on page 15.Label##001#001.1#001.2#002#003Bus name / PD name (side)swgLV (BUS)swgLV / pd-G (LINE)swgLV / pd-T (LINE)pnl1 (BUS)pnl2 (BUS)Ia18.3 kA21.0 kA18.4 kA8.3 kA4.2 kAt2.00 s2.00 s2.00 s0.05 s0.00 sEnergy43.6 cal/cm²22.1 cal/cm²97.1 cal/cm²1.0 cal/cm²0.0 cal/cm²RemarksLong delay for generator protection pd-G.No protection between generator and swgLV.Long delay for medium voltage protection pd-tx.With the results of this study, control measures can be identified to reduce overall arc flashrisk. As an example, in this study recommended settings have been identified that reducehazard. This is a low-cost measure that can yield massive reduction in hazard and oftenimproves the system coordination.2.3.2Results with recommended settings with reduced arc flash riskLabel##001#001.1#001.2#002#0032.4Bus name / PD name (side)swgLV (BUS)swgLV / pd-G (LINE)swgLV / pd-T (LINE)pnl1 (BUS)pnl2 (BUS)Ia18.3 kA21.0 kA18.4 kA8.3 kA4.2 kAt0.10 s2.00 s0.20 s0.05 s0.00 sEnergy6.5 cal/cm²22.1 cal/cm²10.1 cal/cm²1.0 cal/cm²0.0 cal/cm²RemarksShorter delay for generator protection pd-G.No protection between generator and swgLV.Shorter delay for medium voltage protection pd-tx.Arc Flash RiskAnnex A.7 on page 17 shows an example how risk assessment for arc flash can be performed.When using this method control measures should be implemented in the following cases:-Tasks with a remote or improbable likelihood and a calculated hazard 1.2 cal/cm².Special consideration for remote likelihood and calculated hazard 12 cal/cm².Conversely, additional control measures, including PPE, are not required for:-Tasks with a calculated hazard 1.2 cal/cm².Tasks with an incredible likelihood.Risk assessment is usually adapted to be in line with a company’s established risk assessmentmethod, including for example the use of a risk matrix.6Sample Arc Flash Hazard Calculation Studywww.vrielink-es.com
3 Power System ModelThe hazard calculation requires an accurate representation of the electrical system to getreliable results. Information sources are typically a combination of existing site documentationand a site visit where information is verified or completed.3.13.2Sources Data collection site visit Site electrical single line diagram (outline of electrical configuration, basic information)Relay and circuit breaker setting schedule (breaker types, settings)Cable schedule (cable sizes, lengths)ScenariosIf PPE are used to mitigate arc flash hazard, the worst-case occurring incident energy shouldbe considered. Because of this, the hazard calculation will consist of multiple calculations ofthe electrical distribution system in different switching configurations or scenarios. Some ofthe reasons to use multiple scenarios are emergency generators, paralleling of transformersand a difference between the minimum and maximum utility contribution.In the sample study three scenarios are calculated, depending on the use of utility andgenerator contribution to esyesnoGeneratornoyesyesAssumptions & ApproximationsIf information is not available in the provided site documentation and these cannot becompleted during a site visit, assumptions are made where they are not expected to make alarge impact on arc flash hazard. In rare cases these assumptions are not possible and a rangeof values are used in different scenarios to make sure the worst-case is covered. All cable lengths are estimates rounded to the closest 5 meters.Thermal motor protection for motor m2 has not been modelled, as it does notaffect arc flash 3.3.1Utility R/X ratio assumed at 0.1.Transformer X/R ratio assumed at typical values.Maximum arcing timeThe maximum arcing time has been limited to 2 seconds, based on IEEE 1584 6.9.1:"If the time is longer than two seconds, consider how long a person is likely to remain in thelocation of the arc flash. It is likely that the person exposed to arc flash will move away quickly ifit is physically possible and two seconds is a reasonable maximum time for calculations. Aperson in a bucket truck or a person who has crawled into equipment will need more time tomove away."7Sample Arc Flash Hazard Calculation Studywww.vrielink-es.com
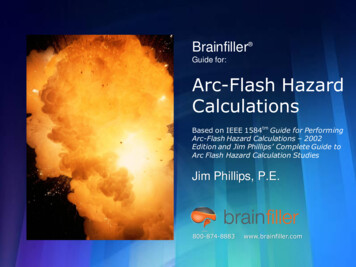
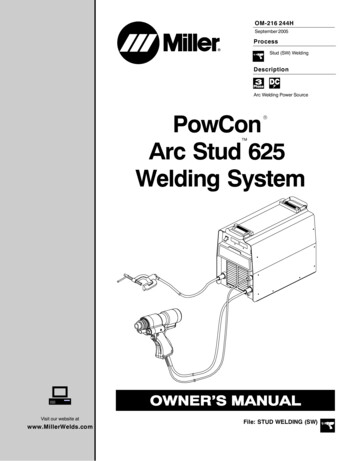
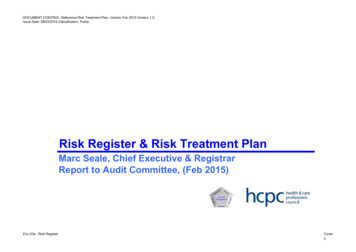
A Calculation ResultsA.1Single Line DiagramUTILITYIsc 3P 250.0 MVAIsc SLG 0.0 MVApd-txI , I transformer10000/400VS 1000kVA6.00%swgLV400Vpnl1400V8generator630 kVAX"d 0.15 pu3// 240 cu10m2// 240 cu10mpd-TACB1600 B1600AF/1600ATpd-GACB1000 B1000AF/1000ATpd-1MCCB250H250AF/250ATpd-2NV/NHgG 63A63AF/63AT1// 95 cu60m1// 25 cu40mpnl2400VSample Arc Flash Hazard Calculation Studywww.vrielink-es.com
A.2Input DataA.2.1Distribution equipmentLabel ##001#001.1#001.2#002#003A.2.2Bus oundInUTILITYSizeVector / Z%1000 kVADyn1 / 6.00%Transformerc-txc-genc-pnl1c-pnl29Withstand50 kA50 kA50 kA36 kA36 kAZ (pu)Z0 pu0.0496 j0.3969 j VoltageAmpacity400V909 AZ (pu)Z0 pu1.58 j23.811.58 j23.81VoltageAmpacity10000/400V58/1443 AZ (pu)Z0 pu1.03 j5.911.03 j5.91TransformersTransformerCable3P ContributionSLG Contribution250.0 MVA0.0 MVASizeX’’d630 CCBGeneratorsGeneratorA.2.4Dimensions508x508x250 cm750x750x250 cm750x750x250 cm508x508x250 cm508x508x250 cmUtilityUtilityA.2.3Voltage400 V400 V400 V400 V400 gLVpnl2SizeLength3//240 mm² cu10.0 m2//240 mm² cu10.0 m1//95 mm² cu60.0 m1//25 mm² cu40.0 mZ puZ0 pu0.20 j0.160.32 j0.420.30 j0.250.48 j0.629.23 j3.1814.67 j8.0923.18 j2.2936.84 j5.81Sample Arc Flash Hazard Calculation Studywww.vrielink-es.com
A.3Fault currentsA.3.1IEC 60909 ResultsLabel #Bus nameVoltage#001swgLV400 V#002pnl1400 V#003pnl2400 VA.3.2Ik''21.91 kA28.25 kA6.52 kA11.25 kA12.55 kA5.39 kA6.80 kA7.11 kA4.60 kAIp48.68 kA63.28 kA15.00 kA17.36 kA21.84 kA9.86 kA9.82 kA11.80 kA7.08 kAIk21.91 kA22.99 kA1.75 kA11.25 kA11.20 kA1.72 kA6.80 kA6.82 kA1.68 kAIk''(SLG)22.06 kA28.36 kA6.48 kA9.64 kA10.57 kA4.99 kA5.78 kA6.00 kA4.15 kAIp(SLG)48.83 kA64.14 kA15.89 kA14.87 kA16.05 kA9.24 kA8.35 kA8.66 kA6.34 kAComparison of Fault Study Results with equipment ratingsswgLVswgLV - pd-TswgLV - pd-GswgLV - pd-1swgLV - metricalwithstand current50424236803636IEC 60909I’’k2828282828137assymetricalpeak current1108888761767676IEC 60909Ip62626262622212Table: reference for equipment evaluation with IEC 60909 resultssymmetricalsymmetricalasymmetricalbreaking currentwithstand currentpeak currentStudy Results (IEC 60909)I’’k, Ib (1)IkIpLV Switchgear (IEC 61439)ICWIpkLV Circuit Breakers (IEC 60947)ICU, ICS (2)ICWICMMV Switchgear (IEC 62271)IkImaMV Circuit B
To determine arc hazard level the IEEE Standard 1584 can be used to calculate the incident energy and arc flash boundary. The standard provides the following method for calculation: 1. Gather data for a short-circuit and protective device coordination study 2. Calculate short-circuit current 3. Calculate the arcing current 4. Determine the trip time for the arcing current