Transcription
MASTER OF BUSINESS ANALYTICSEMPLOYMENT REPORT2020
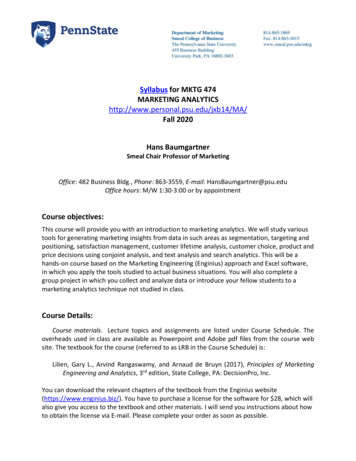
I am happy to share employment outcomes for MBAn Class of 2020.The MBAn Class of 2020 performed well in 2020 despite marketinstability, with 100% receiving offers within six months of graduation.MBAn graduates pivoted to opportunities in the market, supported bystrong faculty, corporate, and alumni partnerships at the school. We arethankful to the many members of the MIT Sloan community who cametogether to support students seeking opportunities in 2020.This year, the top industries for MBAns were Technology (35.2%),Consulting (22.2%), and Retail/CPG (16.6%), with students acceptingopportunities in Pharma/Health/Biotech (13%) and Finance (7.4%) aswell. In 2020, all graduates accepted roles in Data Science functions.The 60 students in the MBAn Class of 2020 accepted opportunitieswith nearly 40 companies. The Analytics Capstone is a key elementof the MBAn experience, allowing students to apply their knowledgeto real-world data challenges, and we are pleased that 20.4% of theaccepted offers came from Analytics Capstone companies (see page 6for the list of companies).88.9% of job-seeking MBAns accepted offers in the US. The topmetro areas this year were New York (18.5%), Boston (16.7%),San Francisco (16.7%), and Seattle (13%). We saw growth in newregions, particularly the Mid-Atlantic, South and Mid-West.The average base salary in 2020 was 114,305, with an averagesigning bonus of 11,479. This shift in average salary and bonus likelyreflects both market uncertainty in the summer of 2020, and the shiftin industries and locations where students accepted offers.With growth potential as the top reason (31.7%) graduates acceptedtheir positions, I am pleased our students found opportunities forimpact at so many innovative, data-focused organizations across thecountry and the globe.MASTER OF BUSINESS ANALYTICSEMPLOYMENT HIGHLIGHTS100%of job-seeking MBAn Class of 2020s acceptedan offer within 6 months of graduation88.9%of job-seeking MBAn Class of 2020saccepted offers in the USSALARY SUMMARY 114,305Average Base SalarySIGNING BONUS 11,479Average Guaranteed Bonus CompensationTOP INDUSTRIESOther 5.6%Financial 7.4%Technology 35.2%Pharmaceutical/Healthcare/Biotechnology 13.0%Thank you for your support of MIT Sloan!Susan Sandler BrennanAssistant Dean,MIT Sloan Career Development OfficeMIT SLOAN MASTER OF BUSINESS ANALYTICS EMPLOYMENT REPORT Page 2Retail / CPG 16.6%Consulting 22.2%
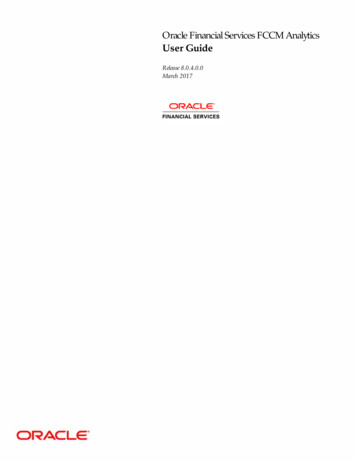
FEATURED EMPLOYERS OF MBAn CLASS OF 2020McKinsey & Company (5)Medidata SolutionsNordstromPalantirPfizerProcter & GambleRent the RunwayRestaurant Brands International (2)RobinhoodShopifyThe Travelers CompaniesUberWalmartAetna/CVS Health (3)1Alibaba Group (2)AmazonAppleAssurance IQ (4)BCG Gamma (2)Benefits Science Technologies (2)CMA CGMComcast (3)End-to-End Analytics (3)FacebookGoogleKlaviyo1MIT Sloan’s Master of Business Analytics (MBAn) programanswers the industry’s demand for highly analyticalgraduates who can manage modern data science tosolve critical business challenges.Parentheses indicate number of students hired.FEATURED MBAn JOB ROLESAnalytics AnalystData AnalystData Science Analyticsand Behavior ChangeData Science SpecialistData ScientistDecision Analytics AssociateMachine Learning EngineerMachine Learning ScientistQuantitative ResearcherResearch ScientistSr. Consultant, Research & AnalyticsLOCATIONS OF ACCEPTED OFFERS IN THE US2SeattleMetroNortheast40.7%West29.6%SF tonMetroNYCMetroSouth3.7%Top Metro Areas2Percentages are based on total accepted offers.MIT SLOAN MASTER OF BUSINESS ANALYTICS EMPLOYMENT REPORT Page 3
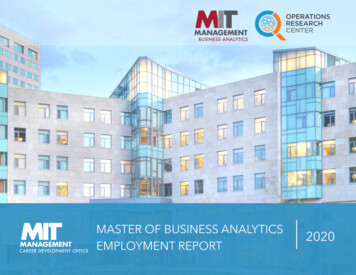
MASTER OF BUSINESS ANALYTICS CLASS OF 2020 EMPLOYMENT DATACLASS PROFILENumber of Candidates60U.S. Citizens/Permanent Residents27%International73%Countries Represented19Women40%Median GRE Quantitative168Average Undergraduate GPA (out of 4.0)3.9Average Full-Time Work Experience119 monthsIncludes internships.SALARY DATAEMPLOYMENT PROFILECOUNT%60100%MEANMEDIANRANGESeeking5490.0% 114,305 115,000 79,000- 155,000Not Seeking610.0%Sponsored and Returning58.3%Continuing Education (PhD)11.7%Total100%Employment data includes responses from100% of the 2020 MBAn graduatesMIT SLOAN MASTER OF BUSINESS ANALYTICS EMPLOYMENT REPORT Page 4BASE SALARY2292.6% of students accepting an offer provided compensation data.SIGNING BONUS33MEANMEDIANRANGE 11,479 8,800 5,000- 77,000Of the students who accepted an offer and reported valid salary data,58% reported receiving a signing bonus.
MASTER OF BUSINESS ANALYTICS CLASS OF 2020 EMPLOYMENT DATAOFFER TIMING AND SOURCEINDUSTRY%MEANMEDIANRANGETechnology35.2% 121,200 120,000 79,000- 150,000Consulting22.2% 106,730 105,000 79,000- 155,000Retail/CPG16.6% 112,111 110,000 82,000- % 122,250 120,000 120,000- 130,000TIMING OF ACCEPTED OFFERS%AT GRADUATION63%WITHIN 6 MONTHS OF GRADUATION100%SOURCE OF OFFERS%Financial7.4%Other 11 110,0005.6% 88,333 110,000 90,000100%Capstone, Career Fair, Data Trek,Faculty Referral, Alumni, OperationsResearch CenterContacted Directly, LinkedIn, PersonalNetwork, Job Postings, Previous EmployerFunctions within Data Scienceof accepted offers were 80,000- 95,000SCHOOL FACILITATED53.1%STUDENT FACILITATEDOther includes Transportation/Equipment/Defense, Energy.JOB FUNCTION 90,000- 130,00046.9%TOP 3 REASONS FORACCEPTING OFFERGrowth Potential31.7%Job Function26.8%People/Corporate Culture14.6%Consulting 16.7%data science functionsResearch 9.3%Business & Strategic Analytics 5.6%Finance 3.6%Business Intelligence & Information Technology 3.6%Operations 1.9%MIT SLOAN MASTER OF BUSINESS ANALYTICS EMPLOYMENT REPORT Page 5
MASTER OF BUSINESS ANALYTICS CLASS OF 2020 EMPLOYMENT DATAREGIONAB-InBev%MEANMEDIANRANGE88.9% 116,799 120,000 80,000- 155,000Air Canada40.7% 116,591 120,000 85,000- 155,000Assurance IQNew York City Metro18.5% 116,364 120,000 88,000- 129,000BMWBoston Metro16.7% 117,222 120,000 85,000- 155,000Coca Cola29.6% 123,735 120,000 90,000- 150,000Comcast16.7% 111,084 110,000 90,000- 130,000DHL13.0% 140,000 150,000 110,000- 150,000Estee Lauder18.6% 108,615 110,000 80,000- 135,000General Motors9.3% 113,125 110,000 95,000- 135,000GroupM3.7%-1--Hartford Hospital1--MailChimpMBTAUnited StatesNORTHEASTWESTSan Francisco Bay AreaSeattle MetroRest of 1% 82,500 80,500 79,000- -PfizerRest of WorldEUROPE12020 ANALYTICSCAPSTONE COMPANIES-Dash indicates fewer than three people or less than 1% reported salary information .MBAn ANALYTICS CAPSTONEThe Analytics Capstone Project is a core component of the MBAn program, giving studentsreal-world experience solving data challenges from organizations around the world.Dedicated teams of students use analytical tools to solve key business challenges and presentapplicable solutions at the completion of the 7-month capstone project.20.4%of accepted offers came fromAnalytics Capstone bSwiss ReUnileverUSPSWalmartWayfairMIT SLOAN MASTER OF BUSINESS ANALYTICS EMPLOYMENT REPORT Page 6
MASTER OF BUSINESS ANALYTICS CONTACTSCareer Development OfficeMaster of Business Analytics Program OfficeTracy WishonMBAn Career Advisortwishon@mit.edu1-617-258-9623Michelle LiDirectorlimi@mit.edu1-617-324-7764Accuracy in Reporting Employment StatisticsThe MIT Sloan School of Management adheres to the MBA Career Services& Employer Alliance (MBA CSEA) Standards for Reporting Employment Statistics (mbacsea.org).Conformance to this business school industry standard ensures accurate and comparable employment data. Currently, the majority of the leading MBA programs adhere to these accepted reportingstandards. MIT Sloan takes a leadership role to promote the importance of accurate and comparableemployment and salary statistics to prospective students and employers.Nondiscrimination Policy: Commitment to Equal OpportunityThe Massachusetts Institute of Technology is committed to the principle of equal opportunity ineducation and employment. The Institute prohibits discrimination against individuals on the basisof race, color, sex, sexual orientation, gender identity, pregnancy, religion, disability, age, geneticinformation, veteran status, or national or ethnic origin in the administration of its educational policies, admissions policies, employment policies, scholarship and loan programs, and other Instituteadministered programs and activities; the Institute may, however, favor US citizens or residents inadmissions and financial aid.*The Vice President for Human Resources is designated as the Institute’s Equal Opportunity Officer.Inquiries concerning the Institute’s policies, compliance with applicable laws, statutes, and regulations, and complaints may be directed to Ramona Allen, Vice President for Human Resources, Building NE49-5000, 617-324-5675. In addition, inquiries about Title IX (which prohibits discrimination onthe basis of sex) may be directed to the Institute’s Title IX coordinator, Sarah Rankin, Room W31-223,617-324-7526, titleIX@mit.edu. Inquiries about the laws and about compliance may also be directedto the US Department of Education, Office for Civil Rights, Region I, 5 Post Office Square, 8th Floor,Boston, MA 02109-3921, 617-289-0111, OCR.Boston@ed.gov.The ROTC programs at MIT are operated under Department of Defense (DoD) policies and regulations, and do not complyfully with MIT’s policy of nondiscrimination with regard to gender identity. MIT continues to advocate for a change in DoD policies and regulations concerning gender identity, and is committed to providing alternative financial assistance under a needsbased assessment to any MIT student who loses ROTC financial aid because of these DoD policies and regulations.*MIT SLOAN MASTER OF BUSINESS ANALYTICS EMPLOYMENT REPORT Page 7
MASTER OF BUSINESS ANALYTICS CLASS OF 2020 EMPLOYMENT DATA REGION % MEAN MEDIAN RANGE United States 88.9% 116,799 120,000 80,000- 155,000 NORTHEAST 40.7% 116,591 120,000 85,000- 155,000 New York City Metro BMW 18.5% 116,364 120,000 88,00