Transcription
Q2Quarterly Market ReviewSecond Quarter 2021
Quarterly Market ReviewSecond Quarter 2021This report features world capital market performance and atimeline of events for the past quarter. It begins with a globaloverview, then features the returns of stock and bond assetclasses in the US and international markets.The report also illustrates the impact of globally diversifiedportfolios and features a quarterly topic.Overview:Market SummaryWorld Stock Market PerformanceWorld Asset ClassesUS StocksInternational Developed StocksEmerging Markets StocksSelect Market PerformanceSelect Currency Performance vs. US DollarReal Estate Investment Trusts (REITs)CommoditiesFixed IncomeGlobal Fixed IncomeImpact of DiversificationInflation: An Exchange BetweenEugene Fama and David Booth2
Quarterly Market SummaryIndex ReturnsUS StockMarketInternationalDevelopedStocks2Q dMarketex USUS 4.6%2020 Q22009 Q22009 Q22009 Q32001 Q32008 Q4-22.8%-23.3%-27.6%-36.1%-3.4%-2.7%2008 Q42020 Q12008 Q42008 Q42021 Q12015 Q2Since Jan. 2001Avg. Quarterly ReturnBestQuarterWorstQuarterPast performance is not a guarantee of future results. Indices are not available for direct investment. Index performance does not reflect the expenses associated with the management of an actual portfolio.Market segment (index representation) as follows: US Stock Market (Russell 3000 Index), International Developed Stocks (MSCI World ex USA Index [net div.]), Emerging Markets (MSCI Emerging Markets Index [net div.]),Global Real Estate (S&P Global REIT Index [net div.]), US Bond Market (Bloomberg Barclays US Aggregate Bond Index), and Global Bond Market ex US (Bloomberg Barclays Global Aggregate ex-USD Bond Index [hedged toUSD]). S&P data 2021 S&P Dow Jones Indices LLC, a division of S&P Global. All rights reserved. Frank Russell Company is the source and owner of the trademarks, service marks, and copyrights related to the RussellIndexes. MSCI data MSCI 2021, all rights reserved. Bloomberg Barclays data provided by Bloomberg.3
Long-Term Market SummaryIndex Returns as of June 30, 2021US StockMarketInternationalDevelopedStocks1 YearEmergingMarketsStocksGlobalRealEstateUS BondMarketSTOCKSGlobalBondMarketex %4.12%5 Years10 YearsPast performance is not a guarantee of future results. Indices are not available for direct investment. Index performance does not reflect the expenses associated with the management of an actual portfolio.Market segment (index representation) as follows: US Stock Market (Russell 3000 Index), International Developed Stocks (MSCI World ex USA Index [net div.]), Emerging Markets (MSCI Emerging Markets Index [net div.]),Global Real Estate (S&P Global REIT Index [net div.]), US Bond Market (Bloomberg Barclays US Aggregate Bond Index), and Global Bond Market ex US (Bloomberg Barclays Global Aggregate ex-USD Bond Index [hedged toUSD]). S&P data 2021 S&P Dow Jones Indices LLC, a division of S&P Global. All rights reserved. Frank Russell Company is the source and owner of the trademarks, service marks, and copyrights related to the RussellIndexes. MSCI data MSCI 2021, all rights reserved. Bloomberg Barclays data provided by Bloomberg.4
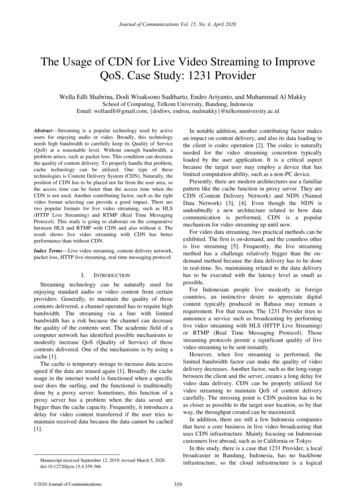
World Stock Market PerformanceMSCI All Country World Index with selected headlines from Q2 2021400350300250200Mar 31Apr 30“Oil Price HitsTwo-Year Highas OPEC SeesMore Demand”“US Pipeline CyberattackForces Closure”“China Creates its OwnDigital Currency, a Firstfor Major Economy”“US Added 916,000Jobs in March asHiring Accelerated”May 31“US Puts Fresh Sanctionson Russia Over Hacking,Election Interference”“Nasdaq CompositeSets First RecordSince February”“Corporate Bond GaugeSignals DwindlingEconomic Risk”Jun 30“US Inflation IsHighest in 13Years as PricesSurge 5%”“Bitcoin Falls as Much as30% as Investors Souron Cryptocurrencies”“CDC: Fully Vaccinated People CanStop Wearing Face Masks, EndPhysical Distancing in Most Settings”“US Existing-HomePrices Hit RecordHigh in May”“Supreme CourtLeaves AffordableCare Act Intact”“Japan’s EconomyShrank an Annualized3.9% in 1st Quarter”“G-7 Nations Agree onNew Rules for TaxingGlobal Companies”“Fed Pencils InEarlier InterestRate Increase”“Stock MarketsCruise toRecords inFirst Half”These headlines are not offered to explain market returns. Instead, they serve as a reminder that investors should view daily events from a long-term perspective and avoid makinginvestment decisions based solely on the news.Graph Source: MSCI ACWI Index [net div.]. MSCI data MSCI 2021, all rights reserved.It is not possible to invest directly in an index. Performance does not reflect the expenses associated with management of an actual portfolio. Past performance is not a guarantee of future results.5
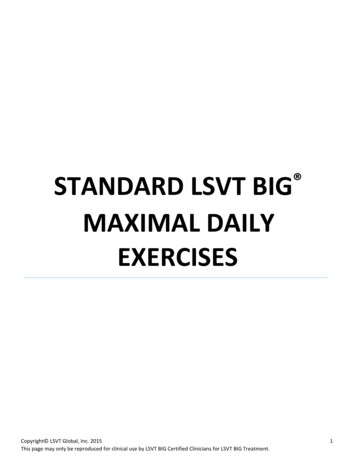
World Stock Market PerformanceMSCI All Country World Index with selected headlines from past 12 monthsLONG TERM (2000–Q2 2021)400300SHORT TERM (Q2 2020–Q2 2021)200Last 12months100400020002005201020152020350300250200Jun 30Sep 30“ConsumerSpendingRose 5.6%in June”“US Debt HitsPostwar Record”“Fed Eases InflationTarget in LandmarkDecision”“UK GDP, Down 4-6% Year on Year,Biggest Fall in Advanced Economies”Dec 31“Dow Eclipses30000 forFirst Time”“Biden Takes Officeas 46th President”“US Added916,000 Jobs inMarch as HiringAccelerated”“Small Stocks WidenTheir Lead; Russell2000 Up 15% This Year”“G-7 NationsAgree on NewRules forTaxing GlobalCompanies”Jun 30“StockMarketsCruise toRecordsin FirstHalf”“US Inflation IsHighest in 13Years as PricesSurge 5%”“Bitcoin Trades Above 50,000 for First Time”“US Existing“CDC: Fully Vaccinated People CanHome PricesStop Wearing Face Masks, End“Yield on 30-year Treasury Hits 2%Hit RecordPhysicalDistancinginMostSettings”for First Time Since Pandemic”High in May”“US Stocks NotchRecords in FinalTrading Day of 2020”“Joe Biden’s VictoryAffirmed by ElectoralCollege”Mar 31“Dow ClosesAbove 33000for First Time”These headlines are not offered to explain market returns. Instead, they serve as a reminder that investors should view daily events from a long-term perspective and avoid makinginvestment decisions based solely on the news.Graph Source: MSCI ACWI Index [net div.]. MSCI data MSCI 2021, all rights reserved.It is not possible to invest directly in an index. Performance does not reflect the expenses associated with management of an actual portfolio. Past performance is not a guarantee of future results.6
World Asset ClassesSecond Quarter 2021 Index Returns (%)Equity markets around the globe posted positive returns in the second quarter. Looking at broad market indices, US and non-US developed marketsoutperformed emerging markets for the quarter.Value performance was mixed in the US, with small value outperforming small growth but large value underperforming large growth. Value underperformedgrowth in non-US developed markets and outperformed in emerging markets.Small caps underperformed large caps in the US and non-US developed markets but outperformed in emerging markets.REIT indices outperformed equity market indices in the US and non-US developed markets.Dow Jones US Select REIT Index11.76MSCI Emerging Markets Small Cap Index (net div.)11.25S&P 500 Index8.55Russell 1000 Index8.54Russell 3000 Index8.24S&P Global ex US REIT Index (net div.)7.29MSCI Emerging Markets Value Index (net div.)5.67MSCI World ex USA Index (net div.)5.65MSCI All Country World ex USA Index (net div.)5.48Russell 1000 Value Index5.21MSCI Emerging Markets Index (net div.)5.05MSCI World ex USA Small Cap Index (net div.)4.81Russell 2000 Value Index4.56Russell 2000 Index4.29MSCI World ex USA Value Index (net div.)3.71Bloomberg Barclays US Aggregate Bond IndexOne-Month US Treasury Bills1.830.00Past performance is not a guarantee of future results. Indices are not available for direct investment. Index performance does not reflect the expenses associated with the management of an actual portfolio. TheS&P data is provided by Standard & Poor's Index Services Group. Frank Russell Company is the source and owner of the trademarks, service marks, and copyrights related to the Russell Indexes. MSCI data MSCI 2021, allrights reserved. Dow Jones data 2021 S&P Dow Jones Indices LLC, a division of S&P Global. All rights reserved. S&P data 2021 S&P Dow Jones Indices LLC, a division of S&P Global. All rights reserved. BloombergBarclays data provided by Bloomberg. Treasury bills Stocks, Bonds, Bills, and Inflation Yearbook , Ibbotson Associates, Chicago (annually updated work by Roger G. Ibbotson and Rex A. Sinquefield).7
US StocksSecond Quarter 2021 Index ReturnsThe US equity market posted positive returns for the quarterand outperformed non-US developed markets and emergingmarkets.Value underperformed growth in large cap stocks butoutperformed growth in small cap stocks.Small caps underperformed large caps.REIT indices outperformed equity market indices.Ranked Returns (%)Large Growth11.93Large Cap8.54Marketwide8.24Large Value5.21Small Value4.56Small Cap4.29Small GrowthWorld Market Capitalization—USPeriod Returns (%)Asset Class58%US Market 44.2 trillion3.92* AnnualizedYTD1 Year3 Years**5 Years** 10 Years**Large Growth12.9942.5025.1423.6617.87Large .7317.8914.70Large Value17.0543.6812.4211.8711.61Small Value26.6973.2810.2713.6210.85Small 52Small GrowthPast performance is not a guarantee of future results. Indices are not available for direct investment. Index performance does not reflect the expenses associated with the management of an actual portfolio.Market segment (index representation) as follows: Marketwide (Russell 3000 Index), Large Cap (Russell 1000 Index), Large Cap Value (Russell 1000 Value Index), Large Cap Growth (Russell 1000 Growth Index), Small Cap(Russell 2000 Index), Small Cap Value (Russell 2000 Value Index), and Small Cap Growth (Russell 2000 Growth Index). World Market Cap represented by Russell 3000 Index, MSCI World ex USA IMI Index, and MSCIEmerging Markets IMI Index. Russell 3000 Index is used as the proxy for the US market. Dow Jones US Select REIT Index used as proxy for the US REIT market. Frank Russell Company is the source and owner of thetrademarks, service marks, and copyrights related to the Russell Indexes. MSCI data MSCI 2021, all rights reserved.8
International Developed StocksSecond Quarter 2021 Index ReturnsDeveloped markets outside the US posted positive returns forthe quarter, underperforming US equities but outperformingemerging markets.Value underperformed growth.Small caps underperformed large caps.Ranked Returns (%)Local currency7.07Growth7.655.15Large Cap5.654.41Small Cap4.813.29ValueWorld Market Capitalization—International Developed29%InternationalDeveloped Market 22.3 trillion3.71Period Returns (%)Asset ClassUS currency* AnnualizedYTD1 Year3 Years*5 Years*12.3535.854.228.073.87Large Cap9.9233.608.5710.365.70Small 7.35Value10 Years*Past performance is not a guarantee of future results. Indices are not available for direct investment. Index performance does not reflect the expenses associated with the management of an actual portfolio.Market segment (index representation) as follows: Large Cap (MSCI World ex USA Index), Small Cap (MSCI World ex USA Small Cap Index), Value (MSCI World ex USA Value Index), and Growth (MSCI World ex USAGrowth Index). All index returns are net of withholding tax on dividends. World Market Cap represented by Russell 3000 Index, MSCI World ex USA IMI Index, and MSCI Emerging Markets IMI Index. MSCI World ex USA IMIIndex is used as the proxy for the International Developed market. MSCI data MSCI 2021, all rights reserved. Frank Russell Company is the source and owner of the trademarks, service marks, and copyrights related to theRussell Indexes.9
Emerging Markets StocksSecond Quarter 2021 Index ReturnsEmerging markets posted positive returns for the quarter,underperforming the US and non-US developed equitymarkets.Value outperformed growth.Small caps outperformed large caps.Ranked Returns (%)Local currency9.91Small Cap11.254.35Value5.673.83Large Cap5.053.30GrowthWorld Market Capitalization—Emerging Markets13%EmergingMarkets 9.8 trillion4.42Period Returns (%)Asset ClassUS currency* AnnualizedYTD1 Year3 Years*5 Years*10 Years*Small 1.80Large 46.63Past performance is not a guarantee of future results. Indices are not available for direct investment. Index performance does not reflect the expenses associated with the management of an actual portfolio.Market segment (index representation) as follows: Large Cap (MSCI Emerging Markets Index), Small Cap (MSCI Emerging Markets Small Cap Index), Value (MSCI Emerging Markets Value Index), and Growth (MSCIEmerging Markets Growth Index). All index returns are net of withholding tax on dividends. World Market Cap represented by Russell 3000 Index, MSCI World ex USA IMI Index, and MSCI Emerging Markets IMI Index. MSCIEmerging Markets IMI Index used as the proxy for the emerging market portion of the market. MSCI data MSCI 2021, all rights reserved. Frank Russell Company is the source and owner of the trademarks, service marks,and copyrights related to the Russell Indexes.10
Select Market PerformanceSecond Quarter 2021 Index ReturnsIn US dollar terms, Denmark and Switzerland recorded the highest country performance in developed markets, while New Zealand and Japan posted thelowest returns for the quarter. In emerging markets, Brazil and Poland recorded the highest country performance, while Chile and Peru posted the lowestperformance.Ranked Developed Markets Returns GermanyNorwayIrelandHong KongPortugalSingaporeJapanNew 7-1.49Ranked Emerging Markets Returns (%)BrazilPolandHungaryCzech RepublicRussiaSaudi esKoreaGreeceQatarChinaSouth 06Chile 567.296.175.612.412.350.0623.6019.53Past performance is not a guarantee of future results. Indices are not available for direct investment. Index performance does not reflect the expenses associated with the management of an actual portfolio.MSCI Index returns are in USD net of dividend withholding taxes. Country returns are the country component indices of the MSCI All Country World ex USA IMI for all countries except the United States, where the Russell 3000index is used instead. Frank Russell Company is the source and owner of the trademarks, service marks and copyrights related to the Russell Indexes. MSCI data MSCI 2021, all rights reserved. Indices are not available fordirect investment. Their performance does not reflect the expenses associated with the management of an actual portfolio. Past performance is not a guarantee of future results.11
Select Currency Performance vs. US DollarSecond Quarter 2021In developed markets, several currencies appreciated vs. the US dollar, but some, notably the Australian dollar, depreciated. In emerging markets, mostcurrencies appreciated vs. the US dollar, but some, notably the Turkish lira, depreciated.Ranked Developed Markets (%)Ranked Emerging Markets (%)Israeli New shekel (ILS)2.34Swedish krona (SEK)1.92Swiss franc (CHF)1.82Canadian dollar (CAD)1.50Danish krone (DKK)0.92Euro (EUR)0.90British pound (GBP)0.13Hong Kong dollar (HKD)0.11Singapore dollar (SGD)-0.04New Zealand dollar (NZD)Japanese yen (JPY)Norwegian krone (NOK)Australian dollar (AUD) -1.43-0.23-0.44-0.80Brazilian real (BRL)Hungarian forint (HUF)Polish zloty (PLN)South African rand (ZAR)Russian ruble (RUB)Czech koruna (CZK)Mexican peso (MXN)New Taiwan dollar (TWD)Chinese renminbi (CNY)Korean won (KRW)Kuwaiti dinar (KWD)Indonesian rupiah (IDR)Egyptian pound (EGP)Saudi Arabian riyal (SAR)Malaysian ringgit (MYR)-0.12Philippine peso (PHP)-0.57Chilean peso (CLP)-1.33Colombian peso (COP)-1.58Indian rupee (INR)-1.64Peruvian sol (PEN)-1.84Thai baht (THB)-2.50Pakistani rupee (PKR)-3.11Argentinian peso (ARS)-3.91Turkish lira (TRY) 0.170.140.00Past performance is not a guarantee of future results. Indices are not available for direct investment. Index performance does not reflect the expenses associated with the management of an actual portfolio.MSCI data MSCI 2021, all rights reserved.12
Real Estate Investment Trusts (REITs)Second Quarter 2021 Index ReturnsUS real estate investment trusts outperformed non-US REITsduring the quarter.Ranked Returns (%)US REITS11.76Global ex US REITSTotal Value of REIT StocksPeriod Returns (%)Asset Class37%World ex US 560 billion278 REITs(25 othercountries)7.2963%US REITSGlobal ex US REITS* AnnualizedYTD1 Year3 Years**5 Years** 10 US 950 billion115 REITsPast performance is not a guarantee of future results. Indices are not available for direct investment. Index performance does not reflect the expenses associated with the management of an actual portfolio.Number of REIT stocks and total value based on the two indices. All index returns are net of withholding tax on dividends. Total value of REIT stocks represented by Dow Jones US Select REIT Index and the S&P Global ex USREIT Index. Dow Jones US Select REIT Index used as proxy for the US market, and S&P Global ex US REIT Index used as proxy for the World ex US market. Dow Jones and S&P data 2021 S&P Dow Jones Indices LLC, adivision of S&P Global. All rights reserved.13
CommoditiesSecond Quarter 2021 Index ReturnsThe Bloomberg Commodity Index Total Return returned 13.3%for the second quarter of 2021.Ranked Returns (%)Soybean OilSoybean Oil and Natural Gas were the best performers,returning 31.82% and 30.29%, respectively.31.82Natural Gas30.29Coffee25.79WTI Crude OilSoybean Meal and Live Cattle were the worst performers,declining 12.66% and 2.77%, respectively.24.36Brent Crude Oil20.74Sugar20.57Heating Oil19.73Corn18.79Low Sulphur Gas Oil16.77Unleaded Gas14.86Aluminum13.54Nickel13.15Kansas Wheat* AnnualizedPeriod Returns (%)Asset ClassQTRYTDCommodities 13.30 21.151 Year 3 Years** 5 Years** 10 ilver6.51Zinc4.95Soybean4.58Gold3.15Cotton2.29Lean HogsLive Cattle0.23-2.77Soybean Meal -12.66Past performance is not a guarantee of future results. Index is not available for direct investment. Index performance does not reflect the expenses associated with the management of an actual portfolio.Commodities returns represent the return of the Bloomberg Commodity Total Return Index. Individual commodities are sub-index values of the Bloomberg Commodity Total Return Index. Data provided by Bloomberg.14
Fixed IncomeSecond Quarter 2021 Index ReturnsChanges in interest rates in the USTreasury fixed income market weregenerally mixed during the second quarterof 2021. The yield on the 5-Year Treasurynote decreased 7 basis points (bps) to0.88%. The yield on the 10-Year T-notedecreased 28 bps to 1.46%. The 30-YearTreasury bond yield declined 35 bps to2.04%.On the short end of the yield curve, the 1Month US Treasury bill yield remainedunchanged at 0.05%, and the 1-Year T-billyield increased 2 basis point to 0.10%. The2-Year Treasury note increased 10 bps to0.25%.In terms of total returns, short-termcorporate bonds gained 0.70%.Intermediate-term corporate bondsreturned 1.70%.The total return for short-term municipalbonds was 0.30%, while intermediate-termmunis returned 0.80%. Revenue bondsoutperformed general obligation bonds.US Treasury Yield Curve (%)Bond Yield across Issuers /30/20201.000.001Yr5Yr10Yr30Yr10-Year USTreasuryState eriod Returns (%)*Annualized3 Years** 5 Years** 10 Years**Asset ClassQTRYTD1 YearBloomberg Barclays US Government Bond Index Long6.43-7.82-10.427.973.186.62Bloomberg Barclays US TIPS Index3.251.736.516.534.173.40Bloomberg Barclays US High Yield Corporate Bond Index2.743.6215.377.457.486.66Bloomberg Barclays US Aggregate Bond Index1.83-1.60-0.335.343.033.39Bloomberg Barclays Municipal Bond Index1.421.064.175.103.254.28FTSE World Government Bond Index 1-5 Years0.31-2.082.082.311.27-0.13FTSE World Government Bond Index 1-5 Years (hedged to USD)0.07-0.300.112.821.921.88ICE BofA 1-Year US Treasury Note Index0.020.090.222.011.470.90ICE BofA US 3-Month Treasury Bill Index0.000.020.091.341.170.63One basis point (bps) equals 0.01%. Past performance is not a guarantee of future results. Indices are not available for direct investment. Index performance does not reflect the expenses associated with themanagement of an actual portfolio. Yield curve data from Federal Reserve. State and local bonds are from the S&P National AMT-Free Municipal Bond Index. AAA-AA Corporates represent the Bank of America Merrill LynchUS Corporates, AA-AAA rated. A-BBB Corporates represent the ICE BofA Corporates, BBB-A rated. Bloomberg Barclays data provided by Bloomberg. US long-term bonds, bills, inflation, and fixed income factor data Stocks,Bonds, Bills, and Inflation (SBBI) Yearbook , Ibbotson Associates, Chicago (annually updated work by Roger G. Ibbotson and Rex A. Sinquefield). FTSE fixed income indices 2021 FTSE Fixed Income LLC, all rightsreserved. ICE BofA index data 2021 ICE Data Indices, LLC. S&P data 2021 S&P Dow Jones Indices LLC, a division of S&P Global. All rights reserved.15
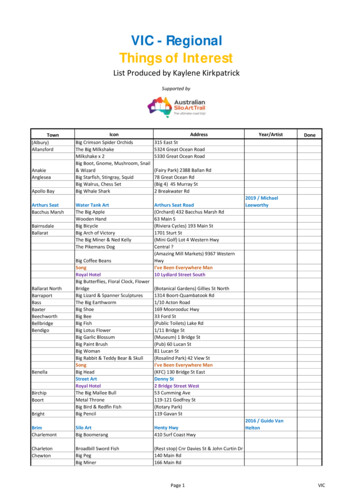
Global Fixed IncomeSecond Quarter 2021 Yield CurvesUSChanges in government bond yieldsin the global developed markets weremixed for the quarter.UK4.04.0Term premiums were mixed indeveloped markets.2.01.00.0-1.0Short- and intermediate-term nominalinterest rates were negative in Japanand Germany.3/31/20216/30/20211Y5Y10Y20Y3.0Yield (%)Yield (%)3.02.00.0-1.030Y3/31/20216/30/20211.01Y5YYears to 0YYield (%)Yield (%)4.01.00.0-1.030Y6/30/20213/31/20211Y5YYears to 0212.01.00.01Y20Y30YAustralia4.0-1.010YYears to Maturity5Y10Y20YYears to MaturityOne basis point (bps) equals 0.01%. Source: ICE BofA government yield. ICE BofA index data 2021 ICE Data Indices, LLC.30YYield 1.1-11.0Yield (%)Changes in Yields (bps) since 3/31/202130YJapan4.01Y20YYears to 1.01Y5Y10Y20Y30YYears to Maturity16
Impact of DiversificationSecond Quarter 2021Ranked Returns (%)These portfolios illustrate the performance of different globalstock/bond mixes and highlight the benefits of diversification.Mixes with larger allocations to stocks are considered riskierbut have higher expected returns over time.100% Stocks7.5375/255.6250/503.7325/75100% Treasury Bills1.850.00Growth of Wealth: The Relationship between Risk and ReturnStock/Bond Mix 160,000100%Stocks 140,000Period Returns (%)Asset Class100% Stocks* Annualized 120,00010-YearYTD 1 Year 3 Years** 5 Years** 10 Years** STDEV¹ 100,00075/25 11.8411.738.1210.52 60,00050/506.1518.718.408.205.677.00 40,00025/753.059.084.854.643.143.49100% Treasury yBills 20,000 1. STDEV (standard deviation) is a measure of the variation or dispersion of a set of data points. Standard deviations are often used to quantify the historical return volatility of a security or portfolio.Diversification does not eliminate the risk of market loss. Past performance is not a guarantee of future results. Indices are not available for direct investment. Index performance does not reflect expenses associatedwith the management of an actual portfolio. Asset allocations and the hypothetical index portfolio returns are for illustrative purposes only and do not represent actual performance. Global Stocks represented by MSCI AllCountry World Index (gross div.) and Treasury Bills represented by US One-Month Treasury Bills. Globally diversified allocations rebalanced monthly, no withdrawals. Data MSCI 2021, all rights reserved. Treasury bills Stocks, Bonds, Bills, and Inflation Yearbook , Ibbotson Associates, Chicago (annually updated work by Roger G. Ibbotson and Rex A. Sinquefield).17
Inflation: An Exchange BetweenEugene Fama and David BoothSecond Quarter 2021David Booth, Executive Chairman and FounderEugene Fama, PhD, Nobel laureate, Director, and ConsultantWith the economy starting to recover from the COVID-19 pandemic andinvestor concerns turning increasingly toward inflation, Dimensional FounderDavid Booth talked with Nobel laureate Eugene Fama about inflation and howinvestors should think about it in their portfolios. Excerpts from theirconversation have been edited for clarity.ON HOW INVESTORS SHOULD THINK ABOUT INFLATION AND THEIRFINANCIAL GOALSON PREDICTING INFLATIONFama: I don’t think anybody predicts the market very well. Market timing isrisky in the sense that you’ve always emphasized: You may be out of the stockmarket at precisely the time when it generates its biggest returns. The natureof the stock market is you get a lot of the return in very short periods of time.So, you basically don’t want to be out for short periods of time, where you mayactually be missing a good part of the return.David Booth: Gene, you are a founding Director of Dimensional and havebeen involved in our research and corporate governance for more than 40years. People may not know that you’ve also done a lot of research on inflationand interest rates.We always tell people, “We don’t try to forecast. We try to be prepared forvarious outcomes.” Inflation is one of those things you want to be prepared for.There’s a pickup in inflation risk that wasn’t there, say, 10 years ago. Does thatcause you to worry?Eugene Fama: Historically what’s happened is, when there’s a spike, thespike persists for a long time. Inflation tends to be highly persistent once youget it. Once it goes down, it tends to be highly persistent on the downside.You’ve got to be prepared for that. Predicting next month’s inflation may not bevery hard because this month’s inflation can be a pretty good predictor of nextmonth’s inflation, or next quarter’s inflation, or even the next six months’inflation. Persistence is a characteristic of inflation.We haven’t been in a period of high inflation, or even moderate inflation, for atleast 10 years, so I’m not particularly concerned that inflation will be high soon.Booth: Conditions change, so is there anything about the current environmentand the risk of inflation heating up that would cause you to change yourportfolio?I think you take a long-term perspective. You decide how much risk you’rewilling to take, and then you choose a mix of bonds, stocks, Treasury InflationProtected Securities, and whatever else satisfies your long-term goals. Andyou forget about the short term. Maybe you rebalance occasionally becausethe weights can get out of whack, but you don’t try to time the market in anyway, shape, or form. It’s a losing proposition.Booth: As you get to the point in life where you actually need to use yourportfolio, does that change the kinds of allocations you’d want?Fama: The classic answer to that was, yes, you’d shift more toward short-termhedges, short-term bonds. Once you had enough accumulated wealth that youthought you could make it through retirement, you’d want to hedge away anyuncertainty that might disturb that. That’s a matter of taste and your willingnessto take risk and your plans for the people you will leave behind, like your18
Inflation: An Exchange BetweenEugene Fama and David Booth(continued from page 18)charities or your kids. All of that will influence how you make that decision. Butthe typical person who thinks they’ll spend all their money before they dieprobably wants to move into less risky stuff as they approach retirement.Booth: The notion of risk is pretty fuzzy. For example, if I decide that I want tohold Treasury bills or CDs when I retire, and you did that 40 years ago, whenwe started the firm, and you’ve got that 15% coupon, that’s pretty exciting.With 1 million at 15%, you’re getting 150,000 a year. Today you might getless than 1%.Fama: Right, but I remember when inflation was running at about 15%, so notmuch better off!Fama: When you approach retirement, you’re basically concerned about whatyour real wealth will look like over the period of your retirement, and you havesome incentives to hedge against that. You face the possibility, for example, thatif you invest in stocks, you have a higher expected return, but you may lose30% in a year and that might be devastating for your long-term consumption.Booth: I think part of planning is not only your investment portfolio, but what todo if you experience unexpected events of any kind. We’re kind of back towhere we start our usual conversation: “Control what you can control.” Youcan’t control markets. What you can do is prepare yourself for what you’ll do incase bad events happen. Inflation is just one of many risk factors long-terminvestors need to be prepared for.Booth: Those are different kinds of risks.Eugene Fama is a member of the Board of Directors of the general partner of, and provides consulting services to, Dimensional Fund Advisors LP.Th
World Mar ket Cap represented by Russell 3000 Index, MSCI World ex USA IMI Index, and MSCI Emerging Markets IMI Index. Russell 3000 Index is used as the proxy for the US market. Dow Jones US Select REIT Index used as proxy for the US REIT market. Frank Russell Company is the source and owner of the