Transcription
See discussions, stats, and author profiles for this publication at: Business Intelligence and Analytics A Comprehensive OverviewPresentation · April 2020CITATIONREADS121,9251 author:Jack G ZhengKennesaw State University42 PUBLICATIONS 450 CITATIONSSEE PROFILESome of the authors of this publication are also working on these related projects:IT Education and Curriculum Development View projectIT Lecture Notes View projectAll content following this page was uploaded by Jack G Zheng on 30 May 2021.The user has requested enhancement of the downloaded file.
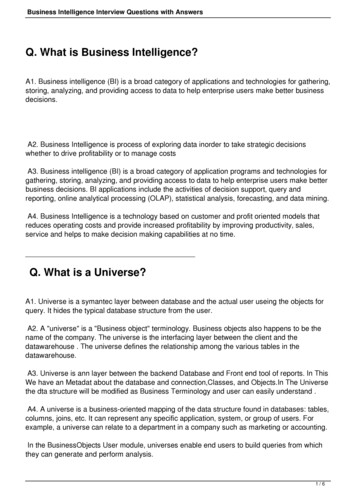
Business IntelligenceandAnalyticsA Comprehensive OverviewIT 4713/6713 BIJack G. ZhengSpring 2020 (since V1 docr.com/v/r4dg6mjr/
OverviewThis lecture notes provides a high level overview of businessintelligence and analytics. This overview is comprehensive and coversas many aspects as possible, but it keeps them at a high level. Moredetails are provided in more learning modules. What is business intelligence (BI) and analytics?– BI/Analytics as an information and decision process– BI/Analytics as an computing and information system General BI/Analytics process BI/Analytics systems and tools– Values, capabilities, and components– Technologies, architectures, platforms– Products, industries, and markets BI evolution and trend: traditional BI and modern BI BI/Analytics learning and career2
Types of Information ProcessingNotice the difference between theseterms as general concepts vs. asparticular technologies/systems.Transactional Processing Focus on data item processing(insertion, modification,deletion), transmission, andeven some non-analyticalqueryAnalytical Processing Focus on queries, calculation,reporting, analysis, anddecision support Change product price. Increase customer credit limit. Import data from another source What are the top 10 mostprofitable products? Is there a significant increase ofoperational cost?For a more detailed comparison of OLTP and n-oltp-and-olap.html3
DIKW The DIKW hierarchy depicts relationships between data, information,knowledge (and wisdom).– Data: raw value elements or facts– Information: the result of collecting and organizing data that provides context and meaning– Knowledge: the concept of understanding information that provides insight to information,thus useful and actionable The model can be loosely relate to the levels of transactional processing(OLTP) and analytical processing For more extensive reading: http://en.wikipedia.org/wiki/DIKW PyramidDifferent opinion: -not
Examples of Analysis Non-analytical query (search results based on certain conditions)– Get a list of students enrolled in in the IT 6713 class. Descriptive analysis (summarizing)– How many students are enrolled in online IT graduate courses for the past year? What if analysis– If inventory levels are reduced by 10%, what is the new cost of inventory storage? Reasoning (why) and correlation– What is the reason for a decrease of total sales this year?– How do advertising activities affect sales of different products bought by different type ofcustomers, in different regions? (synthesizing) Forecast and prediction– How many students are likely to change degree next year? Fuzzy decision– What new advertising strategies need to be undertaken to reach our customers who canafford a high priced product?– Should we invest more on our e-business?5
What is Business Intelligence?Business Intelligence is a set of methods,processes, architectures, applications, andtechnologies that gather and transform rawdata into meaningful and useful informationused to enable more effective strategic,tactical, and operational insights anddecision-making.Adapted from Forrester Report“Topic Overview: Business Intelligence”, 2008https://www.forrester.com/report/Topic Overview Business Intelligence/-/E-RES39218More BI from igence6
Data Different types of data–––––– Numeric vs. textualStructured vs. unstructuredStandard format vs. proprietary formatInternal vs. external data, system stored vs. file based dataRaw fact data vs. simulated/forecast/estimated dataSimple fact data vs. calculated metrics dataCommon data problems–Structured, unstructured, semi-structured –Information overloading –We may have that data but we cannot access it (or difficult to get it), because of technical issues or administrativeissues.Lack of data 7Data in separate systems and different sources; internal and externalProblem of spreadmart http://en.wikipedia.org/wiki/SpreadmartOver 43 percent of organizations have more than six content stores. (Forrester Research).Difficulty of access –Variety, Velocity, Volume, Veracity big-dataData everywhere –too much data and information with varied formats and structuredifficulty of data organization for effective access and retrievaldifficult to find useful information (knowledge) from themMultiple copies of data exists sometimes with conflictsBig data –Information and knowledge management is the management of both structured data (15% of information) andunstructured data (85% of information), according to the Butler Group.80 percent of business is conducted on unstructured information (Gartner Group).The data is simply not available.The collection of data may need additional process and is costly.
Decision Making Decisions can be made based on–––– Facts, or dataSimulation (models)Intuition, perception, senseGroup negotiationTraditionally BI has been also understood as Decision Support System (DSS) –known as data driven DSS (data directly contributes to decision withoutintensive and advanced analytical techniques).Extended reading: a brief history of DSS http://dssresources.com/history/dsshistory.html Problems in decision making–––– A gap between data and knowledge (useful information leading to a decision).Management/operation by intuitionLack of effective feedback and alignment systems, no improvement cyclesNeed good analytical processing and modelsEvolving analytical needs in decision support– Real-time, most recent data– Business user driven, agile, instant– Exploratory and interactive8
Additional Notes about BI BI is the an umbrella term for a set of methods, processes, applications, andtechnologies used to– gather, provide access to, analyze, and report data and information– support understanding and decision making– A common goal in BI is to drive performance The evolution of BI resides both in “business” and “intelligence”– The term “business” is more general and represents the application domain; not justrelated to profit driven businesses.– Traditionally BI is related to business or corporate operations, but can also extend to othertypes of organizational contexts, like non-profits, governments, institutions, etc.– Intelligence represents the resource and the techniques or methods Narrowly speaking, intelligence comes from data (facts). Traditional BI normallydoes not directly address other content types and formats (which usually fallsunder artificial intelligence).– In this sense, BI focuses on analytical data processing. Broadly speaking, intelligence, or knowledge, comes from human experienceand tacit knowledge, in various format like text, image, video, etc.– In this sense, BI is also related to knowledge management (either BI under KM or ort/19/trunk/proposal/research/Knowledge management.pdf9
Evolution of BI1980sExecutive information systems (EIS), decision support systems (DSS)1990sData warehousing (DW), business intelligence (BI)2000sDashboards and scorecards, performance management2010 ?Analytics, big data, data science, augmented BI, The search for the perfect “business insight system”, from Performance Dashboard, by WayneEckerson ncedashboards.pdf“With each new iteration, capabilities increased asenterprises grew ever-more sophisticated in theircomputational and analytical needs and as computerhardware and software matured.”Solomon Negash (2004), Business Intelligence, CAIS 5967 Business intelligence10
Analytics Analytics has emerged as a catch-all term for avariety of different business intelligence (BI) andapplication-related initiatives. Whatever the usecases, “analytics” has moved deeper into thebusiness vernacular.– Analytics can beviewed as theevolved, expanded,or improved BIThe Evolution of BI Semantics s/2011/02/whatsin a word.phpAnalytics is geared more toward future predictionsand trends, while BI helps people make decisionsbased on past ytics initially referred to advanced statisticalmodeling using tools like SAS and SPSS. Now,analytics refers to the entire domain of leveraginginformation to make smarter decisions. In otherwords, reporting and analysis.– ytics refers to a more systematical,automated, and flexible process of data analysisfor revealing insights and decision support in moreextensive application areas (beyond organizationalcontexts), e.g. sports, disease, network traffic, etc.– Depending on perspectives, Analytics is part of BI includes BI goes beyond (the traditional) BI (the new) BIChristian ing-withsoftware/The Evolution of BI n/archives/2011/02/whats in a word.php
Analytics or BI We tend to call analytics rather than BI in thefollowing scenarios. But their processes andtechnologies are very similar. Non-business activities such as––––Learning analyticsTalent analyticsWeb analyticsSports analytics Non-organizational contexts; mainly used byindividuals or groups for public communication.12
BI and Other Related Terms Big data–– Data science––––– “In its more comprehensive usage, BI is all of the systems, platforms, software, technology, and techniques that areessential for the collection, storage, retrieval, and analysis of data assets within a given organization.” – Dataversity 2015Report on BI vs Data ScienceMore perspectives from the industry–––13An interdisciplinary field about processes and systems to extract knowledge or insights from data in various formsFocus on advanced analytics and presentation models and methodsUsing autonomous or semi-autonomous techniques and tools, typically beyond traditional BI to discover deeper insights,make predictions, or generate recommendation.A good data scientist data hacker programmer analyst coach story teller artist -desirable-job-in-the-21st-century/)“In some ways, data science is an evolution of BI.” l these new terms try to differentiate them from the (traditional) BI. However, if one considers BI is a dynamicand evolving field, then all these new terms are just extensions/expansions of BI; they all still fall under theumbrella of the general BI.– “Big Data is not a system; it is simply a way to say that you have a lot of data. et-tomas-kratkyBig data covers non-structure and various data formats including text, blob, multimedia, ytics-business-intelligence-data-science/ ss-intelligence-vs-business-analytics/
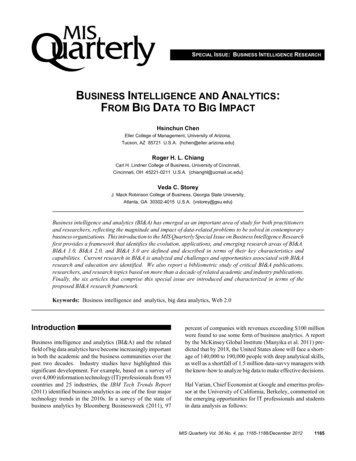
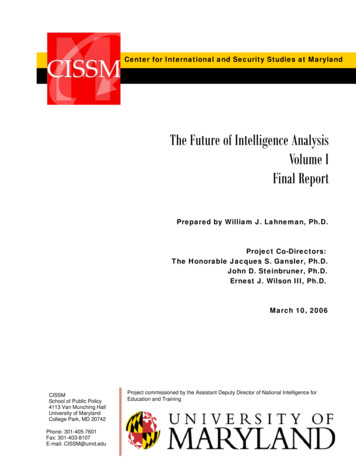
BI/Analytics: A General ProcessThe organization andtransformation of datainto clean and commonmodels and formats.Data can beanalyzedimmediately inmany agileanalytical cases,without a formalmanaged storage.DataCleanseDataGatheringThe process involves analyticalcomponents, such asdimensional analysis, statisticalanalysis, data mining, and otheradvanced analytics to extractinformation and knowledge.DataStorageDataAnalysisResults are presentedand delivered in differenthuman comprehendibleformats, to supportdecisions. It alsoincludes data explorationand reporting.DataPresentationData PreparationThe collection of rawdata from differentsources by differentmeans, and in differentformats.14The refined data will be modeled(if needed) and stored in aparticular place (e.g., a file or adata management system) andready for analysis.Queries can also directlypresent results to userswithout intensiveanalysis. This is usuallyused for data explorationand descriptive reports.
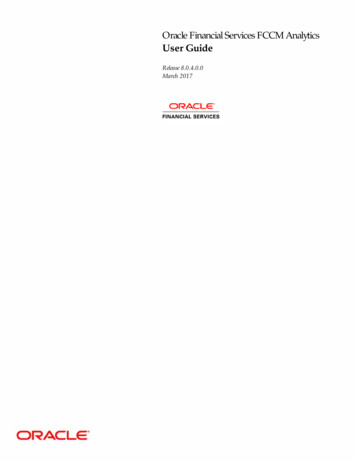
BI in the Decision ProcessAnother view from the corporate decision business-process-based-analytics15
General BI Capabilities ConceptionThis is consistent with thegeneral BI or analyticsprocess but more from aninformation behavior angle.Figure from: Business Intelligence, Rajiv Sabherwal, Irma Becerra-Fernandez, John Wiley & Sons, 2011http://books.google.com/books?id T-JvPdEcm0oC16
BI Systems and Platforms A BI system is a computer information system thatimplements (part or whole) BI capabilities and processes The values of BI Systems– Provide an integrated data (analytical) processing platform– Enable easy and fast access of data and information at alllevels (raw data, analysis results, metrics, etc.)– Streamline a controlled and managed process of data drivendecision making Enterprise level vs. personal level– An enterprise level BI system emphasizes more on controland performance.– While a more user-oriented analytics platform enablesnontechnical users to autonomously execute full-spectrumanalytic workflows from data access and preparation tointeractive analysis and the collaborative sharing of insights.17
BI System Components at a GlanceDataManagement:Gathering andStorage Relational databaseData warehouseData lakeData modelingData governanceData integrationETLData qualityMetadataMaster DataData virtualization18* Data managementusually includes adata sourcing andgatheringcomponent. Thiscomponent may beintegrated with orindependent from adata storage system. QueryOLAPBusiness analyticsStatisticsData miningText miningAdvanced ion ReportsData visualizationDashboardScorecardsStrategy mapVisual analyticsFree form results Local filesWebsiteReporting serverApplication serverBI serverPortalExcel servicesDelivery andSharing Performancemanagement Benchmarking Market research CRM Strategicmanagement Web page visitsUsers with software(browser, desktop app,mobile app, email,etc.) and devices(computer, tablet,phone, print-outs, etc.)
Critical Capabilities of a BI and Analytics PlatformGartner Magic Quadrant Report 2018/2019 Infrastructure––– Data Management–––– –––––19Advanced Analytics. Enables users to easily access advanced analytics capabilities that are self-contained within the platform itself or availablethrough the import and integration of externally developed models.Analytic Dashboards. The ability to create highly interactive dashboards and content, with visual exploration and embedded advanced analytics.Interactive Visual Exploration. Enables the exploration of data via the manipulation of visual properties and visual forms representing aspects of thedataset being analyzed. These tools enable users to analyze the data by interacting directly with a visual representation of it.Augmented Data Discovery: Automatically finds, visualizes and narrates important findings such as correlations, exceptions, clusters, links andpredictions in data that are relevant to users without requiring them to build models or write algorithms.Mobile Exploration and Authoring. Enables organizations to develop and deliver content to mobile devices in a publishing and/or interactive mode,and takes advantage of mobile devices' native capabilities, such as touchscreen, camera, location awareness and natural-language query.Sharing of Findings– Governance and Metadata Management. Tools for enabling users to share the same systems-of-record semantic model and metadata. These shouldprovide a robust and centralized way for administrators to search, capture, store, reuse and publish metadata objects, such as dimensions, hierarchies,measures, performance metrics/key performance indicators (KPIs) and report layout objects, parameters and so on.Self-Contained ETL and Data Storage. Platform capabilities for accessing, integrating, transforming and loading data into a self-contained storagelayer, with the ability to index data and manage data loads and refresh scheduling.Self-Service Data Preparation. The drag-and-drop, user-driven data combination of different sources, and the creation of analytic models such asuser-defined measures, sets, groups and hierarchies.Scalability and Data Model Complexity. The degree to which the in-memory engine or in database architecture handles high volumes of data,complex data models, performance optimization and large user deployments.Analysis and Content Creation– BI Platform Administration. Capabilities that enable scaling the platform, optimizing performance and ensuring high availability and disaster recovery.Cloud BI. Platform-as-a-service and analytic-application-as-a-service capabilities for building, deploying and managing analytics and analyticapplications in the cloud, based on data both in the cloud and on-premises.Data Source Connectivity. Capabilities that allow users to connect to the data contained within various types of storage platforms.Embedding Analytic Content. Capabilities including a software developer's kit with APIs and support for open standards for creating and modifyinganalytic content, visualizations and applications, embedding them into a business process, and/or an application or portal. These capabilities can resideoutside the application (reusing the analytic infrastructure), but must be easily and seamlessly accessible from inside the application without forcingusers to switch between systems.Publish and collaborate Analytic Content. Capabilities that allow users to publish, deploy and operationalize analytic content through various outputtypes and distribution methods, with support for content search, storytelling, scheduling and alerts.Overall: Ease of Use, Visual Appeal and Workflow Integration.
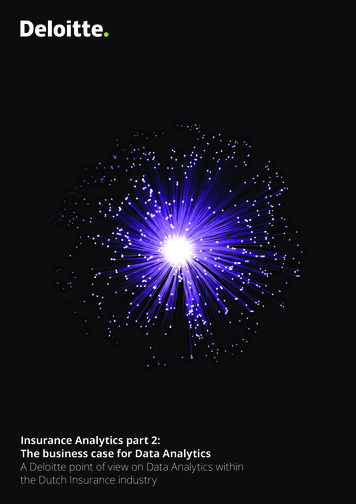
A Practical System Architecture in MSBIImage ackintroduction/20Note: this is only oneexample of a typical andtraditional BI systemarchitecture. We will seesome more self-serviceoriented architecture later.
Data Management/Storage In traditional BI, a special database system called data warehouse ordata mart is often used to store enterprise data– The purpose of a data warehouse is to organize lots of stable data for easeof analysis and retrieval. Traditional (operational) relational databases facilitate datamanagement and transaction processing. They have two limitations fordata analysis and decision support– Performance They are transaction oriented (data insert, update, move, etc.) Not optimized for complex data analysis Usually do not hold historical data– Heterogeneity Individual databases usually manage data in very different ways, even in the sameorganization (not to mention external data sources which may be dramaticallydifferent). The data warehouse approach is a centralized and structured approachfor analytical data management. For more recent personal BI/analytics,data is also kept locally for easy access and manipulation, without muchtechnical support.Data warehouse/mart will becovered in IT 4713 module 4.21
Data Gathering and Integration Enterprise level data are coming from multiple different sources, but need to becombined and associated– Operational databasesData is never clean!– SpreadsheetsYou will spend most of your time– Text, CSVcleaning and preparing data!– PDF, Paper The need to bring together different data/information– Autonomous (may not have the control and management of data)– Distributed (from different systems and places)– Different (in data model, format, or platform) General processing steps - ETL– Extraction: accessing and extracting the data from the source systems, includingdatabase, flat files, spreadsheets, etc.– Transformation: data cleanse, change the extracted data to a format and structure thatconform to the destination data.– Loading: load the data to the destination database, and check for data integrity Traditional BI focuses on upfront separate ETL processes that load the data in acentralized storage. In modern BI and analytics, data cleanse andtransformation may happen just-in-time with analysis.ETL will be covered in IT4713 milestone 2 (module 5 and 6).Self-service data preparation will be covered in IT 6713 module 6 and 7.22
Analysis Techniques/Technologies Descriptive reporting– Structured and fixed format reports– Based on simple and direct queries– Usually involves simple descriptive analysis and transformation of data,such as calculating, sorting, filtering, grouping, and formatting– Ad hoc query and reporting OLAP (Online Analytical Processing)– Focus on descriptive reporting– An optimized multi-dimensional analysis technology Business analytics– Business analytics (BA) is the practice of iterative, methodical exploration ofan organization’s data with emphasis on statistical analysis. Advanced and computation intensive: data mining, deep learning, etc.– Data mining techniques are a blend of statistics and mathematics, andartificial intelligence and machine-learning.23
OLAP OLAP is a function/operation that is optimized to answer queries thatare multi-dimensional– OLAP solutions traditionally heavily rely on backend processing anddedicated IT personnel Multi-dimensional queriesOLAP server will be covered in IT 4713milestone 3 (module 7 and 8).– A dimension is a particular way (or an attribute) of describing andcategorizing data– Such queries are usually arithmetic aggregation operations (sum, average,etc.) on records grouped by multiple dimensions (attributes) at differentaggregation levels.– A pivot table or crosstab is usually used for OLAP result view (aggregateddata)Descriptive and Example analysisoperational report– "What is the total sales amount grouped by product line (dimension 1),location (dimension 2), time (dimension 3) and (other dimensions)?"– "Which segment of business provides the most revenue growth?"More open andexploratory analysis24Dimensional queries and analysis will be covered in IT4713 milestone 4, and in IT 6713 module 8 and 9.
Basic Techniques in Business Analytics Regression– Reasoning, estimating the relationships amongvariables Forecasting– Trend analysis, based on extrapolation of historicaldata Correlation– Relationship discovery between factors (but notcausal relationship) Factor analysis– Determine impacting variables and their variability25
Advanced Analytics Advanced Analytics is the autonomous or semi-autonomousexamination of data or content using sophisticated techniquesand tools, typically beyond those of traditional businessintelligence (BI), to discover deeper insights, make predictions,or generate recommendations.– tics/ Advanced analytic techniques include those such as– Data/text mining: using sophisticated statistical and mathematicaltechniques to find patterns and relationships among data– Predictives– Machine learning– Complex statistical methods– Pattern matching, forecasting, visualization, semantic analysis,sentiment analysis, network and cluster analysis, multivariatestatistics, graph analysis, simulation, complex event processing,genetic algorithm, neural networks26
Levels of Analytical ProcessingAAdvanced Analytics and Business Intelligencehttps://www.youtube.com/watch?v oNNk9-tmsZY27
PresentationPresentation is key – bea master of PowerPoint. The last mile of BI is the presentation of data or analysis tohuman users Data presentation is the method by which people summarize,organize and communicate information using a variety of tools,including tables, diagrams/charts, and other visualizationtechniques Multiple ways to present results–––––Regular/periodical static reportsInteractive and exportable reportsLive and real time dashboardFree form ad hoc analysisEdited PowerPoint Presentation commonly utilizes data visualization techniques toassist interpreting and presenting data in a visual way.Reports and dashboards will be covered in IT 4713 inmillstone 4 (module 9 to 11) and IT 6713 module 10.28
Data Visualization Data visualization is the graphical representation and presentation of data for the purpose ofperception and understanding Visualizing is basically a human physiological and psychological capability, and plays animportant role in human information behavior and decision making––––––– Recall or memorize data more effectivelyEnable fast perception based on instinct (see the figure on the right)Helps data comprehension and enhance problem solving capabilities (cognition)Extract/provoke additional (implicit) perspectives and meaningsEase the cognitive load of information processing and explorationHelp to shape the attention and focusEffective communication (story telling)Data visualization in BI––––Data visualization is an important part of data exploration and decision making. Given the power ofvisualization, it is only natural to apply the rich communication techniques in the field of BI and analytics.As organizations seek to empower non‐technical users to make data‐driven decisions, they mustconsider the powers of data visualization in delivering digestible insights.Visualization tools have become increasingly important to business intelligence, in which people needtechnology support to make sense of and analyze complex data sets and all types of information.Visualization can also be part of the analysis process (visual analytics)Data visualization will be touched briefly in this course. For more coverage, take a look atIT 7113 Data visualization http://zheng.kennesaw.edu/teaching/it7113 and the overview s-Data-Visualization29
Reports Reports–– Traditional reports contain detailed data in a tabular format and typically display numbers and text only.–– It is geared towards people who need data rather than a direct understanding or interpretation of data.Its purpose is mainly for printing (with styling) or exporting (raw data).Modern reports can be interactive and visual but the focus is still on detailed data. Sometimes the distinction isa bit blurred with dashboards in some practical cases.–––30A report is the presentation of detailed data arranged in defined layouts and formatsBased on simple and direct queries: usually involves simple analysis and transformation of data (sorting, calculating,filtering, filtering, grouping, formatting, etc.)A report style “dashboard” (or more like a visual intensive interactive anta/city-overviewMagic Quadrant report vs. egment allDashboard or report? http://www.crazybikes.com/mrc/CRAZYBIKES.R00090s
DashboardA dashboard is a visual-oriented display of the mostimportant data and information needed to achieve definedgoals and objectives; consolidated and arranged on asingle screen so the information can be viewed at a glance.Adapted from: Dashboard Confusion, Stephen board confusion.pdf Elements of a dashboardDashboard data/information visual UI–––Data/information: the most important elementVisual: data visuals (charts, etc.) provide an high level at-a-glance viewUser interface The Values of Dashboard–––Dashboards are a data visualization tool that allow all users to understand the analytics. For nontechnical users, dashboards allow them to participate and understand the analytics process by compilingdata and visualizing trends and occurrences.Provides a one-place presentation of critical informationAllow decision makers to see a variety of data that affects their divisions or departments ––This allows decision makers to focus only on the items over which they have controlThe dashboard is generally customized for each userQuickly understand data and respond quickly at one place 31a clean UI that unifies all elements to work together as a wholesupporting interactions as neededSave time over running multiple reportsMore http://www.bidashboard.org/benefits.htmlFor more details, visit IT 7113 module on /Dashboard
Delivery Medium Delivery is about managing and delivering data andanalysis results to users– Traditional: portal, web app, email, FTP, etc.– Modern channels: social sharing, cloud hosting, etc.Figure from DatabaseProcessing13th Edition, byDavid Kroenke and David Auer32
BI UsersProducersvs.Consumers(at different levels)Technical vs. Business usersFigures originally fromhttp://www.bileader.com/Dashboards.html33
Users Have Different
What is business intelligence (BI) and analytics? – BI/Analytics as an information and decision process – BI/Analytics as an computing and information system General BI/Analytics process BI/Analytics systems and tools – Values, capabilities, and components – Technolo