Transcription
EBOOKModern AnalyticsWith Azure Databricks
Modern Analytics With Azure Databricks2ContentsIntroduction.Example Use Case — Wind Turbine Optimization.The Architecture — Ingest, Store, Prep, Train, Serve, VisualizeThe Deployment0306.08.10Data Ingest: Azure IoT Hub to Data Lake.10Data Storage and Processing: Azure Databricks and Delta Lake. 1 2Machine Learning: Power Output and Remaining Life OptimizationModel Deployment and Hosting.16.25Data Serving: Azure Data Explorer and Azure Synapse Analytics.28Summary . 34What’s Next?.36
Modern Analytics With Azure Databricks3IntroductionOrganizations are turning to cloud platforms like Microsoft Azure to take advantageof scalable services to simplify and accelerate data ingestion, storage, processing,exploration, visualization, machine learning (ML) model preparation, model trainingand model serving. This eBook discusses the end-to-end technology stackand the role Azure Databricks plays in the architecture for performing modernanalytics.The maturity of data analytics has come a long way from descriptive data analysis,where simple relational databases, historical data and spreadsheet expertisedelivered all the insight necessary to a business. These are no longer sufficient todeliver on competitive business opportunities. In order to answer critical businessquestions, a modern approach to data analytics is required. Modern analytics goesbeyond lowering the total cost of storage and compute resources. An even largeropportunity takes the form of innovative and competitive new business growth. Atright are the specific challenges and required capabilities:CHALLENGEREQUIRED CAPABILITYArchitectural complexity causes confusionOrganizations need a single source oftruth for their analytics, BI and ML usecases. Building a solution using numerousoverlapping cloud services can be confusingand complex, even for common use cases.Common architecture for all your dataworkloads, from data to AISlow performance increases total cost ofownership (TCO)Faster performance to lower your overall costA shared data lake, an open storage formatand a single, optimized compute serviceenable a simplified architecture to addressall your data engineering, data science andanalytics workloads.As data volume and velocity dramaticallyincrease, processing performance mustcost-effectively scale to meet businessdemands for fresh and clean data.Processing delays result in tangible andintangible costs related to human capital,missed service level agreements, impaireddecision-making and lost sales.Performance innovations must deliver timelyresults on larger and fresher data sets thananalysts have traditionally been able toaccess. The combination of data warehouseperformance and data lake economicsenables your organization to tap into vastamounts of data in near real time to uncoverpredictive insights, enable faster innovationand boost customer lifetime value.Reduced data team collaboration due tolack of data science and ML integrationsCollaborative environments to boostproductivityUsing separate tools for data engineeringand data science slows communicationand leads to data silos and frictionbetween teams. The end result is reducedproductivity and slower business results.Duplicated work lowers team productivityand increases the risk of errors.Data science and ML tool integrationincrease data team productivity. Personabased experiences improve your data team’scollaborative workflow. A single source oftruth improves communication and ensuresconsistency across your organization.
Modern Analytics With Azure DatabricksModern analytics enables you to unify all your data, analytics and AI workloadsat any scale, and to get insights for all your users through analytics dashboards,operational reports or advanced analytics. Modern analytics with Azure Databricksis simple, open and collaborative, and seamlessly integrated with Azure servicessuch as Azure Data Lake Storage, Azure Data Factory, Azure Synapse Analytics andPower BI.SIMPLESimplify your data architecture by unifying analytics, data science andmachine learning.OPENSupport for open source, open standards and open frameworks helpsfuture-proof your architecture. Work seamlessly with your favoriteintegrated development environments (IDEs), libraries and programminglanguages. Integrate with a broad ecosystem of other services throughnative connectors and APIs.C O L L A B O R AT I V EData teams can work together using their favorite tools to collaborate onthe same underlying data. Data engineers, data scientists and analystscan leverage a common data lake using collaborative notebooks, IDEsand dashboards.4Architecture
Modern Analytics With Azure DatabricksData FlowThis reference architecture is inspired by systems built by customers for streamingdata analytics and machine learning across numerous industry verticals, including theenergy sector, retail and e-commerce, banking and finance, healthcare and medicine.1. Ingests raw streaming data from Azure Event Hubs.58. Optionally, if a data warehouse is needed for business-ready data andaggregates, Gold data sets can be exported out of the data lake into AzureSynapse via the optimized Synapse connector.9. Leverage Azure platform services for collaboration, performance, reliability,governance and security: Azure Purview: Data discovery and governance insights, data classificationand sensitivity insights across your entire data estate.3. For both streaming and batch data, Azure Databricks combines all yourstructured, unstructured, semi-structured and streaming data (logs, files andmedia) using the medallion model with Delta Lake on Azure Data Lake Storage. Azure DevOps: Continuous integration and continuous deployment (CI/CD). Configure Azure DevOps as your Git provider and take advantage of theintegrated version control features.4. Data scientists perform data prep, data exploration, model preparation andmodel training using managed MLflow for parameter, metric and modeltracking. Users can leverage the language of their choice, including SQL, Python,R and Scala, and leverage popular open source libraries and frameworks suchas Koalas, pandas and scikit-learn, which are pre-installed and optimized.Practitioners can optimize for performance and cost with single- and multinode compute options. Azure Key Vault: Securely manage your secrets such as keys and passwords. Azure Active Directory: Use single sign-on (SSO) to Azure Databricks. AzureDatabricks also supports automated user provisioning with Azure AD tocreate new users, give them the proper level of access and remove users todeprovision access. Azure Monitor: Collect, analyze and act on telemetry information ofyour Azure resources to proactively identify problems and maximizeperformance and reliability. Azure Cost Management: Financial governance over your Azure workloads.2. Ingests raw batch data from Azure Data Factory into Azure Data Lake Storage.5. Models can be served natively for batch, streaming and REST APIs in AzureDatabricks using the MLflow Model Repository. Optionally, models can bedeployed to Azure Machine Learning web services and/or Azure KubernetesService (AKS).6. Users can perform ad hoc SQL queries on the data lake with Azure DatabricksSQL Analytics, which provides a query editor and catalog, query history, basicdashboarding and alerting, and integrated security, including row- and columnlevel permissions, all accelerated with Photon for up to 20x faster performance.7. Data lake exploration, reports and dashboards in Power BI use a nativeconnector and optimized JDBC/ODBC drivers.Each service connects to the same underlying data to ensure consistency.The architecture leverages a shared data lake leveraging the open Delta Lakeformat. The analytical platform ingests the data from the disparate batch andstreaming sources to form a unified data platform, which can be used to serveanalytical reports, serve historical reports for end users and train ML models for arecommendation engine.
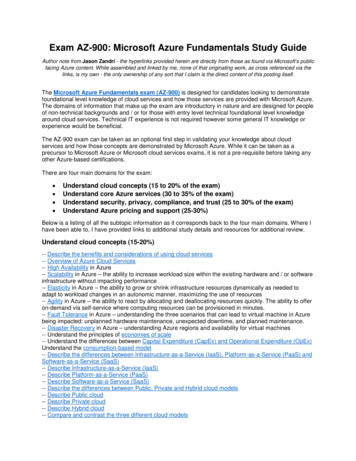
Modern Analytics With Azure Databricks6Example Use Case —Wind Turbine OptimizationMost Industrial IoT (IIoT) analytics projects are designed to maximize the shortterm utilization of an industrial asset while minimizing its long-term maintenancecosts. In this example, we focus on a hypothetical energy provider trying tooptimize its wind turbines. The ultimate goal is to identify the set of optimalturbine operating parameters that maximize each turbine’s power output whileminimizing its time to failure.The final artifacts of this project are:1. An automated data ingestion and processing pipeline that streams data to allend users2. A predictive model that estimates the power output of each turbine givencurrent weather and operating conditions3. A predictive model that estimates the remaining life of each turbine givencurrent weather and operating conditions4. An optimization model that determines the optimal operating conditions tomaximize power output and minimize maintenance costs, thereby maximizingtotal profit5. A real-time analytics dashboard for executives to visualize the current andfuture state of their wind farms, as shown on the next pageThe goal of IIoT is to maximize utility in the short term while minimizingdowntime over the long term.
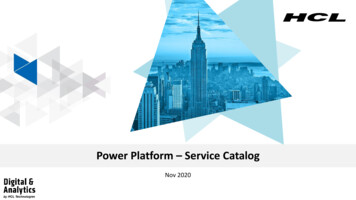
Modern Analytics With Azure Databricks7RPMAn IIoT analytics dashboard can help business executives visualize, for example, the current and futurestate of an industrial asset, such as a wind farm.Angle
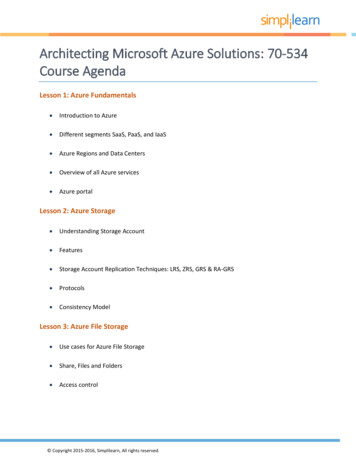
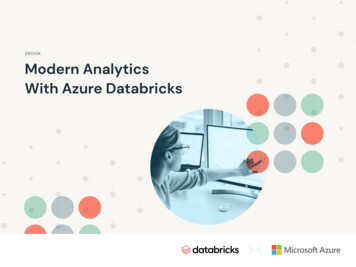
Modern Analytics With Azure DatabricksThe Architecture —Ingest, Store, Prep, Train, Serve, VisualizeThe architecture below illustrates a modern, best-of-breed platform used by many organizations that leveragesall that Azure has to offer for IIoT analytics.The IIoT data analytics architecture featuring the Azure Data Lake Storage and Delta storage formatoffers data teams the optimal platform for handling time-series streaming data.8
Modern Analytics With Azure Databricks9A key component of this architecture is Azure Data Lake Storage (ADLS), which enables the write-once, accessoften analytics pattern in Azure. However, data lakes alone do not solve challenges that come with time-seriesstreaming data. The Delta storage format provides a layer of resiliency and performance on all data sourcesstored in ADLS. Specifically for time-series data, Delta provides the following advantages over other storageformats on ADLS:REQUIRED CAPABILITYOTHER FORMATS ON ADLS GEN 2DELTA FORMAT ON ADLS GEN 2Unified batch and streamingData lakes are often used in conjunction with astreaming store like Cosmos DB, resulting in acomplex architecture.ACID-compliant transactions enable dataengineers to perform streaming ingestand historically batch loads into the samelocations on ADLS.Schema enforcementand evolutionData lakes do not enforce schema, requiring all datato be pushed into a relational database for reliability.Schema is enforced by default. As newIoT devices are added to the data stream,schemas can be evolved safely sodownstream applications don’t fail.Efficient upsertsData lakes do not support in-line updates andmerges, requiring deletion and insertions of entirepartitions to perform updates.MERGE commands are effective forsituations handling delayed IoT readings,modified dimension tables used forreal-time enrichment or if data needsto be reprocessed.File compactionStreaming time-series data into data lakes generateshundreds or even thousands of tiny files.Auto-compaction in Delta optimizesthe file sizes to increase throughputand parallelism.Multidimensional clusteringData lakes provide push-down filtering onpartitions only.Z-ORDERing time-series on fields liketimestamp or sensor ID allows Databricks tofilter and join on those columns up to 100xfaster than simple partitioning techniques.
Modern Analytics With Azure DatabricksThe DeploymentWe use Azure’s Raspberry Pi IoT simulator to simulate real-time machine-to-machine sensor readings and send themto Azure IoT Hub.Data Ingest: Azure IoT Hub to Data LakeOur deployment sends sensor readings for weather (wind speed and direction, temperature, humidity) and windturbine telematics (angle and RPM) to an IoT cloud computing hub. Azure Databricks can natively stream data from IoTHub directly into a Delta table on ADLS and display the input rate vs. the processing rate of the data.# Read directly from IoT Hubs using the EventHubs library for Azure Databricksiot stream (spark.readStream.format(“eventhubs”) # Read from IoT Hubs directly.options(**ehConf) # Use the Event-Hub-enabled connect string.load() # Load the data.withColumn(‘reading’, F.from json(F.col(‘body’).cast(‘string’), schema)) # Extract the payload.select(‘reading.*’, F.to date(‘reading.timestamp’).alias(‘date’)) # Create a “date” field)# Split our IoT Hubs stream into separate streams and write them both into their own Delta locationswrite turbine to delta (iot stream.filter(‘temperature is null’) # Filter out turbine telemetry ’,’rpm’,’angle’) # Extract the fields of interest.writeStream.format(‘delta’) # Write our stream to the Delta format.partitionBy(‘date’) # Partition our data by Date for performance.option(“checkpointLocation”, ROOT PATH “/bronze/cp/turbine”) # Checkpoint.start(ROOT PATH “/bronze/data/turbine raw”) # Stream the data into an ADLS path)10
Modern Analytics With Azure DatabricksDelta allows our IoT data to be queried within seconds of it being captured in IoT Hub.%sql-- We can query the data directly from storage immediately as it streams into DeltaSELECT * FROM delta. /tmp/iiot/bronze/data/turbine raw WHERE deviceid ‘WindTurbine-1’With the Delta storage format, IIoT data can be queried within seconds of capture for use with downstream analytics, such as a time-seriesdata visualization.We can now build a downstream pipeline that enriches and aggregates our IIoT applications data for dataanalytics.11
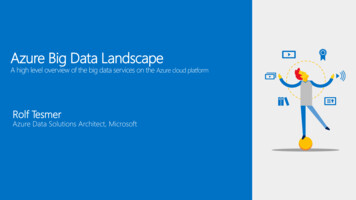
Modern Analytics With Azure DatabricksData Storage and Processing: Azure Databricks and Delta LakeDelta Lake supports a multi-hop pipeline approach to data engineering, where data quality and aggregationincrease as the data streams through the pipeline. Our time-series data will flow through the following Bronze,Silver and Gold data levels.Delta Lake supports a multi-hop pipeline approach to data engineering, where data quality and aggregation increase as the data streamsthrough the pipeline.12
Modern Analytics With Azure DatabricksOur pipeline from Bronze to Silver will simply aggregate our turbine sensor data to one-hour intervals. We willperform a streaming MERGE command to upsert the aggregated records into our Silver Delta tables.# Create functions to merge turbine and weather data into their target Delta tablesdef merge records(incremental, target mental”)# MERGE consists of a target table, a source table (incremental),# a join key to identify matches (deviceid, time interval), and operations to perform# (UPDATE, INSERT, DELETE) when a match occurs or notincremental. jdf.sparkSession().sql(f”””MERGE INTO turbine hourly tUSING incremental iON i.date t.date AND i.deviceId t.deviceid AND i.time interval t.time intervalWHEN MATCHED THEN UPDATE SET *WHEN NOT MATCHED THEN INSERT *“””)# Perform the streaming merge into our data streamturbine stream (# Read data as a stream from our Bronze �turbine raw’)# Aggregate readings to hourly ow(‘timestamp’,’1 avg”}).writeStream.foreachBatch(merge records) # Pass each micro-batch to a function.outputMode(“update”) # Merge works with update mod.start())13
Modern Analytics With Azure DatabricksOur pipeline from Silver to Gold will join the two streams into a single table for hourly weather and turbinemeasurements.# Read streams from Delta Silver tablesturbine hourly oreChanges”, True).table(“turbinehourly”)weather hourly oreChanges”, True).table(“weatherhourly”)# Perform a streaming join to enrich the dataturbine enriched turbine hourly.join(weather hourly, [‘date’,’time interval’])# Perform a streaming merge into our Gold data streammerge gold stream (turbine enriched.writeStream.foreachBatch(merge records).start())We can query our Gold Delta table immediately.With Delta Lake, you can query your enriched, AI-ready data immediately, for use with IIoT data science predictive models to optimizeasset utilization.14
Modern Analytics With Azure DatabricksThe notebook also contains a cell that will generate historical hourly power readings and daily maintenancelogs that will be used for model training. Running that cell will:1. Backfill historical readings for one year in the turbine enriched table2. Generate historical power readings for each turbine in the power output table3. Generate historical maintenance logs for each turbine in the turbine maintenance tableWe now have enriched, artificial intelligence (AI)-ready data in a performant, reliable format on Azure DataLake Storage that can be fed into our data science modeling to optimize asset utilization.%sql-- Query all 3 tables togetherCREATE OR REPLACE VIEW gold readings ASSELECT r.*,p.power,m.maintenance as maintenanceFROM turbine enriched rJOIN turbine power p ON (r.date p.date AND r.time interval p.time interval AND r.deviceid p.deviceid)LEFT JOIN turbine maintenance m ON (r.date m.date AND r.deviceid m.deviceid);SELECT * FROM gold readings15
Modern Analytics With Azure DatabricksOur data engineering pipeline is complete! Data is now flowing from IoT Hub to Bronze (raw) to Silver(aggregated) to Gold (enriched). It is time to perform some analytics on our data.Machine Learning: Power Output and Remaining Life OptimizationOptimizing the utility, lifetime and operational efficiency of industrial assets like wind turbines has numerousrevenue and cost benefits. The real-world challenge we explore in this scenario is to maximize the revenue of awind turbine while minimizing the opportunity cost of downtime, thereby maximizing our net profit.Net profit power generation revenue – cost of added strain on equipmentIf we push a turbine to a higher RPM, it will generate more energy and therefore more revenue. However, theadded strain on the turbine will cause it to fail more often, introducing cost.To solve this optimization problem, we will create two models:1. Predict the power generated by a turbine given a set of operating conditions2. Predict the remaining life of a turbine given a set of operating conditions16
Modern Analytics With Azure DatabricksUsing Azure Databricks IIoT data analytics to predict the remaining life of a wind turbine.We can then produce a profit curve to identify the optimal operating conditions that maximize power revenuewhile minimizing costs.Using Azure Databricks with our Gold Delta tables, we will perform feature engineering to extract the fields ofinterest, train the two models and finally deploy the models to Azure Machine Learning for hosting.17
Modern Analytics With Azure DatabricksThe Azure Databricks machine learning model lifecycle for an IIoT data analytics use case.18
Modern Analytics With Azure DatabricksTo calculate the remaining useful lifetime of each wind turbine, we can use our maintenance records, whichindicate when each asset should be replaced.%sql-- Calculate the age of each turbine and the remaining life in daysCREATE OR REPLACE VIEW turbine age ASWITH reading dates AS (SELECT distinct date, deviceid FROM turbine power),maintenance dates AS (SELECT d.*, datediff(nm.date, d.date) as datediff next, datediff(d.date, lm.date) asdatediff lastFROM reading dates d LEFT JOIN turbine maintenance nm ON (d.deviceid nm.deviceid ANDd.date nm.date)LEFT JOIN turbine maintenance lm ON (d.deviceid lm.deviceid AND d.date lm.date ))SELECT date, deviceid, min(datediff last) AS age, min(datediff next) AS remaining lifeFROM maintenance datesGROUP BY deviceid, date;To predict power output at a six-hour time horizon, we calculate time-series shifts using Apache Spark window functions.CREATE OR REPLACE VIEW feature table ASSELECT r.*, age, remaining life,-- Calculate the power 6 hours ahead using Spark Windowing and build a feature table tofeed into our ML modelsLEAD(power, 6, power) OVER (PARTITION BY r.deviceid ORDER BY time interval) aspower 6 hours aheadFROM gold readings rJOIN turbine age a ON (r.date a.date AND r.deviceid a.deviceid)WHERE r.date CURRENT DATE(); -- Only train on historical data19
Modern Analytics With Azure DatabricksWith Azure Databricks, you can calculate time-series shifts using Spark window functions to predict, for example, the power output of awind farm at a six-hour time horizon.This shows how Azure Databricks IIoT data analytics lets you calculate the remaining useful lifetime of a wind turbine, using maintenancerecords that indicate when each asset has been replaced.20
Modern Analytics With Azure Databricks21There are strong correlations of turbine operating parameters (RPM and angle) and weather conditions with thepower generated six hours from now.With Azure Databricks IIoT data analytics,you can uncover, for example, thestrong correlations of turbine operatingparameters (RPM and angle) and weatherconditions with future power generated.
Modern Analytics With Azure DatabricksWe can now train an XGBoost regressor model to use our feature columns (weather, sensor and powerreadings) to predict our label (power reading six hours ahead). We can train a model for each wind turbine inparallel using a pandas UDF, which distributes our XGBoost model training code to all the available nodes inthe Azure Databricks cluster.# Create a Spark Dataframe that contains the features and labels we needfeature cols ty’,’windspeed’,’power’,’age’]label col ’power 6 hours ahead’# Read in our feature table and select the columns of interestfeature df spark.table(‘feature table’)# Create a Pandas UDF to train a XGBoost Regressor on each turbine’s data@pandas udf(feature df.schema, PandasUDFType.GROUPED MAP)def train power model(readings pd):mlflow.xgboost.autolog() # Auto-Log the XGB parameters, metrics, model and artifactswith mlflow.start run():# Train an XGBRegressor on the data for this Turbinealg xgb.XGBRegressor()train dmatrix xgb.DMatrix(data readings pd[feature cols].astype(‘float’),label readings pd[label col])model xgb.train(dtrain train dmatrix, evals [(train dmatrix, ‘train’)])return readings pd# Run the Pandas UDF against our feature datasetpower predictions feature df.groupBy(‘deviceid’).apply(train power model)22
Modern Analytics With Azure DatabricksAzure Databricks IIoT data analytics lets you predict the power output of a specific wind turbine and display the results in a time-seriesvisualization, as shown here.Azure Databricks will automatically track each model training run with a hosted MLflow experiment. For XGBoostregression, MLflow will track any parameters passed into the params argument, the root-mean-square error(RMSE) metric, the turbine this model was trained on and the resulting model itself. For example, the RMSE forpredicting power on deviceid WindTurbine-18 is 45.79.23
Modern Analytics With Azure DatabricksWith Azure Databricks IIoT data analytics, you can automatically track each model training run with a hosted MLflow experiment. ForXGBoost regression, MLflow will track any parameters passed into the params argument to predict, for example, the power output of awind turbine by specific deviceid.24
Modern Analytics With Azure DatabricksWe can train a similar model to predict the remaining life of the wind turbine. The actual life vs. the predicted lifeof one of the turbines is shown below.With Azure Databricks IIoT data analytics, you can predict, for example, the remaining life span of a wind turbine and generate a timeseries visualization comparing the prediction against the actuality.Model Deployment and HostingAzure Databricks is integrated with Azure Machine Learning for model deployment and scoring. Using theAzure ML APIs directly inside of Databricks, we can automatically deploy an image for each model to behosted in a fast, scalable container service (ACI or AKS) by Azure ML.# Create a model image inside of AzureMLmodel image, azure model mlflow.azureml.build image(model uri path,workspace workspace,model name model,25
Modern Analytics With Azure Databricksimage name model,description ”XGBoost model to predict power output”,synchronous False)# Deploy a web service to host the model as a REST APIdev webservice deployment config AciWebservice.deploy configuration()dev webservice Webservice.deploy from image(name dev webservice name,image model image,workspace workspace)Once the model is deployed, it will show up inside the Azure ML studio, and we can make REST API calls toscore data interactively.Once the model is deployed, it will show up inside the Azure ML studio. You can make REST API calls to score data interactively.26
Modern Analytics With Azure Databricks# Construct a payload to send with the requestpayload 00,‘age’:10}def score data(uri, payload):rest payload json.dumps({“data”: [list(payload.values())]})response requests.post(uri, data rest payload, headers {“Content-Type”: “application/json”})return json.loads(response.text)print(f’Predicted power (in kwh) from model: {score data(power uri, payload)}’)print(f’Predicted remaining life (in days) from model: {score data(life uri, payload)}’)Now that both the power optimization and the RUL models are deployed as prediction services, we can utilizeboth in optimizing net profit from each wind turbine.Assuming 1 per kWh, annual revenue can simply be calculated by multiplying the expected hourly power by24 hours and 365 days.The annual cost can be calculated by multiplying the daily revenue by the number of times the turbine needsto be maintained in a year (365 days / remaining life).We can iteratively score various operating parameters simply by making multiple calls to our models hostedin Azure ML. By visualizing the expected profit cost for various operating parameters, we can identify theoptimal RPM to maximize profit.27
Modern Analytics With Azure DatabricksWith Azure Databricks IIoT data analytics, you can iteratively score various operating parameters by calling the models hosted in Azure ML.The resulting visual analytic of the expected profit cost for various parameters — like the one shown here — can help to identify the optimalRPM to maximize profit.Data Serving: Azure Data Explorer and Azure Synapse AnalyticsOperational Reporting in ADXAzure Data Explorer (ADX) provides real-time operational analytics on streaming time-series data. Datacan be streamed directly into ADX from IoT Hub or pushed from Azure Databricks using the Kusto SparkConnector from Microsoft, as shown on the next page.28
Modern Analytics With Azure Databricksstream to adx noreChanges’,True).table(‘turbine Database”]).option(“kustoTable”, toOptions[“kustoAadAuthorityID”]))Power BI can then b
Modern analytics enables you to unify all your data, analytics and AI workloads at any scale, and to get insights for all your users through analytics dashboards, operational reports or advanced analytics. Modern analytics with Azure Databricks is simple, open and col