Transcription
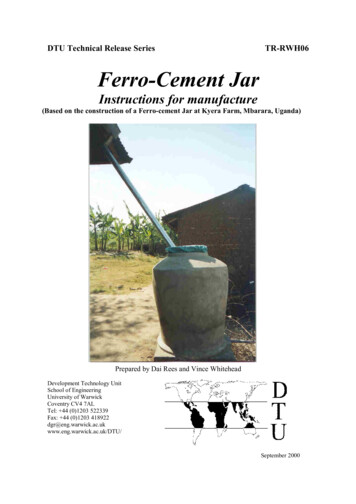
Jar Testing Made EasyAchieve meaningful, useful, and transferable jar testing results by applying bestpractices learned from a recent study of 37 water treatment facilities in California.BY GUY SCHOTT, P.E.Guy Schott is a civil engineer with the California State Water Resources Control Board,Division of Drinking Water(https://www.waterboards.ca.gov/drinking water/programs/districts/mendocino district.html), Santa Rosa, Calif.Jar testing and filterability procedures yield useful data to help water treatment plantoperators and engineers select the best coagulant and optimum dose. As part of aCalifornia State Water Resources Control Board research project, more than 1,400individual jar tests were conducted from 2018 to 2020 for 37 of the state’s public surfacewater treatment plants using various treatment technologies. Field and laboratory resultsvalidated the developed jar test and filterability procedures, accurately predicting fullscale plant filtration performance and indirect organic reductions.JAR TESTING CONCERNSWater treatment plant operators add coagulant(s) to neutralize negatively chargedparticles and combine them into larger particles for removal. Jar testing can be used asa tool to help select the proper coagulant and dose for the reduction of pathogens anddisinfection by-product pre-cursors. However, existing jar testing procedures can beinvolved, time consuming and may not provide the necessary data to make informeddecisions on the selected coagulant type and dose for transferable full-scale plantperformances.Treatment plants with flocculation and settling basins are designed to remove as muchsuspended solids and dissolved organic carbon (DOC) as practical before filtration. Toachieve this goal, selected coagulant(s), doses, mixing energies and flow contact times1
are adjusted to produce a settleable floc. Plants with pre-roughing filters (nonbuoyantand buoyant medias), are designed (media type, size, depth and contact times) togenerate a removable floc through hydraulically produced energy. Any pre-treatmentcarry-over floc should be robust so it can be removed in the final media filtrationprocess. The same principals are valid for membrane treatment plants with pretreatment, as reducing suspended solids and dissolved organics are critical parametersin reducing membrane fouling and disinfectant by-products.It’s important to optimize settleability of formed flocs for solids reduction, longer filterruns, and improved overall treatment plant performance. Just as important is the needto optimize the reduction of DOC and media filterability of carryover floc particles thataren’t settled or physically removed in the pre-treatment process stage. By working withseveral water treatment utilities, it was determined that filterability analysis on carry-overfloc and indirect measurements of DOC removal generally aren’t performed. Utilitypersonnel that do perform filterability testing may use a method and/or analysis thatdoes not generate transferable data to full-scale plant filtration performance. TheCalifornia State Water Resources Control Board’s research resulted in a filterabilitytechnique and indirect dissolved organic measurements will be discussed that providesgood transferable data to full-scale plant performances.JAR TEST FIELD STUDYThe 37 surface water treatment plant sources involved in the research were jar tested todevelop, improve and validate jar testing and filterability procedures. Many of theseplants were visited multiple times during different seasons. The practical proceduresdeveloped and described here generated good floc production that allowed theevaluation and analysis of selected coagulants, dose, filterability, indirect dissolvedorganic reduction and settleability. The jar test results are representative of full-scaleplant performances which was confirmed by comparing coagulant dose, filtrate turbidityand indirect organic reduction.Measurements. Measured jar testing parameters were filtrate turbidities, filtrate%UVT/UVA and settled water turbidities. Source water turbidities and UVT/UVA werealso measured. Ultraviolet transmittance (UVT) is a measurement of the amount ofultraviolet light (254 nm wavelength) that passes through a water sample compared tothe amount of light that passes through an organic free water sample expressed as apercentage, %UVT. UV absorbance (UVA) is a relative measure of the amount of lightabsorbed by a water sample compared with the amount of light absorbed by an organicfree water sample. These parameters are an indirect measurement of dissolvedorganic carbon. If one parameter is measured, the other can be calculated (UVA log(%UVT/100); %UVT 10(-UVA) x 100%). UVA values have a linear relationship oforganic matter in water. For example, if the concentration of organic material in thewater were to reduce by half via treatment, then UVA would reduce by half. UVT valuesdo not have a linear relationship to organic concentration.Humic substances absorb UV light at 254 nm, whereas nonhumic substance are low inUV absorption at 254 nm. Humic substances comprise about 60-80% of soil organic2
matter and are removed through the coagulation/filtration process. Nonhumicsubstances comprise about 5-25% of the humus in soils which are nonamenable toenhanced coagulation. Two source waters with the same UV absorbance value canhave very different percent organic properties.Jar Tester. A four-jar tester using 1-Liter round beakers were used for nearly all fieldand laboratory studies. Most source waters were collected at the plant and transportedback for laboratory jar testing. The benefits in using 1-liter round jars over 2-litersquared jars are (1) 50 percent less water required for a set of jar testing, (2)mathematically easier for preparing stock solutions, (3) ease of drawing samples foranalysis, and (4) easy cleaning and storage.Flash Mixing. Flash mixing at 200 revolutions per minute (RPM) for 30-60 secondsusing 1-liter jars to rapidly disburse the coagulant(s) was used for most studied sources.To evaluate the impact flash mixing had on filtrate turbidity, %UVT/UVA andsettleability, mixing duration was varied from 60-0 seconds for selected sources (Table1). In most cases, jar testing with and without flash mixing had no significant impact onfiltrate turbidity and %UVT/UVA. For jars tested without initial flash mixing, delay of flocdevelopment occurred impacting floc settleability in most sources resulting in highersettled water turbidities. As more jar test studies were conducted, 30 seconds of flashmixing (200 RPM) was determined to be an efficient duration for rapid mixing.Case Study: Flash Mixing. In a case study, water system (CLO, Table 1) operated forseveral months without its inline motionless flash mixer pending replacement. Therewas no measurable decline in plant settle and filterability performances. Jar testing wasconducted and showed no significant performance differences with and without flashmixing.Given the overall jar test results of source waters tested with and without initial rapidmixing, flash mixing at 200 RPM for 20 to 60 seconds is considered adequate to rapidlydisperse the applied chemical. For older jar testing equipment with a maximum paddlespeed of 100 RPM, limit studies have shown that mixing for 20-60 seconds wasadequate.TABLE 1. Flash and Floc Speed VariationsPlant200 RPM RPMFloc Coag/IDFlashFlocMixAidsecSpeed 7SW1530567CLO6030523CLO603010233Filtrate Filtrate FiltrateNTU%UVT 0.0230.025SettledNTU25 min0.820.630.490.510.840.780.480.39
Settleability. Settled water turbidity samples were taken 25 minutes from the end of theflocculation process. A settling duration of 25 minutes was chosen as this was the timeperiod to complete the filterability and %UVT/UVA analysis for a four-jar tester.4
For some tested source waters, shorter and longer settling times were evaluated (Table2) to determine impact on settleability performance. The settleability performancebetween each jar and coagulant is relative and therefore is not critical to match thosevalues to full-scale performance values. Extending the flocculation duration providestime for increase in particle collision which improves floc formation producing heavierfloc resulting in improved settleability for most jars up to the point of diminishing returns.To improve settleability for a given settling time, the flocculation duration can beextended if the goal is to match full-scale plant performance.TABLE 2. SettleabilityPlant 200 RPM 30 W605SW605SW605SW605GS305GS3010GS3020Coag/ Filtrate Filtrate FiltrateAidNTU%UVT leNTU15 minSettleNTU25 minSettleNTU35 1.11.01.10.420.230.22
FILTERABILITY TESTPlant operators should have confidence that the selected coagulant and dose willprovide the optimum filtrate turbidity and indirect DOC reduction. The results fromevaluating 37 source waters and a number of coagulant products demonstrated that thetest jar with the lowest settled water turbidity did not necessarily produce a filtrate waterwith the lowest turbidity or lowest indirect reduction of DOC. The developed filterabilitytest was used to evaluate the performance of floc particles removal between eachtested jar. Jar testing data indicated the filterability results were consistent with fullscale plant performances based on equivalent coagulant doses.Laboratory supplies and equipment used to conduct the filterability test consisted of a30 mL syringe, a filter holder with a membrane filter assigned to each tested jar andportable turbidity meter. About 1-inch below the water surface for each jar, coagulatedwater is drawn with a 30 mL syringe immediately at the end of the flocculation periodwhen evaluating direct filtration plants and plants with roughing filters. For conventionaland dissolved air flotation plants, coagulated water is drawn 5 minutes at the end of theflocculation period for the filterability analysis. The purpose of early withdrawal of6
coagulated water before it had time to properly settled is to evaluate the filterability andfloc strength of potential carry-over floc for each tested coagulant and dose.Filter Material and Size. 1.2 µm absolute size Isopore membrane filters were used forthe filterability test. Submicron and weak floc particles will pass through the Isoporemembrane filter increasing filtrate turbidity. Comparing full-scale data to that ofobtained from Isopore membrane filter with a 1.2 µm absolute size shows good filtrateturbidity correlation. An Isopore membrane filter is placed into each filter holder andattached to a 30 mL syringe with luer-lock tip filled with flocculant water from each jar.By hand, the flocculant water is slowly pushed through the 1.2 µm membrane filterdirectly into a cuvette for filtrate turbidity and %UVT/UVA measurements.Using a smaller pore-size filter ( 1.2 µm absolute) will remove weak flocs andsubmicron particles that would otherwise breakthrough a 1.2 µm membrane filterresulting in similar filtrate turbidities between optimum and non-optimum coagulantdoses. Conversely, using a filter pore-size greater than 1.2 µm will allow most flocs(strong and weak) to breakthrough significantly increasing filtrate turbidities providinguseless data to distinguish between optimum and non-optimum filtrate turbidity andcoagulant dose.7
Floc Strength. In selecting the best coagulant and dose, visual floc strength canprovide supporting data. Floc strength is based on the uniform coverage of removedfloc and suspended solids onto the membrane filter. An indication of a weak floc is therise in filtrate turbidity and nonuniform solids coverage on the membrane filter. Intranslating the results to full-scale media filtration, observed were shorter filter runs, andhigher filtrate turbidities. The laboratory Isopore membranes are inspected by removingthem from the filter holder and placing them on a surface for visual comparison.%UVT/UVA MEASUREMENTSAn important parameter of jar testing are the measurements of %UVT/UVA. Inevaluating which coagulant and dose produced the best filtrate turbidity, measurementsof %UVT/UVA provided additional supporting data regarding indirect reduction ofdissolved organics. Jar testing allowed for the evaluation of different dose and/orcoagulants and to compare which jar(s) of similar filtrate turbidity provided optimumindirect dissolved organic reduction via measurements of %UVT/UVA. Each plant’sfiltrate %UVT/UVA was also measured to compare with jar test results. In most cases,similar results were observed.8
Source %UVT/UVA. Source water %UVT/UVA was measured to provide a comparisonto filtrate water. Suspended solids can interfere with %UVT/UVA measurementsregarding the absorption of indirect dissolved organic carbon. For true %UVT/UVAmeasurements, source water samples should be filtered directly into a cuvette using a0.4 µm absolute size Isopore membrane to remove most suspended solids applying thesame filterability technique for filtrate water analysis.Post Chlorination %UVT/UVA. The addition of chlorine to the source and/or filtratewater can rapidly react with natural organic matter (NOM) by oxidation creatingdisinfection by-products that are not measured by %UVT/UVA. The NOM will bereduced resulting in a lower UVA value. Chlorine is reactive with humic substancescreating disinfection by-products not measured by %UVT/UVA. Chlorine is less reactivewith nonhumic substances forming less disinfection by-products. A water with littlechange in %UVT/UVA after disinfection could be an indication of less production ofdisinfection by-products. Due to the potential change in plant filtrate %UVT/UVA andturbidity taken downstream of the chlorine injection point, plant samples should be takenbefore chlorine injection when comparing jar test results of filtrate %UVT/UVA andturbidity.PRE-OXIDATIONPre-oxidation can improve filtrate turbidity, enhance DOC reduction, improve taste andodors and reduce coagulant dose. Jar testing with and without ozonation, potassiumpermanganate and chlorine as pre-oxidants were evaluated.Pre-Ozonation. Two treatment facilities with pre-ozonation were evaluated. Jar testingwas conducted on the source waters before and after ozonation to assess the impact tocoagulant dose, filtrate turbidity and indirect organic reduction. As shown in Table 3,pre-ozonation at plant HM had a significant impact on coagulant dose and indirect DOCreduction. For plant MID, a fairly pristine source, the pre-ozonation process had a minorimpact on coagulant dose and DOC reduction. The average total organic carbon (TOC)for HM was 4.9 mg/L compared to 1.5 mg/L for MID.TABLE 3. Pre-OzonationPlant 200 RPM 30 eOzoneNoYesNoYesCoag Filtrate Filtrate Filtratemg/LNTU%UVT 30.0340.0170.011SettledNTU(25 min)1.01.59.08.5Pre-KMnO4. Jar testing was conducted for a water system that injects potassiumpermanganate (KMnO4) as a pre-oxidant. Water was collected at the source beforeKMnO4 injection and downstream at the plant before coagulant injection. One of the9
evaluations of this study was to compare treatment performances with and withoutKMnO4 pre-oxidation (Table 4).There were no significant performance differences between filtrate and settled waterturbidities. However, measurements of %UVT/UVA showed improved indirect reductionin dissolved organics with the KMnO4 pre-oxidated water. The KMnO4 hydraulic contacttime is at least 30 minutes before coagulant injection. To evaluate a source water withand without KMnO4 in jar testing, slow flocculation and variable detention time isneeded followed by coagulation for performance evaluation.TABLE 4. Potassium Permanganate Pre-OxidationPlant 200 RPM 30 RPMPreCoag/ .590.690.690.891.191.591.591.7Filtrate SettledUVA/cmNTU25 min0.0430.0430.0430.0420.0400.0390.0390.038TABLE 5. Sodium Hypochlorite Pre-OxidationPlant 200 RPM 30 RPMPreCoag/ Filtrate Filtrate FiltrateIDFlashFlocCl2AidNTU%UVT 25 nation. In several jar testing with and without chlorine, pre-chlorinationgenerally improved the filtration performance. A general by-product of pre-chlorinationis an increase in %UVT or decrease in UVA. The change in %UVT/UVA is assumed to10
result from some of the DOC being converted to disinfection by-products giving a falseindication that DOC was reduced through the coagulation process. For this study,there’s no supporting data to verify if pre-chlorination has a negative effect ondisinfection by-products formation.CASE STUDY: TTHM/HAA5Jar testing procedures and analysis were applied to a utility with disinfection byproducts (TTHMs/HAA5s) over the maximum contamination level (MCL) (Table 6).Several coagulants were jar tested over a 12-month period to determine whichcoagulant provided consistent and optimum filtrate turbidity and indirect reduction inDOC on the seasonal water quality characteristics. The treatment facility serves acommunity of 110 service connections. The treatment plant has two identical trainsallowing side-by-side studies to be conducted. Each treatment train consists of a nonbuoyant roughing filter followed by multi-media filtration in closed pressurized vessels.The empty-bed-contact-time (EBCT) for the roughing filter is approximately 9 minutes.The first series of testing began with Train 1. Operating with the plant’s existingcoagulant, a grab sample was taken for measurements of filtrate turbidity and%UVT/UVA. Train 1 was then taken off-line and backwashed. The original coagulantwas taken off-line and a new selected coagulant from jar test results was put on-line.Filter-to-waste was initiated for Train 1 until the online filtrate turbidity met complianceperformance before placed into service. After in service for one hour, a filtrate grabsample was taken and analyzed for turbidity and %UVT/UVA. The results between theoriginal and new coagulant are depicted in Table 7.TABLE 6. Trihalomethanes & Haloacetic AcidsSample QuarterTotal Trihalomethanes(TTHMs, ug/L)st1 Qtr. 2018120nd2 Qtr. 20181103rd Qtr. 201876th4 Qtr. 20181101st Qtr. 2019130nd2 Qtr. 2019983rd Qtr. 2019120New Coagulant Online76(4th Qtr. 2019)1st Qtr. 202079nd2 Qtr. 202084Haloacetic Acids(HAA5s, ug/L)14013647.792.414049.82.824.600Once the plant’s filtrate and indirect DOC performance of the new coagulant wasconfirmed, the next test performed was to compare the disinfection by-productsbetween each train using the plant’s original coagulant on one train and the newcoagulant on another train. After a few weeks running the new coagulant in Train 1 andthe original coagulant in Train 2, samples were taken from each train when each wasapproximately 50% into their filter run-time. One-liter filtrate samples were taken fromeach treatment train and analyzed for turbidity and %UVT/UVA. Thereafter, each of the11
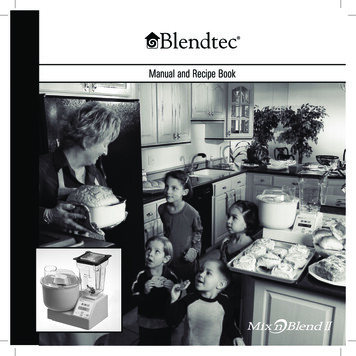
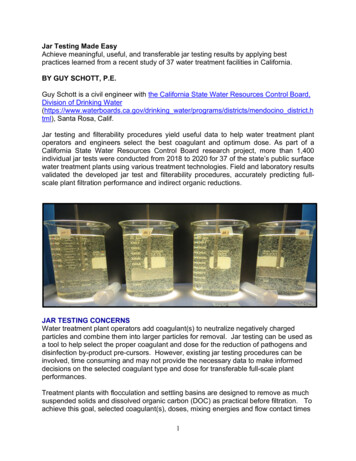
1-liter samples were spiked with 2.0 mg/L NaOCl and held for 7 days in a darkenvironment. At the end of 7 days, samples were transferred to sample vials andtransported to a certified laboratory for TTHMs/HAA5s analysis (Table 8).TABLE 7. Treatment Plant PerformanceTrain #CoagulantFiltrate, NTU1Original Coagulant0.101New Coagulant0.05%UVT91.697.2UVA/cm0.0380.012TABLE 8. Treatment Plant Performance and Disinfection A5#NTUug/Lug/L1New 1049CoagulantNote: Filtrate 1-liter samples spiked with 2.0 mg/L NaOCl and held for 7 days in darkenvironment.The experimental results (Table 8) showed a significant improvement in the reduction ofTTHMs/HAA5s with the new coagulant. With the new coagulant online, an increase inpH depression and shorter filter run-times were observed. To increase filter run times,the operator started dosing a small amount of PolyDADMAC which was already onsitethat increased filter run times. Using the on-site available process for potentialcorrosion control, post-treatment caustic soda was added to raise pH back to normallyoperations.In Table 6 shows the 2019 4th quarter to present TTHMs/HAA5s results since the newcoagulant went online. More research is ongoing as the water system is not able todetermine optimum coagulant dose. The water system is looking into online UVT/UVAmonitoring that can be used for coagulant adjustment.CHARGE NEUTRALIZATIONA laboratory charged analyzer (LCA) was used to determine the coagulant dose neededto neutralize the charged particles in tested source waters. Jar test doses arebracketed around the LCA coagulant dose results. Particles in source waters aregenerally negatively charged. Using the LCA results reduced the number of jar testingneeded to find the best coagulant and dose for optimum performance. For watersystems with multiple sources and/or experience seasonal changes in source watercharacteristics, the LCA is an excellent tool to start with in narrowing down the optimumcoagulant dose range.The LCA used in this study has two feed pumps that automatically inject the testcoagulant and acid or base if needed into a 1-liter beaker until the charged particleshave been neutralized. At charge neutralization, the LCA coagulant and acid/basedoses are displayed.12
13
TABLE 9. Laboratory Charged Analyzer vs Jar Test Results*Plant IDLCACoagulant/ Filtrate 050RV14140.0893.10.030* Flash Mix 30-60 seconds (200 RPM), Floc Mix 5 minutes (30 RPM)SettledNTU25 .47For each source water tested, one or more coagulants were tested to determinecoagulant dose at which particle charge neutralization was achieved. Table 9 depictsthe LCA charge neutralization dose compared with the dose determined by jar testingsource waters for the listed water systems to achieve optimum or near optimum filtrateturbidity and %UVT/UVA values. For water systems implementing enhancedcoagulation or improve on DOC reduction, a higher dose was usually required thanwhat is depicted in Table 9 under the LCA and coagulant/aid dose columns.14
Note - the LCA coagulant dose at charge neutralization doesn’t mean the testedcoagulant will jar test well regarding filterability, %UVT/UVA and settleability. A poorperforming coagulant produces weak flocs that will penetrate the laboratory 1.2 µmIsopore membrane filter increasing filtrate turbidity and resulting in a negative impact on%UVT/UVA.PRACTICEJar testing should be performed regularly during non-water quality events to developand maintain the necessary skills and confidence to be able to confront water qualitychanges. Ideally, performing at least one set of jar testing per week will help keepprocedures fresh in memory and to maintain skills and confidence. Maintain databaserecord of coagulant, doses, filtrate and indirect DOC performances for anyoperator/engineer to review for seasonal water quality. Initial skill and confidencebuilding will require several hours of jar testing and practice.JAR TESING PROCEUDURES1. Fill 1-liter beakers with source or pre-oxidized (ozone, potassium permanganate,chlorine) water and place in jar tester.2. Place a label in front of each jar with coagulant name and dose.3. Place a labeled 30 mL syringe with luer-lock tip next to each jar.4. Insert 1.2 µm Isopore membrane filter (polycarbonate, hydrophilic) into each filterholder and place in front of each jar. Wet filter support screen before placement ofmembrane filter.5. Prepare 100-200 mL of stock solution and pour sample into 50 mL beaker.6. Lower paddles into each jar and tighten.7. Set paddle jar testing speed to 20-30 RPM.8. Verify each jar is centered with no slippage of paddles.9. Using the 50 mL beaker, pipette correct amount of coagulant and add to jar #1.Repeat procedure for remaining jars.a. Method of delivery - pipette (100-1,000 uL, 0.50-5.0 mL).b. If coagulant and/or filter aids are added, inject separately into each jar.c. If powder activated carbon (PAC) is added, add it after coagulant addition.d. Note: You may use same pipette for adding chemicals to each jar. It is notnecessary to add coagulants and pre-oxidants simultaneous to each jar.10. Flash mix - Increase paddle speed to 200 RPM and hold for 20 – 30 seconds.11. Flocculation – Reduce paddle speed to 20-30 RPM and hold for 5 minutes.a. Increase flocculation time to 10-15 minutes if PAC (powder activated carbon) isadded.12. Turn off mixer and lift paddles from jars and secure.13. Jar testing is completed (5.5 minutes).SAMPLING – FILTERABILITY/SETTLEABILITY1. For direct filtration and plants with pre-roughing filter.15
a. Below surface (1-inch), syringe 25-30 mL from each jar at end of the flocculationperiod.2. Plants with pre-settling (i.e., conventional treatment or equivalent).a. Wait 5 minutes at end of flocculation period then syringe 25-30 mL from each jar 1inch below surface.b. Note: Syringe suction rate is about 30 mL/15 sec. Regardless of suction rate beconsistent.3. After 25 minutes of total settling, dip assigned cuvette into each jar below surface(1.5-2-inches). Suggestion: Move jars forward to edge of base to allow easierdipping of cuvette.FILTERABILITY & %UVT/UVA ANALYSIS1. The filterability and %UVT/UVA analysis are conducted during the settling period.a. Good laboratory practice is imperative for obtaining meaningful results.b. Always hold cuvette sample cell towards top to avoid fingerprints on glass whereturbidity is read.c. One designated clean cuvette is used for all jars. It is verified by measurement oflow turbidity ( 0.08 NTU) using bottled water.2. Start with Jar #1 and complete analysis before going to the next jar.3. Attached filter holder to syringe and filter-to-waste 3-4 mL.4. Syringe remaining coagulated water directly into a clean cuvette to appropriate level.a. Keep the filtration rate to a slow to fast drip (60 – 90 seconds to dispense 20 mL).b. Drip rate should decrease with increase head loss due to solids removal. Do nottry to maintain initial drip rate with increase head loss or force floc breakthroughmay result. Head loss is felt by the increase thumb pressure on the syringeplunger.5. Measure and record filtrate turbidity once reading has stabilized.a. Wipe dry and clean outer cuvette before measurement.b. Tilt cuvette up to 90 degrees to remove any formed micro bubbles beforemeasurement.c. Up to 1-2 minutes may be needed for turbidity reading to stabilize.6. Transfer remaining filtrate water from cuvette to %UVT/UVA cuvette andmeasure/record.7. Rinse both cuvettes with clean water and repeat procedures for remaining jars.SETTLEABILITY (TURBIDITY ANALYSIS)1. At the end of 25 minutes of settling, dip the assigned cuvette for each jar 1-1.5inches below surface to fill. Operator may change the flocculation and/or settlingdurations to closely match plant settled water turbidities.a. Only dip cuvette once as floc particles will rise as cuvette is removed from jar.2. Measure turbidity from each cuvette assigned to jar. Take 3 readings and recordmidpoint value. For plants without settling, settleability analysis isn’t required.16
DATA RECORDING1. Jar number2. Product/coagulant dose (mg/L) and pre-oxidant/dose if added3. Filtrate turbidit
Jar Testing Made Easy . Achieve meaningful, useful, and transferable jar testing results by applying best practices learned from a recent study of 37 water treatment facilities in California. BY GUY SCHOTT, P.E. Guy Schott is a civil engineer with . the California State Water Resources Control Board, Division of Drinking Water