Transcription
10/15/99Introduction to Fluent and Simulation of Laminar Pipe FlowBy Michael A. TraetowPurposeThe purpose of the pre-lab is to introduce students to the computational fluid dynamics(CFD) software Fluent. Laminar flow through a pipe will be simulated in order to achieve thefriction factor and velocity profile. The data gained through the CFD simulation will then becompared to benchmark data.FluentFluent is the world leader in the rapidly growing field of design simulation software used topredict fluid flow, heat and mass transfer, chemical reaction and related phenomena. Fluent’ssoftware is used by engineers in corporations worldwide for product development, designoptimization, troubleshooting and retrofitting.[1]With the use of Fluent and computational fluid dynamics (CFD) engineers are able to performfaster analysis at a reduced cost with the end result being an improved design. By solving thefundamental equations governing fluid flow processes, Fluent provides information on importantflow characteristics such as pressure loss, flow distributions and mixing rates. CFD analysiscomplements traditional testing and experimentation, providing you with added insight andconfidence in your designs. The benefits of using Fluent and CFD are better designs, lower riskand faster time to the market place for your product or process. [1]Fluent's CFD solvers provide a wide range of physical models and numerical techniques. Fromcombustion to plastic extrusion, from supersonic airfoils to fluidized beds, Fluent provides thephysics and numerics needed to get accurate answers and stable calculations. [1]Simulation DesignThe simulation will be performed on the commercial CFD code Fluent. The simulation will bemodeled after the laboratory set-up of experiment number two (see Measurement of Flow Rate,Friction Factor, and Velocity Profile in Pipe Flow) and therefore will use the same pipegeometry as well as the same flow parameters, such as fluid density and viscosity. By modelingthe simulation after the experimental set-up, comparisons between the two test methods can bemade.In the remaining parts of this exercise and for those that will follow, PLAIN BOLD commandswill symbolize commands entered using the mouse; ITALISIZED BOLD will symbolizecommands typed in at the Fluent command prompt.Also worthy of note is the section titled “Additional Fluent Commands” attached to the end ofpre-lab 1. These are commands that may or may not be needed for the pre-lab, however will beused in lab #1.-1-
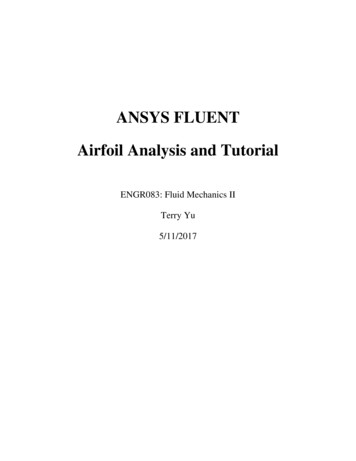
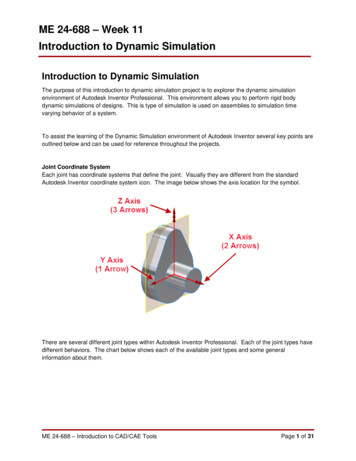
10/15/99Introduction to CFD procedureEach simulation using CFD, including Fluent, consists of five basic, but important steps. Thesesteps will be described below. In each of the following steps, the user must specify the inputparameters, which control the execution of the code and post processing of the results.Step 1 – Preliminary Inputs: During this step the user allocates memory for the CFDsimulation that is going to be performed. At this point it is also helpful to gather theinputs needed for the rest of the simulation and prepare them to be entered into the CFDsoftware.Step 2 – Grid Generation: This step is used to specify the geometry of the system, suchas radius of a pipe that is to be modeled. It is also during this step that the user sets theboundary conditions, such as the inlet or outlet of a pipe. Figure 1-a is a component usedin the aerospace industry, figure 1-b is the grid that was created to model this componentfor CFD analysis.(a)(b)Figure 1: Computer modeling of a aerospace industry component(Courtesy of Westland Aerospace Ltd.)[1]Step 3 – Flow Parameters: The fluid characteristics, such as density and viscosity arevery important to the CFD simulation. It is during this step that these two parameters, aswell at the mass flow rate, will be set by the user.Step 4 – Solve: This step many times proves to be the easiest for the user. The usersimply tells the program how many calculations to perform and activates the solver.Step 5 – Post Processing: The final step consists of the analysis of the results as well asinterpretation. Fluent provides output in both visual and numerical form. Both are key inunderstanding the flow results.In every CFD simulation whether simple or complex, these five basic steps are followed. It is ofthe utmost importance that care be taken while entering the input in each of these steps to ensurequality results. CFD, if used correctly, is as very useful and powerful tool.-2-
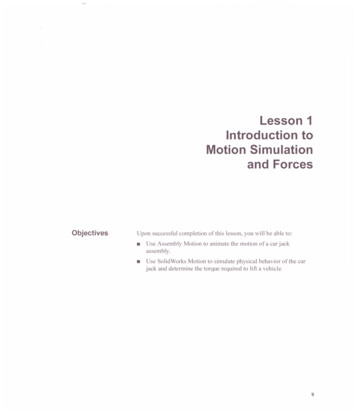
10/15/99CFD procedures for smooth laminar pipe flowFigure 2: Fluent main menuInitial Log-in:1) At a UNIX machine, logon to the ICAEN account assigned to you for the class.2) In the main directory, it may be helpful to create subdirectories for each of theCFD simulations. This is done by typing “mkdir directory name ”.3) In an xterm window type “fluent” to begin the Fluent software-3-
10/15/99Step 1: Preliminary InputsThe inputs that are required for this simulation are the following: Fluid viscosityFluid densityPipe diameterReynolds number (1000)Mass flow rate (found by using 2-D mass flow rate equation, (1))Q Re ν D ρ(1)8Where Re is the Reynolds number, D is the pipe diameter, ρ is the density and ν is the viscosity.The derivation of this equation is available upon request.1) Go to the DEFINE menu located in the command bar at the top of theFluent window (fig. 2). Choose ALLOCATE.2) From this menu, select k-e/RNG Turbulence model option in the “CreateSpace for” section. Select OK.Step 2: Grid Generation1) Go to the DEFINE menu in the command bar at the top of the Fluentwindow and select DOMAIN.2) From this window, you will choose Axisymmetric from the “options box”.3) Enter the Length (0.1 m) and the Outer Radius (radius of the pipe).4) Enter values for the size of the grid in the I-direction (7) and theJ-direction (62).5) APPLY - CLOSE.6) DEFINE – CELLS7) Once in the “Set Cells” window, select DISPLAY. This will open a graphicswindow with a picture of the grid.8) In this graphics window use the mouse to highlight the cells (I 1, J 61 to 2)and (I 7, J 61 to 2). Once these are highlighted, in the “Set Cells” windowclick on the arrow in the “Zone-type” section and select CYCLIC – APPLY.9) A window will appear that will ask if the geometry is rotationally cyclic, it is not sochoose no.10) In the graphics window highlight the cells (I 1 to 7, J 1) and define them asAXIS in the “Set Cells” window. Remember to hit APPLY11) The cells (I 1 to 7, J 62) will be defined as wall type boundary conditions,but since the wall type boundary condition is set as the default in Fluent, you will nothave to change these. CLOSE.10) You may view the grid by choosing DISPLAY – GRID – LIVE - DISPLAY.-4-
10/15/99Step 3: Flow ParametersReminder: italicized commands signify that the user must type these commands at theprompt1) From the setup-1 command prompt go to the Physical Constants menu.2) To input the density of the fluid, choose Density from this menu. You will beasked if you would like to employ the ideal gas law, you do not so answer no.3) Type Viscosity to set the desired viscosity. Please note the units of the viscosityrequested.4) Return to the main menu by typing Quit at the prompt until you have reached the “mainmenu” command prompt.Figure 3: Expert menu5) You will be asked once again if the geometry is rotationally cyclic, as before you willanswer no.6) Expert (figure 3) - Periodic Mass Flow.7) The first line asks if you would like to set the periodic mass flow rate, type yes.On the following line the mass flow rate is requested. Here you will enter theTwo dimensional mass flow rate calculated using the equation in the assignment handout.8) On line 3, enter a value of one as the “Guess for Pressure Drop Parameter”.9) Set the “Number of Correction Sweeps” at two on the following line.10) Return to the expert menu by typing Done on the last line.11) Solution Parameters. Change “Min Residual Sum” to 1 10-5. Done – Quit.12) Patch. A series of question about the regions you would like affected by thiscommand will appear. For each of these questions (there will be a total offour) the default value set by Fluent is the value you will use so press enter.13) U-velocity. You will want to set an initial guess for the velocity of the fluid inthe axial direction. The value you will enter here will be calculated using theReynolds number, however this is a guess so any number will do.14) Return to the main menu.-5-
10/15/99Step 4: Solve1) SOVLE – CONTROLS – UNDERRELAXATION2) Change the underrelaxation factor for the velocities to 0.7. The rest of thedefault values will be sufficient for your calculations.3) APPLY – CLOSE.4) SOVLE – MONITERS – RESIDUALS5) From the “Residuals” window, select Plot from the options section. A plot ofthe residuals is shown in.6) APPLY - CLOSE7) SOLVE – ITERATE8) In the “number of iterations” window enter the desired number of iterations.It is recommended that at least 600 iterations be performed, or until convergenceoccurs. Click on the Iterate button to begin the solver.Step 5: Post Processing1) DISPLAY – PROFILES2) The Profiles window allows you to view profiles of various dataacquired by the solver. This window also gives the minimum and maximumvalues of the variable selected in the “Profiles of” section.3) To change the variable, click on the arrow in the “Profiles of “ section andselect the desired variable.4) Once selected, click on Display to view graphically the profile of the selectedvariable. The velocity profile for fully developed turbulent pipe flow is shown in.5) From the main menu, select View Alpha – Select Variable. This will bringup a menu titled “variable options”.6) From this menu choose Xtended Xoptions.7) You are able to determine the wall shear stress by entering X-dir-wall-shearstress. The desired value for wall shear stress will be the only non-zero valuegiven on this screen. From the wall shear stress you are able to calculate thefriction factor.-6-
10/15/99Parametric StudiesThe accuracy and, therefore, the quality of CFD results depend upon the magnitude of thenumerical (i.e., those due to discretization and solution of the algebraic equations) and modeling(e.g., those due to turbulence modeling) errors. The numerical errors can be determined throughgrid studies and diagnosis of the iterative convergence history. This process is known as CFDverification. The modeling errors, on the other hand, can be determined through comparisonwith benchmark experimental fluid dynamics (EFD) data. This process is known as CFDvalidation.Because the numerical error is dependent upon the grid resolution, it is important that the gridcontain a suitable number of points, especially in regions of high gradients. For pipe flow, thegradients are largest near the pipe wall and rough estimates of the required resolution can berelated to the turbulent-flow length scale,y τ ρyUτ y wννTypically, the first grid point should be located at y 1. These calculations have already beenperformed for the turbulent flow through a pipe and have been incorporated into the grid designparameters which will be provided in class.In order to understand the effects that the number of grid points as well as grid spacing have onthe simulation; rerun the laminar case using a different number of points in the radial direction.It is preferable to perform one simulation with a greater number of points equal to two times thatof the current value, and one simulation with one half the number of points than that of theoriginal simulation. The technique of increasing and decreasing by a factor of two for each gridis called grid doubling. One generally starts with a coarse grid and doubles the number of pointsfor each following grid. By using this grid doubling technique one is able to assess theuncertainty of the simulation.-7-
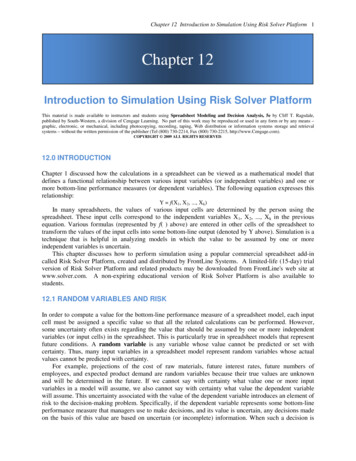
10/15/99Analysis and DiscussionTable 1: Data Comparison for Fully Developed Laminar 0.06430.06440.06580.064E S-D 014-Center LineVelocity (m/s)0.6090.6100.6090.6070.5940.611Velocity Profile ComparisonVelocity .010.0150.020.0250.03Radial Position (m)Figure 4: Laminar velocity profile comparison-8-
10/15/99Additional Fluent CommandsThe following section provides additional commands that may be helpful in per-lab as well as forlab 1.Saving a Fluent File FILE – WRITE – CASE & DATA Enter the file name .cas and click on OK.Saving a Graph/Plot in Fluent FILE – HARDCOPY If you will be printing this graph make sure that the postscript option is selected. Click on Save. Enter the file name .ps. This can be accessed and printed while in the directory in which it was saved.Saving numerical data in FluentThis option will be used when making graphs outside of Fluent (in Excel). PLOT – XY PLOT In the “Options” section choose write to file. Select the data that you would like to have saved in a data file from the “Y AxisFunction” section. Click on WRITE. Enter the file name .xls. OK.Defining turbulence models and near wall spacingThis step can be performed anytime during the grid generation after defining the pipe lengthand outer radius. This command determines which turbulence model will be used to solvethe problem and how the selected solver will treat the near wall points. DEFINE-MODELS (figure 5) To select the view the turbulence models available to the user, click on “ TurbulenceModel”. Forthe CFD labs, the K-Epsilon model will be used. One can view the different near wall treatments by clicking on the respective are. TheTwo-layerZonal Model will be implemented for lab #1.-9-
10/15/99Figure 5: Models menuCreating a non-uniform grid in FluentMany times it is necessary to have a very fine point distribution in one section of the grid inorder to improve accuracy of the calculations, as will be the case in lab one. You will berequired to create a non-uniform
predict fluid flow, heat and mass transfer, chemical reaction and related phenomena. Fluent’s software is used by engineers in corporations worldwide for product development, design optimization, troubleshooting and retrofitting. [1] With the use of Fluent and computational fluid dynamics (CFD) engineers are able to perform

![Fluent Python : [clear, concise, and effective programming]](/img/1/799981060.jpg)