Transcription
PocketBook
Equipment Life Expectancy FactorsA study by Dr. E Rabinowicz atM.I.T. observed that 70% ofcomponent replacements or'loss of usefulness' is dueto surface degradation.In hydraulic and lubricatingsystems, 20% of thesereplacements result fromcorrosion with 50% resultingfrom mechanical wear.LOSS OF USEFULNESSOBSOLESCENCE (15%)ACCIDENTS (15%)SURFACE DEGRADATION (70%)MECHANICAL WEAR (50%)CORROSION (20%)Presented at the American Societyof Lubrication Engineers,Bearing Workshop, 1981.ABRASIONFATIGUEADHESIONSources of ContaminationBuilt in contaminants fromcomponents: Cylinders, fluids, hydraulic motors,hoses and pipes, pumps, reservoirs,valves, etc.Generated contaminants: Assembly of systemOperation of systemBreak-in of systemFluid breakdownExternal ingression: Reservoir breathingCylinder rod sealsBearing sealsComponent sealsContaminants introducedduring maintenance: Disassembly/assembly Make-up oilThe Micrometre "µm"'Micron' micrometre µm1 micron 0.001 mm (0.000039 inch)10 micron 0.01 mm (0.0004 inch)Smallest dot you can see with thenaked eye 40 µmThickness of a sheet of looseleafnote paper 75 µmThe micrometre is the standard formeasuring particulate contaminants inlubricating and fluid power systems.Human hair (75 µm), particles (10 µm) at100x (14 µm/division)2
Relevant Filtration & Contamination StandardsISO 2941Filter elements - verification of collapse/burst pressure ratingISO 2942Filter elements - verification of fabrication integrity and determinationof the first bubble pointISO 2943Filter elements - verification of material compatibility with fluidsISO 3722Fluid sample containers - qualifying and controlling cleaning methodsISO 3724Filter elements - determination of resistance to flow fatigue usingparticulate contaminantISO 3968Filters - Evaluation of differential pressure versus flow characteristicsISO 4021Extraction of fluid samples from lines of an operating systemISO 4405Determination of particulate contamination level by the gravimetric methodISO 4406Method for coding the level of contamination by solid particlesISO 4407Determination of particulate contamination by the counting method usingan optical microscopeISO 10949Guidelines for achieving and controlling cleanliness of components frommanufacture to installationISO 11170Filter Elements - sequence of tests for verifying performance characteristicsISO 11171Calibration of automatic particle counters for liquidsISO 11500Determination of particulate contamination by automatic particle countingusing the light extinction principleISO 11943Methods for calibration and validation of on-line automaticparticle-counting systemsISO 16889Filter elements - Multi-pass method for evaluating filtration performanceof a filter elementISO 18413Component cleanliness - Inspection document and principles related tocontaminant collection, analysis and data reportingISO 23181Filter elements - determination of resistance to flow fatigue usinghigh viscosity fluidsSAE ARP4205Filter elements - method for evaluating dynamic efficiencywith cyclic flow3
Fluid Analysis Methods for ParticulateMethodUnitsBenefitsLimitationsOptical ParticleCountNumber/mLProvides sizedistribution.unaffected by fluidopacity, water andair in fluid sampleSamplepreparationtimeAutomatic ParticleCountNumber/mLFast andrepeatableSensitive to ‘silts’,water, air and gelsPatch testand fluidcontaminationcomparatorVisual comparison/cleanliness codeRapid analysis ofsystems fluidcleanliness levelsin field. Helps toidentify types elsFerrographyScaled number oflarge/smallparticlesProvides basicinformation onferrous andmagnetic particlesLow detectionefficiency on nonmagnetic particlese.g. brass, silicaSpectrometryPPMIdentifies andquantifiescontaminantmaterialCannot sizecontaminants;limited above 5 µmGravimetricmg/LIndicates totalmass ofcontaminantCannot distinguishparticle size.Not suitable formoderate to cleanfluids. i.e.ISO 18/16/134
Understanding the ISO Cleanliness CodeRange Code *20,00015,0002120Number Of Particles Greater Than Size Per 5.04.03.02.01.51.00.50.42515Microscope particle sizes, μm4614APC particle sizes, μm (c)20,00010,0005,0002,5001,300640Particle CountSummaryParticle countper mL greaterthan size codeISO 4406Rangecode4 µm(c) 430166 µm(c)901414 µm(c) 2212320160804020105(c) designates 'certifiedcalibration per ISO 11171,traceable to NIST2.51.3.6* Note: each increasein range numberrepresents adoubling of thecontamination level.The ISO code references the number of particles greater than 4, 6 and14 µm(c) in one millilitre of sample fluid.To determine the ISO Cleanliness code for a fluid, the results of particle counting are plottedon a graph. The corresponding range code, shown at the right of the graph, gives thecleanliness code number for each of the three particle sizes.5
ISO 4406 Cleanliness Code 13/12/10Sample Volume:100 mLMagnification:100xScale:1 division 10 µmParticle Count SummarySizeParticle CountRange per mLISO4406CodeNAS1638(SAEAS4059) 4 µm(c)40 - 80134 6 µm(c)20 - 40124 14 µm(c)5 - 10104Photo AnalysisVery little contamination is present.The visible particle is silica.ISO 4406 Cleanliness Code 15/14/12Sample Volume:100 mLMagnification:100xScale:1 division 10 µmParticle Count SummarySizeParticle CountRange per mLISO4406CodeNAS1638(SAEAS4059) 4 µm(c)160 - 320156 6 µm(c)80 - 160146 14 µm(c)20 - 40126Photo AnalysisLittle contamination is present.The visible contamination is silica.6
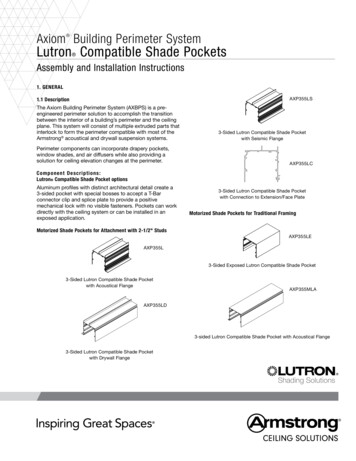
ISO 4406 Cleanliness Code 17/15/13Sample Volume:100 mLMagnification:100xScale:1 division 10 µmParticle Count SummarySizeParticle CountRange per mLISO4406CodeNAS1638(SAEAS4059) 4 µm(c)640 - 1,300177 6 µm(c)160 - 320157 14 µm(c)40 - 80137Photo AnalysisVery little contamination is present.The visible particle is black metal.ISO 4406 Cleanliness Code 20/17/15Sample Volume:100 mLMagnification:100xScale:1 division 10 µmParticle Count SummarySizeParticle CountRange per mLISO4406CodeNAS1638(SAEAS4059) 4 µm(c)5,000 - 10,0002010 6 µm(c)640 - 1,300179 14 µm(c)160 - 320159Photo AnalysisLittle contamination is present.The visible contamination is silica and black metal.7
ISO 4406 Cleanliness Code 20/19/16Sample Volume:100 mLMagnification:100xScale:1 division 10 µmParticle Count SummarySizeParticle CountRange per mLISO4406CodeNAS1638(SAEAS4059) 4 µm(c)5,000 - 10,0002011 6 µm(c)2,500 - 5,0001911 14 µm(c)640 - 1,3001611Photo AnalysisThe visible contamination is mainly silica withsome metallic and rust particles.ISO 4406 Cleanliness Code 21/20/18Sample Volume:100 mLMagnification:100xScale:1 division 10 µmParticle Count SummarySizeParticle CountRange per mLISO4406CodeNAS1638(SAEAS4059) 4 µm(c)10,000 - 20,0002112 6 µm(c)5,000 - 10,0002012 14 µm(c)1,300 - 2,5001812Photo AnalysisThe visible contamination is mainly silica withsome metallic and rust particles.8
Types of ContaminationSilicaHard, translucent particles often associated with atmosphericand environmental contamination, e.g., sand, dust.Bright MetalShiny metallic particles, usually silver or gold in colour,generated within the system. Generated contaminants areproducts of wear and often cause additional component wearand accelerated fluid breakdown.Black MetalOxidized ferrous metal inherent in most hydraulic andlubricating systems; built-in contaminant and genereatedwithin the system by wear.RustDull orange/brown particles often seen in oil from systemswhere water may be present, e.g., oil storage tanks.FibersContaminants most commonly generated from paper andfabrics, e.g., shop rags.Cake of FinesVery large concentrations of ‘silt’-size particles coat the analysismembrane and build-up into a cake. The cake obscures thelarger particles on the membrane making contaminationevaluation impossible.Magnification: 100xScale: 1 Division 10 µm9
Typical Dynamic (Operating) ClearancesComponentDetailsClearancesServo1 - 4 µmProportional1 - 6 µmDirectional2 - 8 µmPiston to Bore5 - 40 µmValve Plate to Cyl0.5 - 5 µmTip to Case0.5 - 1 µmSides to Case5 - 13 µmTooth Tip to Case0.5 - 5 µmTooth to Side Plate0.5 - 5 µmBall BearingsFilm Thickness0.1 - 0.7 µmRoller BearingsFilm Thickness0.4 - 1 µmJournal BearingsFilm Thickness0.5 - 125 µmSealsSeal and Shaft0.05 - 0.5 µmGearsMating Faces0.1 - 1 µmValvesVariable Volume Piston PumpsVane PumpsGear Pumps*Data from STLE Handbook onLubrication & Tribology (1994)To determine therecommended cleanlinesslevel for a component usethe 'Fluid Cleanliness LevelWorksheet' on page 27.“No system has ever failed from being too clean”10
Water Contamination in OilWater contamination in oil systems causes: Oil breakdown, such as additive precipitation and oil oxidationReduced lubricating film thicknessAccelerated metal surface fatigueCorrosionSources of water contamination: Heat exchanger leaksSeal leaksCondensation of humid airInadequate reservoir coversTemperature reduction causes dissolved water to turn into free waterWater Concentration (PPM)100Oil Temperature ( F)771220167Free Water15010050Dissolved Water002550Oil Temperature ( C)75Ref: EPRI CS-4555 Turbine oilTo minimise the harmful effects of free water, water concentration in oil should be keptas far below the oil saturation point as possible.10,000 PPM1%1,000 PPM0.1%100 PPM0.01%11
Operating Principle of Pall Fluid Conditioning PurifiersPrinciple: Mass transfer by evaporation under vacuumOutletexhaust airInletcontaminatedfluidVerythinfilmof oilVacuum:Expansionof air causesthe RelativeHumidity todecreaseDryairInletambient airPvacuum-0.7 barOutletdry fluidFreeWaterDissolvedWaterPall HNP006 Oil PurifierPall Fluid ConditioningPurifiers remove 100% offree water and entrainedgases, and up to 90% ofdissolved water and gasesTypical Applications Hydraulic oilsLubrication oilsDielectric fluidsPhosphate-estersQuenching fluids12
Water Content Analysis MethodsMethodUnitsBenefitsLimitationsCrackle TestNoneQuick indicator ofpresence of freewaterDoes not permitdetection belowsaturationChemical(Calcium hydride)Percentage or PPMA simplemeasurement ofwater contentNot very accurateon disolved waterDistillationPercentageRelatively unaffectedby oil additivesLimited accuracyon dry oilsFTIRPercentage or PPMQuick andinexpensiveAccuracy does notpermit detectionbelow 0.1% or1,000 PPMKarl FischerPercentage or PPMAccurate atdetecting lowlevels of water(10 - 1,000 PPM)Not suitable for highlevels of water.Can be affectedby additivesCapacitive Sensors(Water Sensors)Percentage ofsaturation or PPMVery accurate atdetecting dissolvedwater, 0 - 100% ofsaturation.Cannot measurewater levels abovesaturation (100%)WS04 Portable Water SensorWS08 In-line Water Sensor13
Monitoring and MeasurementObtaining accurate and reliable fluid cleanliness data quickly in order to detectabnormal contamination is a key factor in ensuring the efficiency of industrialprocesses and reducing downtime.Reliable Monitoring Solutions. .Whatever the Conditions.Whatever the FluidPCM400WPCM400W Portable Cleanliness MonitorProvides an assessment of system fluid cleanliness Proven multiple mesh blockage technology.Results not affected by water or air contamination.Designed for use with dark or cloudy fluids.ISO 4406, NAS 1638 or SAE AS4059 data output.PFC400WPFC400W Portable Particle CounterMeasures the size and quantity of particles in industrialsystem fluids Proven laser light blockage technology. Measures the size and quantity of particles inindustrial fluids. ISO 4406, NAS 1638 or SAE AS4059 data output.WS08Pall Water SensorThe next generation of in-line monitors for watercontamination in system fluids Measures dissolved water content as % ofsaturation(%sat) or PPM. Portable and in-line models.WS0414
Component Cleanliness MeasurementExtractionExtractionComponent Cleanliness Cabinets facilitate the accurate, reliableand repeatable determination of component cleanliness.All stainless steel cabinets feature: Controlled extraction environment Automated cleaning to ‘blank’ values Pressurised solvent dispensing andrecycling circuits. Meet ISO 18413, ISO 16232 andVDA 19 procedures.PCC030AnalysisAnalysisPCC041The Pall PCC 500 series cabinets combined extraction andanalysis using filter blockage measurement techniques whichare not affected by the presence of water or air in nationPCC500Microscopic AnalysisProcessOptimizationProcessOptimization Developing optimization Developing and validationof cleanliness standard Cleaner fluids Laboratory services15
Fluid Sampling ProcedureIntroductionThere are 4 methods for taking fluid samples. Method 1 is the best choice followed byMethod 2. Method 3 should only be used if there is no opportunity to take a line sample,and Method 4 should only be used if all others are impracticable.DO NOT obtain a sample from a reservoir drain valve. Always take the sample under thecleanest possible conditions, and use pre-cleaned sample bottles.If there are no line mounted samplers, fit a Pall sampling device to the Pall filter.Method 1Method 2Small ball valve with PTFE or similarseats, or a test pointValve of unknown contaminationshedding capabilities1. Operate the system for at least 30minutes prior to taking sample in orderto distribute the particulate evenly.1. Operate the system for at least 30minutes prior to taking sample in orderto distribute particulate evenly.2. Open the sampling valve and flush atleast 1 litre of fluid through the valve.Do not close the valve after flushing.2. Open the sampling valve and flush atleast 3 to 4 Litres of fluid through thevalve. (This is best accomplished byconnecting the outlet of the valve backto the reservoir by using flexible tubing).Do not close the valve.3. When opening the sample bottle, beextremely careful not to contaminate it.4. Half fill the bottle with system fluid,use this to rinse the inner surfaces andthen discard.5. Repeat step 4 a second time withoutclosing the valve.6. Collect sufficient fluid to fill 3/4 of bottle(to allow contents to be redistributed).7. Cap the sample immediately and thenclose the sample valve.Caution: Do not touch the valvewhile taking the sample.8. Label the sample bottle with systemdetails and enclose in a suitablecontainer for transport.3. Having flushed the valve, remove theflexible tubing from the valve with thevalve still open and fluid flowing.Remove the cap of the sample bottleand collect sample according toinstructions 4 to 6 of Method 1.4. Cap the sample immediately and thenclose the sample valve.Caution: Do not touch the valvewhile taking the sample.5. Label the sample bottle with systemdetails and enclose in a suitablecontainer for transport.16
Fluid Sampling Procedure(continued)Method 3Method 4Sampling from Reservoirs andBulk ContainersBottle DippingApplicable only if Methods 1 and 2cannot be usedLeast preferred method1. Operate the system for at least 30minutes prior to taking sample in orderto distribute the particles evenly.1. Operate the system for at least 30minutes prior to taking sample in orderto distribute particulate evenly.2. Clean the area of entry to the reservoirwhere sample will be obtained.2. Clean the area of entry to the reservoirwhere sample will be obtained.3. Flush the hose of the vacuumsampling device with filtered (0.8 µm)solvent to remove contamination thatmay be present.3. Ensure the outside of the bottle is cleanby flushing with filtered solvent.4. Attach a suitable sample bottle tothe sampling device, carefully insertthe hose into the reservoir so that itis mid-way into the fluid. Take carenot to scrape the hose against thesides of the tank or baffles within thetank as contamination may be suckedinto the hose.5. Pull the plunger on the body of thesampling device to produce vacuumand half fill the bottle.6. Unscrew bottle slightly to releasevacuum, allowing hose to drain.7. Flush the bottle by repeating steps 4 to6 two or three times.4. Remove cap from the sample bottle.Carefully fill the sample bottle bydipping it into the reservoir and thendiscard the fluid after rinsing the insideof the sample bottle.5. Repeat step 4.Carefully fill the sample bottle, capimmediately and wipe the outside.6. Secure any openings in the reservoir.Note: Incorrect sampling procedureswill adversely effect the cleanlinesslevel in the sample bottle.It is impossible to make a samplecleaner than the actual system butvery easy to make it dirtier.8. Collect sufficient fluid to 3/4 fill thesample bottle, release the vacuum andunscrew the sample bottle. Immediatelyrecap and label the sample bottle.17
Filter locationFlushing FilterAir breather To remove particles that have been built-into the system during assembly ormaintenance before start-up. To remove large particles that will causecatastrophic failures. To extend 'in-service' filter element life. To prevent ingression ofairborne particulate contamination. To extend filter element service life. To maintain system cleanliness.Pressure Line To stop pump wear debris from travellingthrough the system. To catch debris from a catastrophicpump failure and prevent secondarysystem damage. To act as a Last Chance Filter (LCF)and protect components directlydownstream of it.Return Line To capture debris from component wear oringression travelling to the reservoir. To promote general system cleanliness.Kidney loop/off-line To control system cleanliness whenpressure line flow diminishes(i.e. compensating pumps). For systems where pressure or returnfiltration is impractical. As a supplement to in-line filters to provideimproved cleanliness control and filterservice life in high dirt ingression systems.Additional filters should be placedahead of critical or sensitivecomponents To protect against catastrophic machinefailure (often non-bypass filters are used). To reduce wear To stabilize valve operation(prevents stiction).Pressureline filterReturnline filterFluidConditioningPurifierAirbreatherOil transferfilter cartKidneyloop/off-linefilter18
The Pall concept of Total Cleanliness Management in practiceWater SupplyPall MicrofiltrationsystemsPall ReverseOsmosisWaterClarificationPall AirBreathersPall Cross FlowFiltrationSystemsWaste DisposalPall DT Modulereverse osmosissystemsWash fluidCoolantBulk FluidStoragePall Ultipleat SRTOn-line filling filtrationPallMelt BlownFiltersParts WashingPall FluidManagementServicesMachining CentresSupplyInjectionMouldingCoolant CleanlinessPall Filters forthrough tool coolantMinimisedWasteDisposalPall Off-linefiltrationPressTest FacilityPall FluidConditioning PurifiersRemoval of water, gasesand solid contaminationComponentCleanlinessMeasurementPall CleanlinessCabinetsU N D E R S TA N D I N G T O TA L F L U I D M O V E M E N TPallPall CConditionondition MoMonitoringnitoring equipequipmentmentPall Ultipleat SRTFilters for hydraulicand lubricating oilsParticle CounterWater SensorRemaining Life IndicatorFluid CleanlinessMonitor20Pall Scientificand LaboratoryServices
Short Element Life ChecklistOLD APPLICATION ORNEW APPLICATIONNEWCHECK FILTERSIZINGClean ΔPtoo highINCREASE SURFACEAREAHAS ANYTHINGALTERED IN THESYSTEM?- Longer Bowl- Larger AssemblyOKCHECK SYSTEMCLEANLINESSOLDAboverequiredlevelSYSTEM CLEAN-UPOCCURRINGFaultyCHANGEINDICATOR-Recent maintenanceNew oil addedChange in oil typeChange in temperatureChange in flow rateOKCHECKINDICATORNOCHECK SYSTEMCLEANLINESS LEVELOKFIT ΔP GAUGE ANDVERIFY CLEAN ΔPHigherthanexpectedVERIFY SYSTEMSPECIFICATIONSPARTICULARLY OGRAPHICOKWATER CONTENTCHECK FLUIDCHEMISTRYVERY POSSIBLESYSTEM/COMPONENTPROBLEMSFILTERABILITY TESTON NEW ANDSYSTEM OILCHECK FOR GELSAND PRECIPITATESINSPECT SYSTEMFILTER ELEMENT-Other analysis testsWear debrisSEM/EDXCheck by-pass valve19
A revolutionary filter technology forhydraulic and lube applications Smaller sizeIncreased resistance to system stressesHigh flow capabilityImproved cleanliness controlIncreased equipment protectionMedia Substrate Support Layer(not shown): Provides support for themedia and aids in drainage flow.Benefit: Reliable, consistentperformanceF I L T R A T I O NProprietary CushionLayer: Provides supportfor the media andprotection fromhandling.Benefit: Reliable,consistent performanceO-ring Seal: Preventscontaminant bypassingthe filtration mediaunder normal operation.Benefit: Reliable,consistentfiltration performance.Proprietary OuterHelical Wrap: Tightlybonds to each pleat forstability and strength.Benefit: Reliable,consistent performanceand resistance tosevere operatingconditions.Up and DownstreamMesh Layers: Createflow channels foruniform flow throughthe filter.Benefit: Extendedelement life for loweroperating costs.Coreless/CagelessDesign: Outer elementcage is a permanentpart of the filter housingSRT Media: Inert,inorganic fiberssecurely bonded in afixed, tapered porestructure withincreased resistanceto system stressessuch as cyclic flowand dirt loading.Benefit: Lighter,environmentally friendlyelement for reduceddisposal costs and easeof element change-out.Benefit: Improvedperformance over thelife of the filter andmore consistent fluidcleanliness.Auto-Pull ElementRemoval Tabs:Corrosion-resistantendcaps featureexclusive Auto-Pulltabs for automaticelement extractionupon opening thehousing.Benefit: Ease ofelement change-out.21
Pall Ultipleat SRT Filter Performance DataUltipleat SRTGradeCleanliness Code Rating (ISO 4406)based on SAE ARP 5/0810,000APMulti-PassFilter Rating(ISO 16889)Filtration Ratio (ß)AZASANAT1,00010010102468 10 12 14 16 18 20 22 24 26Particle Size (µm(c))Traditional Fan-Pleat FilterPall Ultipleat SRTThe optimized fan-pleat geometry of SRT filtration provides: Uniform flow distribution and increased capacity Maximum filter surface area and element life22
Other series or configurations available, consult Pall for further details.Pall Ultipleat SRT Housing RangeHigh Pressure urn Line SeriesUR319UR209Port Sizes(inches)Length(inches)2093/4,2191, 11/44, 8, 13, 2023911/4, 11/28, 13, 2031911/4, 11/2, 28, 13, 20, 4013, 7URSeriesFlow RatePressure RatingL/minUSgpm 8400URSeriesUR619Flow RatePressure RatingL/minUSgpm barpsiPort Sizes(inches)Length(inches)2093/4,13, 72193/4,1, 11/44, 8, 13, 2031911/2, 2, 21/28, 13, 20, 4061911/2, 2, 21/220, 40629/493, 420, 406992, 21/2, 320, 4023
Pall Ultipleat SRT Housing Range(continued)In-Tank SeriesUTSeries279319UTSeriesUT319Auto-Pull tabon filter elementFlow RatePressure RatingL/minUSgpm barpsi130760351015020010150Port Sizes(inches)Length(inches)2793/4,4, 8, 13, 2031911/2, 2, 21/21, 11/48, 13, 20, 40UT279Auto-Pulltab on filterhousing coverAuto-Pull ElementRemoval MechanismUltipleat SRT filter assemblies featurePall’s unique Auto-Pull element removalmechanism, allowing easy elementremoval from the filter housing.When the cover or tube (depending onassembly design) is unscrewed from thehousing, tabs on the filter element endcapsfit into hooks in the housing. Thus, as thecover or tube is unscrewed, the elementis automatically pulled from the tube.This eliminates the need to reach into thetube to grab an endcap or handle andmanually pull out the element.24
Pall Ultipleat SRT Filter Part NumberingHousings:UH 219C G20 AP 08 Z G PP Indicator(standard options)UH Ultipleat high pressure housingUR Ultipleat return housingUT Ultipleat in-Tank housingG Bypass Valve(standard options)2 2" diameter element3 3" diameter element6 6" diameter elementZ Fluorocarbon Seals2 Duplex: 2 housing total4 Duplex: 4 housing total6 Duplex: 6 housing total8 Duplex: 8 housing totalOther Simplex: 1 housing08 Element Length(standard options)9 In-to-out flow, 10 bar collapseC Cap service (bowl up)H Head service (bowl down)UE Ultipleat elementElements:AP Media Grade(standard options)G Port style (standard options)20 Port size (standard options)UE 219 AP 08 Z25
Melt Blown Filter TechnologyRecommended for industrial applications to treat water, fuels, aqueoussolutions and low viscosity process fluids.Melt Blown Technology12The term 'Melt blown' means the filter hasbeen manufactured using a computer controlledprocess where fibers are collected to producein a graded pore structure about amoulded core.Different media configurations are suitedto different applications and specific userrequirements. The Pall Melt Blown filterelement range is available in depth, fanpleated and patented laid over pleat(Ultipleat) designs.31 Depth Filter2 Fan pleat geometry3 Laid-over pleat geometryRecognizing that different applications have different fluidcleanliness and filtration requirements, the Pall range of MeltBlown filter products are simply defined to help you choosethe best solution at the most economic dRange (µm)Highly Critical99.98%1, 3, 6, 12, 20Critical to General99.9%40, 70, 90General90%100, 150, 200A wide range of filter housingsare also available.26
Recommended Fluid Cleanliness Level Worksheet*Selection of the appropriate cleanliness level should be based upon careful considerationof the operational and environmental conditions. By working through this list of individualparameters, a total weighting can be obtained which when plotted on the graph on page 27,provides a Recommended Cleanliness Level (RCL).Table 1. Operating Pressure and Duty CycleDutyLightMediumHeavySevereExamplesOperating Pressure (bar (psi))Steady dutyModerate pressurevariationsZero to full pressureZero to full pressure withhigh frequency transientsActual0-70(0-1000) 70-170 170-275 275-410 410( 1000-2500) ( 2500-4000) ( 4000-6000) ( 6000)11234234563456745678Table 2. Component SensitivitySensitivityMinimalBelow averageAverageAbove averageHighVery highExamplesRam pumpsLow performance gear pumps, manual valves, poppet valvesVane pumps, spool valves, high performance gear pumpsPiston pumps, proportional valvesServo valves, high pressure proportional valvesHigh performance servo ighting123ActualTable 3. Equipment Life ExpectancyLife Expectancy 20,000-40,000 40,000Table 4. Component Replacement CostReplacement CostLowAverageHighVery highExamplesManifold mounted valves, inexpensive pumpsLine mounted valves and modular valvesCylinders, proportional valvesLarge piston pumps, hydrostatic transmission motors,high performance servo components4Table 5. Equipment Downtime CostDowntime CostLowAverageHighVery highExamplesEquipment not critical to production or operationSmall to medium production plantHigh volume production plantVery expensive downtime costWeighting1246ActualExamplesNo liabilityFailure may cause hazardFailure may cause injuryWeighting136ActualTable 6. Safety LiabilitySafety LiabilityLowAverageHigh* Adapted from BFPA/P5 Target Cleanliness Level Selector 1999 Issue 3.27
Table 7. Cleanliness Requirement TotalCleanliness Requirement Total WeightingTotalSum of 'Actual' weighting from sections 1 through 6Using the chart below, determine where the 'Cleanliness Requirement Total Weighting' number from Table 7intersects the red line. Follow across to the left to find the recommended ISO 4406 Code.Table 8. Environmental WeightingEnvironmentExamplesGoodClean areas, few ingression points, filtered fluid filling, airbreathersGeneral machine shops, some control over ingression pointsMinimal control over operating environment and ingressionpoints e.g. on-highway mobile equipment)Potentially high ingression (e.g. foundries, concrete mfg.,component test rigs, off-highway mobile equipment)FairPoorHostileWeightingSingle MultipleFilterFilters0-1103254Actual* Single filter or multiple filters with the same media grade on the system.Table 9. Required Filtration LevelFiltration Requirement Total WeightingAdd Environmental Weighting (Table 8) to Cleanliness Requirement Total (Table 7)TotalUsing the chart below, determine where the 'Required Filtration Level' total in Table 9 intersects the red line.Follow across to the right to find the corresponding recommended Pall filter grade.20/18/1519/17/1418/16/13AS17/15/12ISO 4406 110 11 12 13 14 15 16 17 18 19 20 21 22 23 24 25 26 27 28 29 30 31 32†WeightingUsing on-line particle counting28
Viscosity ConversionsKinematic 0Saybolt UniversalSeconds (SUS)40 C (104 F)100 C (212 693318662798To Convert toatMultiply cSt at sametemperature bySUSSUSRedwood N 1Engler40 C (104 F)100 C (212 F)60 C (140 F)All temperatures4.634.664.10.13µ ñ Kinematic viscosity of fluid in cSt (mm2/s)µ Dynamic viscosity of fluid in cP (Pa.s)ñ Density of fluid (kg/m3)29
Common Fluid Power Circuit Diagram SymbolsISO1219-1: Fluid power systems and components - Graphic symbols and circuit diagrams Part 1: Graphic symbols for conventional use and data processing applications.Cylinders & Semi-rotary ActuatorsDirectional Control Valve LeverElectro-Hydraulic(Pilot) OperationFootPedalPalmButtonPressure Control ValvesDouble ActingCylinderBi-directionalSemi-rotary ActuatorCylinder withAdjustable CushioningSingle ActingTelescopic CylinderPumps & MotorsDirect OperatedRelief ValvePilot OperatedRelief ValveDirect OperatedReducing ValveDirect Operated3 Way Reducing ValveIsolation & Flow Control ValvesFixed Displacement PumpUni-directional FlowBi-directio
The visible contamination is silica and black metal. Sample Volume: 100 mL Magnification: 100x Scale: 1 division 10 µm Particle Count Summary Size Particle Count ISO NAS1638 Range per mL 4406 (SAE Code AS4059) 4 µm(c) 640 - 1,300 17 7 6 µm(c) 160 - 320 15 7 14 µm(c) 40 - 80 13 7 Photo Analysis Very little contamination is present.