Transcription
Chapter 12 Introduction to Simulation Using Risk Solver Platform 1Chapter 12Introduction to Simulation Using Risk Solver PlatformThis material is made available to instructors and students using Spreadsheet Modeling and Decision Analysis, 5e by Cliff T. Ragsdale,published by South-Western, a division of Cengage Learning. No part of this work may be reproduced or used in any form or by any means –graphic, electronic, or mechanical, including photocopying, recording, taping, Web distribution or information systems storage and retrievalsystems – without the written permission of the publisher (Tel (800) 730-2214, Fax (800) 730-2215, http://www.Cengage.com).COPYRIGHT 2009 ALL RIGHTS RESERVED.12.0 INTRODUCTIONChapter 1 discussed how the calculations in a spreadsheet can be viewed as a mathematical model thatdefines a functional relationship between various input variables (or independent variables) and one ormore bottom-line performance measures (or dependent variables). The following equation expresses thisrelationship:Y f(X1, X2, ., Xk)In many spreadsheets, the values of various input cells are determined by the person using thespreadsheet. These input cells correspond to the independent variables X1, X2, ., Xk in the previousequation. Various formulas (represented by f( ) above) are entered in other cells of the spreadsheet totransform the values of the input cells into some bottom-line output (denoted by Y above). Simulation is atechnique that is helpful in analyzing models in which the value to be assumed by one or moreindependent variables is uncertain.This chapter discusses how to perform simulation using a popular commercial spreadsheet add-incalled Risk Solver Platform, created and distributed by FrontLine Systems. A limited-life (15-day) trialversion of Risk Solver Platform and related products may be downloaded from FrontLine's web site atwww.solver.com. A non-expiring educational version of Risk Solver Platform is also available tostudents.12.1 RANDOM VARIABLES AND RISKIn order to compute a value for the bottom-line performance measure of a spreadsheet model, each inputcell must be assigned a specific value so that all the related calculations can be performed. However,some uncertainty often exists regarding the value that should be assumed by one or more independentvariables (or input cells) in the spreadsheet. This is particularly true in spreadsheet models that representfuture conditions. A random variable is any variable whose value cannot be predicted or set withcertainty. Thus, many input variables in a spreadsheet model represent random variables whose actualvalues cannot be predicted with certainty.For example, projections of the cost of raw materials, future interest rates, future numbers ofemployees, and expected product demand are random variables because their true values are unknownand will be determined in the future. If we cannot say with certainty what value one or more inputvariables in a model will assume, we also cannot say with certainty what value the dependent variablewill assume. This uncertainty associated with the value of the dependent variable introduces an element ofrisk to the decision-making problem. Specifically, if the dependent variable represents some bottom-lineperformance measure that managers use to make decisions, and its value is uncertain, any decisions madeon the basis of this value are based on uncertain (or incomplete) information. When such a decision is
Chapter 12 Introduction to Simulation Using Risk Solver Platform2made, some chance exists that the decision will not produce the intended results. This chance, oruncertainty, represents an element of risk in the decision-making problem.The term “risk” also implies the potential for loss. The fact that a decision’s outcome is uncertaindoes not mean that the decision is particularly risky. For example, whenever we put money into a softdrink machine, there is a chance the machine will take our money and not deliver the product. However,most of us would not consider this risk to be particularly great. From past experience, we know that thechance of not receiving the product is small. But even if the machine takes our money and does notdeliver the product, most of us would not consider this to be a tremendous loss. Thus, the amount of riskinvolved in a given decision-making situation is a function of the uncertainty in the outcome of thedecision and the magnitude of the potential loss. A proper assessment of the risk present in a decisionmaking situation should address both of these issues, as the examples in this chapter will demonstrate.12.2 WHY ANALYZE RISK?Many spreadsheets built by business people contain estimated values for the uncertain input variables intheir models. If a manager cannot say with certainty what value a particular cell in a spreadsheet willassume, this cell most likely represents a random variable. Ordinarily, the manager will attempt to makean informed guess about the values such cells will assume. The manager hopes that inserting theexpected, or most likely, values for all the uncertain cells in a spreadsheet will provide the most likelyvalue for the cell containing the bottom-line performance measure (Y). The problem with this type ofanalysis is that it tells the decision maker nothing about the variability of the performance measure.For example, in analyzing a particular investment opportunity, we might determine that the expectedreturn on a 1,000 investment is 10,000 within two years. But how much variability exists in thepossible outcomes? If all the potential outcomes are scattered closely around 10,000 (say from 9,000 to 11,000), then the investment opportunity might still be attractive. If, on the other hand, the potentialoutcomes are scattered widely around 10,000 (say from – 30,000 up to 50,000), then the investmentopportunity might be unattractive. Although these two scenarios might have the same expected or averagevalue, the risks involved are quite different. Thus, even if we can determine the expected outcome of adecision using a spreadsheet, it is just as important, if not more so, to consider the risk involved in thedecision.12.3 METHODS OF RISK ANALYSISSeveral techniques are available to help managers analyze risk. Three of the most common are bestcase/worst-case analysis, what-if analysis, and simulation. Of these methods, simulation is the mostpowerful and, therefore, is the technique that we will focus on in this chapter. Although the othertechniques might not be completely effective in risk analysis, they are probably used more often thansimulation by most managers in business today. This is largely due to the fact that most managers areunaware of the spreadsheet’s ability to perform simulation and of the benefits provided by this technique.So before discussing simulation, let’s first briefly look at the other methods of risk analysis to understandtheir strengths and weaknesses.12.3.1 Best-Case/Worst-Case AnalysisIf we don’t know what value a particular cell in a spreadsheet will assume, we could enter a number thatwe think is the most likely value for the uncertain cell. If we enter such numbers for all the uncertain cellsin the spreadsheet, we can easily calculate the most likely value of the bottom-line performance measure.This is also called the base-case scenario. However, this scenario gives us no information about how faraway the actual outcome might be from this expected, or most likely, value.One simple solution to this problem is to calculate the value of the bottom-line performance measureusing the best-case, or most optimistic, and worst-case, or most pessimistic, values for the uncertaininput cells. These additional scenarios show the range of possible values that might be assumed by the
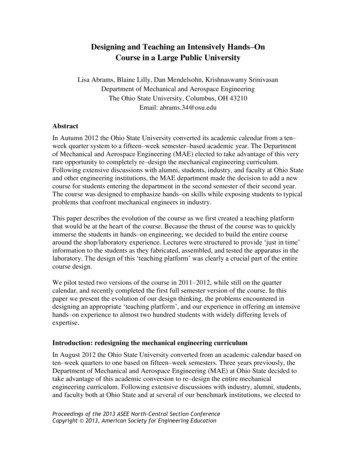
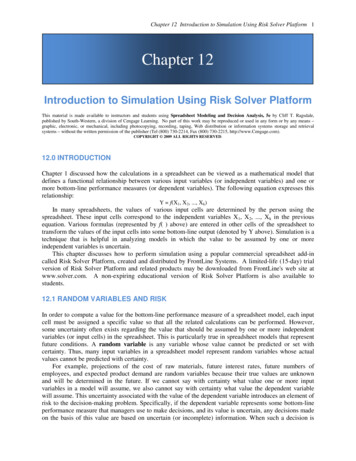
Chapter 12 Introduction to Simulation Using Risk Solver Platform3bottom-line performance measure. As indicated in the earlier example about the 1,000 investment,knowing the range of possible outcomes is very helpful in assessing the risk involved in differentalternatives. However, simply knowing the best-case and worst-case outcomes tells us nothing about thedistribution of possible values within this range, nor does it tell us the probability of either scenariooccurring.Figure 12.1 displays several probability distributions that might be associated with the value of abottom-line performance measure within a given range. Each of these distributions describes variablesthat have identical ranges and similar average values. But each distribution is very different in terms ofthe risk it represents to the decision maker. The appeal of best-case/worst-case analysis is that it is easy todo. Its weakness is that it tells us nothing about the shape of the distribution associated with the bottomline performance measure. As we will see later, knowing the shape of the distribution of the bottom-lineperformance measure can be critically important in helping us answer a number of managerial questions.Worst caseBest caseWorst caseBest caseWorst caseWorst caseBest caseBest casePossible distributions of performance measure values within a given range.Figure 12.112.3.2 What-If AnalysisPrior to the introduction of electronic spreadsheets in the early 1980s, the use of best-case/worst-caseanalysis was often the only feasible way for a manager to analyze the risk associated with a decision. Thisprocess was extremely time-consuming, error prone, and tedious, using only a piece of paper, pencil, andcalculator to recalculate the performance measure of a model using different values for the uncertaininputs. The arrival of personal computers and electronic spreadsheets made it much easier for a managerto play out a large number of scenarios in addition to the best and worst cases—which is the essence ofwhat-if analysis.In what-if analysis, a manager changes the values of the uncertain input variables to see whathappens to the bottom-line performance measure. By making a series of such changes, a manager cangain some insight into how sensitive the performance measure is to changes to the input variables.Although many managers perform this type of manual what-if analysis, it has three major flaws.
Chapter 12 Introduction to Simulation Using Risk Solver Platform4First, if the values selected for the independent variables are based only on the manager’s judgment,the resulting sample values of the performance measure are likely to be biased. That is, if severaluncertain variables can each assume some range of values, it would be difficult to ensure that the managertests a fair, or representative, sample of all possible combinations of these values. To select values for theuncertain variables that correctly reflect their random variations, the values must be randomly selectedfrom a distribution, or pool, of values that reflects the appropriate range of possible values, as well as theappropriate relative frequencies of these variables.Second, hundreds or thousands of what-if scenarios might be required to create a valid representationof the underlying variability in the bottom-line performance measure. No one would want to performthese scenarios manually nor would anyone be able to make sense of the resulting stream of numbers thatwould flash on the screen.The third problem with what-if analysis is that the insight the manager might gain from playing outvarious scenarios is of little value when recommending a decision to top management. What-if analysissimply does not supply the manager with the tangible evidence (facts and figures) needed to justify why agiven decision was made or recommended. Additionally, what-if analysis does not address the problemidentified in our earlier discussion of best-case/worst-case analysis—it does not allow us to estimate thedistribution of the performance measure in a formal enough manner. Thus, what-if analysis is a step in theright direction, but it is not quite a large enough step to allow managers to analyze risk effectively in thedecisions they face.12.3.3 SimulationSimulation is a technique that measures and describes various characteristics of the bottom-lineperformance measure of a model when one or more values for the independent variables are uncertain. Ifany independent variables in a model are random variables, the dependent variable (Y) also represents arandom variable. The objective in simulation is to describe the distribution and characteristics of thepossible values of the bottom-line performance measure Y, given the possible values and behavior of theindependent variables X1, X2, ., Xk.The idea behind simulation is similar to the notion of playing out many what-if scenarios. Thedifference is that the process of assigning values to the cells in the spreadsheet that represent randomvariables is automated so that: (1) the values are assigned in a non-biased way, and (2) the spreadsheetuser is relieved of the burden of determining these values. With simulation, we repeatedly and randomlygenerate sample values for each uncertain input variable (X1, X2, ., Xk) in our model and then computethe resulting value of our bottom-line performance measure (Y). We can then use the sample values of Yto estimate the true distribution and other characteristics of the performance measure Y. For example, wecan use the sample observations to construct a frequency distribution of the performance measure, toestimate the range of values over which the performance measure might vary, to estimate its mean andvariance, and to estimate the probability that the actual value of the performance measure will be greaterthan (or less than) a particular value. All these measures provide greater insight into the risk associatedwith a given decision than a single value calculated based on the expected values for the uncertainindependent variables.On Uncertainty and Decision-Making "Uncertainty is the most difficult thing about decision-making. In the face of uncertainty, some peo
Chapter 12 Introduction to Simulation Using Risk Solver Platform 2 made, some chance exists that the decision will not produce the intended results. This chance, or uncertainty, represents an element of risk in the decision-making problem. The term “risk” also implies the potential for loss. The fact that a decision’s outcome is uncertain