Transcription
RESEARCH THAT MATTERSLGBT POVERTY INTHE UNITED STATESA study of differencesbetween sexualorientation andgender identitygroupsOctober 2019M. V. Lee BadgettSoon Kyu ChoiBianca D.M. Wilson
LGBT Poverty in the United States 1TABLE OF CONTENTSEXECUTIVE SUMMARY. 2MAIN FINDINGS. 2INTRODUCTION. 5FINDINGS. 7POVERTY RATES DIFFER BY SEXUAL ORIENTATION AND GENDER IDENTITY. 7Geography and LGBT status. 8Race, ethnicity, and LGBT status. 12AGE AND LGBT STATUS. 14LGBT AND CIS-STRAIGHT PEOPLE DIFFER IN WAYS THAT AFFECT THE LIKELIHOOD OF POVERTY. 17LGBT PEOPLE ARE MORE LIKELY TO EXPERIENCE POVERTY AFTER ACCOUNTING FOR OTHER KNOWN FACTORS. 24FUTURE RESEARCH SUGGESTIONS.26CONCLUSION. 27AUTHORS . 28ACKNOWLEDGEMENTS. 28SUGGESTED CITATION. 29APPENDIX: METHODS. 30DATA SOURCE. 30SAMPLE. 30Sexual Orientation and Gender Identity Measure in Module. 31MEASURES. 33Sexual orientation and gender identity. 33Poverty. 34Covariates. 34WEIGHTS. 35ANALYTIC APPROACH. 35DETAILED FINDINGS FROM MULTIVARIATE ANALYSES. 36SUPPLEMENTAL TABLES. 39REFERENCES. 45
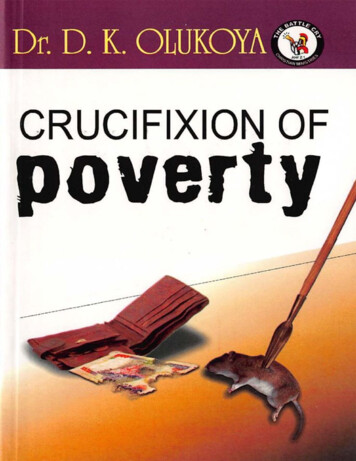
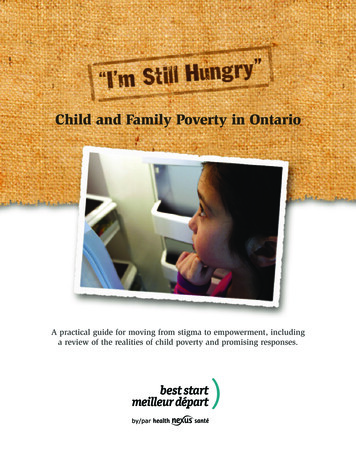
LGBT Poverty in the United States 2EXECUTIVE SUMMARYAlthough prior research has documented rates of poverty among lesbian, gay, bisexual, andtransgender (LGBT) people and shown evidence of economic disparities for LGBT people, moststudies on the topic have not been able to fully describe the entire LGBT community across theUnited States. Many past studies used data that do not allow for identification of transgender peopleor people not living in same-sex couples. This study, which is the first in a series of reports basedon the Pathways to Justice Project, addresses earlier shortcomings of the research on poverty toprovide a new lens on one of the most important measures of economic security—living on very lowincomes. In particular, this new research on LGBT poverty comes from the Behavioral Risk FactorSurveillance System (BRFSS) survey, which has asked questions about sexual orientation and genderidentity (SOGI) since 2014. This report covers self-identified lesbians, gay men, bisexual people, andtransgender people (of various sexual orientations) in 35 states from 2014 to 2017. The focus of thefull report is answering the following questions about LGBT poverty:1. Do poverty rates differ by SOGI? How do these differences look across various demographiccharacteristics?2. Do LGBT and cisgender (cis) straight people differ in ways that affect poverty?3. Accounting for other known factors related to poverty, do LGBT people still experience higherrates of poverty compared to cisgender straight people?MAIN FINDINGS Poverty rates differ by SOGI. We examined poverty rates separately for cisgender straight menand women, cisgender gay men and lesbian women, cisgender bisexual men and women, andtransgender people.{{{{LGBT people collectively have a poverty rate of 21.6%, which is much higher than the ratefor cisgender straight people of 15.7%.Among LGBT people, transgender people have especially high rates of poverty—29.4%.Lesbian (17.9%) and straight (17.8%) cisgender women have higher poverty rates than gay(12.1%) and straight (13.4%) cisgender men. But cisgender lesbian women do not havesignificantly different poverty rates than cisgender straight women.Bisexual cisgender women (29.4%) and men (19.5%) had higher poverty rates thancisgender straight women and men, respectively.
LGBT Poverty in the United States 329.4%29.4%CIS-BISEXUALWOMEN (N 5,481TRANSGENDER(N 744)19.5%12.1%CIS-GAY MEN(N 5,119)17.8%17.9%CIS-STRAIGHTWOMEN(N 313,753)CIS-LESBIANWOMEN (N 3,532)13.4%CIS-STRAIGHTMEN (N 244,008)CIS-BISEXUALMEN (N 3,193)Poverty was also particularly high at the intersection of racial and SOGI minority statuses. Black, White, Asian, and other-race LGBT people have statistically significant higherpoverty rates than their same-race cisgender straight counterparts. For example,30.8% of Black LGBT people live in poverty, whereas 25.3% of Black cisgender straightpeople live in poverty. The patterns of racial disparities in poverty rates were similar for both LGBT andcisgender straight people. That is, for nearly all SOGI groups, people of color hadsignificantly higher poverty rates than White people.{LGBT people in rural areas (26.1%) have the highest poverty rates, compared to LGBTpeople in urban areas (21.0%) and cisgender straight people in either rural (15.9%) orurban (15.5%) areas. LGBT and cisgender straight people differ in ways that affect the likelihood of poverty.{Several characteristics known to be related to poverty are more common among LGBTpeople. LGBT people, particularly bisexual and transgender people, are more likely to be: people of color, young, and experiencing a disability.{However, some LGBT groups have higher levels of education, live in urban areas, and havefewer children (namely, gay cisgender men), all factors that protect them from poverty. Once factors such as race, age, location, education, disability, language marital status,employment, health, and children are taken into account, we find that LGBT people are still morelikely to experience poverty than their cisgender straight counterparts.
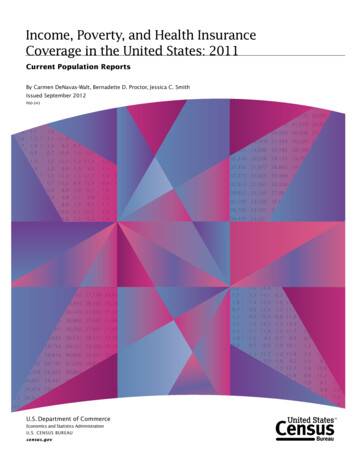
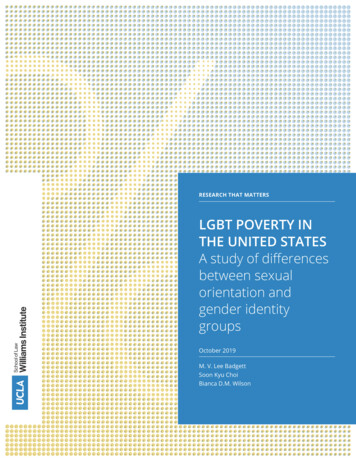
LGBT Poverty in the United States 4{Beyond the poverty-related factors that are more common among LGBT people suchas those previously listed, LGBT people as a group had higher odds of being poor thancisgender straight people—17% higher odds compared to cisgender straight women and15% higher compared to cisgender straight men. The chart below shows these differences,but the bars in light blue show differences that are not statistically significant. However, compared to cisgender straight women, bisexual cisgender women andtransgender people drove this economic disparity. Lesbians were neither more norless likely to be poor than cisgender straight women. Once accounting for the effect of other factors, bisexual cisgender men no longer hadsignificantly lower poverty rates compared to cisgender straight men, but transgenderpeople remained more likely to experience poverty. Gay cisgender men were just aslikely to be poor as cisgender straight men (the difference in likelihood was notsignificantly different for gay and straight cisgender men).Compared to cis-straight womenCompared to cis-straight men70%38%17%17%15%5%-1%-7%LGBTTRANSGENDERPEOPLECIS BISEXUALWOMENCIS LESBIANLGBTTRANSGENDERPEOPLECIS BISEXUALMENCIS GAY MENTaken together, this report extends our knowledge of LGBT poverty. Using a new dataset with moredetailed measures of SOGI and a much larger sample size than previous studies reveals importantdifferences in the collective group of LGBT people.
LGBT Poverty in the United States 5INTRODUCTIONOver time, evidence has grown showing that lesbian, gay, bisexual, and transgender (LGBT) peopleface significant economic disparities compared with cisgender (cis) heterosexuala people. Povertyrates are at least as high for LGBT people as for the general population, and certain subgroups ofthe LGBT community are more likely to be poor than the general population, particularly bisexualpeople and transgender people.1-5 Studies have shown that high proportions of LGBT adults face foodinsecurity.6 Young LGBT people have high rates of involvement in the foster care system, which is apredictor of future economic insecurity,7-9 and they represent a disproportionately high proportionof young people experiencing homelessness in some cities10-12 and incarceration.13 In the LGBTcommunity, people of color appear to be particularly vulnerable to poverty and other indicators ofeconomic insecurity.4,10,14So far, however, research on economic insecurity has not been able to fully describe the low-incomepopulation of the LGBT community. Many past studies used data that do not allow for identificationof transgender people or people not living in couples. Also, small samples of LGBT people make itdifficult to investigate economic insecurity in individual states or rural areas. Further, although it isuseful to examine how LGBT communities are faring as a whole, it is also important that we build onprior work to provide specific information that distinguishes economic outcomes among subgroups ofthe LGBT community.This study expands on existing research to provide a new lens on one of the most importantmeasures of economic security—poverty or living on very low incomes. It is the first report in a seriescompleted as part of the Pathways to Justice Project, a multimethod long-term project examiningpoverty rates, exploring life narratives, and documenting experiences with economic developmentservices among LGBT people.This first report extends our knowledge of how sexual orientation and gender identity (SOGI) affectthe likelihood that an individual will experience poverty using a national dataset, the Behavioral RiskFactor Surveillance System (BRFSS) survey. This report covers self-identified lesbians, gay men, andbisexual people (n 20,926, 3.7% weighted in aggregate dataset) and transgender people (of varioussexual orientations; n 3,037, 0.5% weighted in aggregate dataset) in 35 states from 2014 to 2017. Inaddition, we provide estimates of LGBT poverty in rural and urban areas.a We use “cisgender straight” or “cisgender heterosexual” interchangeably in this report and in tables for readability.
LGBT Poverty in the United States 6Throughout this report, we provide the key findings of analyses we conducted to answer majorquestions about LGBT poverty:1. Do poverty rates differ by SOGI? How do these differences look across various demographiccharacteristics?2. Do LGBT and cisgender straight people differ in ways that affect the risk of poverty?3. Accounting for other known factors related to poverty, do LGBT people still experience a higherrisk of poverty?Our analysis accounted for the effects of age, race, urbanicity, language, and disability, as well as forthe effects of education, marital status, employment status, and health on poverty. We selected thesefactors because they are linked to poverty, both as causes and effects. Testing whether SOGI arerelated to poverty beyond those characteristics sheds additional light on poverty dynamics.Throughout the initial sections of the paper, we provide detailed information on LGBT people as awhole and the multiple subgroups represented. Details regarding the study methods and statisticalanalyses, such as what measures were used to define poverty and identify respondents’ SOGI, areexplained at the end of this report in an appendix. Box 1 provides an explanation of the standarddefinition of poverty in the United States, which compares a household’s income to the povertythreshold defined by the federal government.How We Define PovertyIn the United States, an individual is considered to be experiencing poverty if their family income falls belowthe official federal poverty threshold. The thresholds are set each year for different sizes of households. In2015, for example, a family of two adults and one child would be considered living in poverty if their annualincome fell below 19,078. See the appendix for further details.
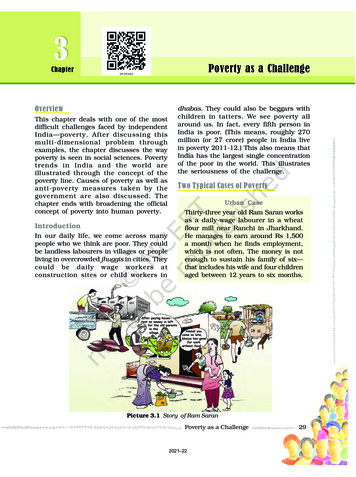
LGBT Poverty in the United States 7FINDINGSPOVERTY RATES DIFFER BY SEXUAL ORIENTATION AND GENDERIDENTITYAt a very general level, we can see that SOGI affects the likelihood that someone is poor, becausemore LGBT people (21.6%) than straight cisgender people (15.7%) are living in poverty (see Figure 1).Figure 1. Poverty rates comparing LGBT andcisgender straight adults21.6%In addition to assessing poverty rates betweenLGBT and non-LGBT people, a major aim ofthis study was to understand the differencesin poverty among LGBT people. Figure 2 showsthe poverty rates for seven different gender–sexual orientation combinations. We seethat cisgender straight (13.4%) and gay men(12.1%) have similar rates of poverty, and theirpoverty rates are lower than every other group.Cisgender lesbians (17.9%) have similar rates ofpoverty to cisgender straight women (17.8%),and both groups have significantly higher ratesof poverty compared to cisgender gay andLGBTCIS-STRAIGHT(N 19,786)(N 557,817)straight men. Compared to cisgender straightand lesbian women, bisexual women and transgender people have higher poverty rates, at 29.4% forboth groups. Similarly, compared to cisgender straight and gay men, transgender people and bisexualmen have higher poverty rates, although bisexual men’s rate is 19.5%, compared to 29.4% for alltransgender people. This difference between bisexual men and transgender people is statisticallysignificant.15.7%For descriptive purposes, we provide poverty rates on gender subgroups of transgender people (seeTable 1). Those who identified as transgender men have the highest poverty rate (33.7%), followed bytransgender women (29.6%) and gender nonconforming people (23.8%); however, these differencesare not statistically significant. Because a transgender gender experience has been shown to be aunique and significant factor in economic, health, and experienced discrimination,15-17 we comparedtransgender people as one group to the other gender and sexual orientation subgroups in Figure 2and in all other analyses in this report. We made this decision because the sample size of transgenderpeople is relatively small, making comparisons difficult if we were to divide transgender people intotheir different gender identities, and it avoids untested assumptions about whether experiencesrelated to economic insecurity compared to cisgender men and women need to be framed in terms ofsex assigned at birth or current gender identity.
LGBT Poverty in the United States 8Figure 2. Poverty rates by sexual orientation and gender identityb29.4%29.4%CIS-BISEXUALWOMEN (N 5,481TRANSGENDER(N 744)19.5%17.9%CIS-STRAIGHTWOMEN(N 313,753)CIS-LESBIANWOMEN (N 3,532)13.4%12.1%CIS-GAY MEN(N 5,119)17.8%CIS-STRAIGHTMEN (N 244,008)CIS-BISEXUALMEN (N 1,193)Table 1. Poverty rates in the transgender populationTRANSGENDER PEOPLE%NTransgender men33.7172Transgender women29.6242Gender nonconforming23.8109In the following sections, we present the percentage of people who experience poverty by SOGI. Wediscuss whether the patterns are the same for people who live in urban versus rural areas, are ofdifferent races and ethnicities, and are of different ages.Geography and LGBT statusOne major advantage of the BRFSS dataset is that it allows for a much more detailed analysis ofpoverty for LGBT people across geographic areas. In this section, we look first at the urban–ruraldivide and how LGBT people fare, followed by a presentation of poverty rates for the states thatincluded a SOGI question module during the 2014–2017 period.bbThe sample size for cisgender straight men and cisgender straight women (n 58,583) does not equal the sample size inFigure 1 for cisgender straight adults (n 58,773) because 190 respondents did not provide information on their genderbut did provide information on their sexual orientation or gender identity. For the same reason, the sum of the separate
LGBT Poverty in the United States 9Figure 3 shows the proportions of LGBT and cisgender straight people living in rural and urban areas.As Figure 3 shows, LGBT people are more likely to live in urban areas (88.3%) compared to theircisgender straight counterparts (84.2%); 11.7% of LGBT people live in rural areas, compared to 15.8%of cisgender straight people. In a more detailed analysis (not presented here), we found thatdifference to be significant and persistent after considering other characteristics such as education,employment, race, and age.cFigure 3. Percentages of LGBT and cisgender straight people living in rural and urban areasPercent of LGBT People Living in Urban and RuralCommunitiesTYPE OF COMMUNITY11.7%Percent of Cisgender Straight People Living in Urbanand Rural CommunitiesRURAL (N 192,851)URBAN (N 18,531)URBAN (N 478,703)88.3%Given this difference between urban and ruralpopulations by SOGI status, we comparedpoverty rates of people living in urban areasto those living in rural areas in Figure 4 bySOGI. First, note that the poverty rates forLGBT people as a whole are higher than therate among cisgender straight people in bothurban and rural areas. About 16% of cisgenderstraight people live in poverty in both urbanand rural areas, but one in five (21.0%) LGBTpeople live in poverty in urban areas and onein four (26.1%) in rural areas are poor. In otherwords, although both rural and urban LGBTpeople have higher rates of poverty, the gap islarger for LGBT people in rural areas.15.8%TYPE OF COMMUNITYRURAL (N 5,091)84.2%Figure 4. Poverty rates comparing LGBT andcisgender straight people by rural and urbanresidence26.1%21.0%LGBT, RURAL(N 4,257)LGBT, URBAN(N 15,234)15.9%15.5%CIS-STRAIGHT,RURAL(N 158,702)CIS-STRAIGHT,URBAN(N 391,237)As with the differences in poverty rates between SOGI groups previously noted, cisgender bisexual womenand transgender people have the highest rates of poverty in both rural and urban areas, as shown in TableLGBT groups (n 3,221) in Figure 2 does not equal the LGBT (n 3,222) sample in Figure 1.cWe conducted a logistic regression with living in urban area as an outcome and SOGI as a predictor variable. We alsoincluded other variables such as race, education, age, etc. to account for characteristics that may prompt someone to livein an urban area.
LGBT Poverty in the United States 102. Their rates are higher than those of cisgender straight women and men in both urban and rural areas.In urban areas, cis-gay men (11.9%) and cis-straight men (13.4%) have similar rates of poverty, as docis-lesbian women (17.5%) and cis-straight women (17.6%), though the differences between thesemen and women groups is statistically significant. Additionally, cisgender bisexual women in urbanareas (28.3%) have a much higher rate of poverty than cisgender bisexual men (19.1%). Cisgenderbisexual women and transgender people have the highest rate of poverty compared to all othergroups in the urban areas.In rural areas, SOGI patterns of poverty somewhat differ. Although the poverty rate of cisgenderstraight men (13.2%) and cisgender gay men (13.6%), and cisgender lesbian women (19.5%) andcisgender straight women (18.6%) remain similar, the differences by gender are no longer statisticallysignificant with the exception of cisgender straight men and women. Cisgender bisexual women inrural areas (37.0%) continue to have a higher rate of poverty than cisgender bisexual men (24.5%),but that difference is not statistically significant. However, cisgender bisexual women in rural areashave the highest rate of poverty compared to all other groups and a much higher rate of poverty thancisgender bisexual women in urban areas. Transgender people in rural areas (27.6%) also have a highrate of poverty, but they are not statistically significantly different than cisgender lesbian women orcisgender bisexual men in rural areas or transgender people in urban areas.Table 2. Poverty rates by SOGI and rural and urban residenceURBANRURALSOGI%N%NCis-straight men13.414,89113.26,524Cis-straight women17.624,77618.611,675Cis-gay men11.938613.6348Cis-lesbian women17.533119.5103Cis-bisexual men19.19824.5121Cis-bisexual women28.392837.0344Transgender29.535827.6158Note: Bold percentages indicate respondents differed significantly (p .05) by row. For example, 28.3% of cis-bisexual womenin urban areas experienced poverty compared to 37.0% of cis-bisexual women in rural areas. This difference is statisticallysignificant and indicated by the bold percentages. However, the difference between cis-straight men in urban areas (13.4%)compared to cis-straight men in rural areas (13.2%) is not statistically significantly different and, therefore, not bold.For another geographic perspective, we examined how poverty rates varied for SOGI groups acrossstates. Thirty-five states included the SOGI module at least once in the 2014–2017 BRFSS surveys,allowing us to explore poverty rates by SOGI in these 35 states. Table 3 shows that LGBT peoplehave significantly higher poverty rates in 22 of the states: Connecticut, Hawaii, Idaho, Illinois, Indiana,Iowa, Kansas, Kentucky, Louisiana, Maryland, Minnesota, Montana, New York, Ohio, Oklahoma,Pennsylvania, Rhode Island, Texas, Virginia, Vermont, Washington, and Wisconsin. The differencein poverty rates was not statistically significant in the remaining 13 states: California, Colorado,Delaware, Florida, Georgia, Massachusetts, Mississippi, Missouri, Nevada, North Carolina, SouthCarolina, West Virginia, and Wyoming. In 12 of the 13 states (the exception being Florida), the povertyrates were higher for LGBT people but not statistically significantly higher.
LGBT Poverty in the United States 11Table 3. Poverty rates of states that included the SOGI module comparing LGBT and cisgenderstraight peoplePOVERTY RATESTATES THAT INCLUDED THE SOGI 244Montana14.71,24831.358Nevada18.81,15822.681New York16.35,16220.2359North 7.255930.728Pennsylvania122,13617.6112Rhode Island12.976420.857South .51,65018.1123West g8.727726.913Note: Bold percentages indicate respondents differed significantly (p .05) by row. For example, 17.8% of LGBT peopleexperienced poverty compared to 10.1% of cisgender straight people in Connecticut. This difference is statistically significantand indicated by the bold percentages. However, the difference between LGBT people (22.5%) and cisgender straight people(22.8%) in California is not statistically significantly different and, therefore, not bold.
LGBT Poverty in the United States 12Figure 5 maps the states and their LGBT poverty rates, with orange states denoting a significantlyhigher poverty rate for LGBT people compared to their cisgender straight counterparts. Thegeographic pattern generally shows higher poverty rates for LGBT people in Northeast, Midwest,Northwest, and Southwest states.Figure 5. LGBT poverty in the U.S. - Using the Behavioral Risk Surveillance Survey in 35 %30.1%6.9%24.4%STATISTICAL TEST RESULTSSTATISTICALLY HIGHER LGBT POVERTY RATELGBT RATE IS STATISTICALLY THE SAME AS CIS-GENDER STRAIGHTNO STATE SOGI DATA REPORTEDOverall, this section shows that where one lives matters for the poverty gap between LGBT peopleand cisgender straight people. Being in a rural area appears to be especially challenging to economicstability for LGBT people. States with poverty gaps appear in most regions of the United States,suggesting that some states and regions are also more economically challenging for LGBT peoplerelative to cisgender straight people.Race, ethnicity, and LGBT statusWhen making comparisons between cisgender straight people and the combined LGBT respondents,we see that Black, White, Asian, and “other” LGBT people have statistically significantly higher povertyrates than their same-race cisgender straight counterparts (Table 4). For example, 30.8% of BlackLGBT people live in poverty, whereas 25.3% of Black cis-straight people live in poverty. The LGBT
LGBT Poverty in the United States 13people in the remaining groups of people of color tend to have similarly high rates of poverty whencompared to cisgender people of the same racial and ethnic groups.Table 4. Poverty rates comparing LGBT and cisgender straight people by race and erican Indian or Alaska Native26.91,43832.4101Asian14.61,81922.9102Native Hawaiian or Pacific Islander25.443728.933“Other” race14.826642.129Multirace20.8250922.3186Note: Bold percentages indicate respondents differed significantly (p .05) by row.We can also look at the influence of race and ethnicity on poverty rates among cisgender straightpeople and LGBT people. Figure 6 shows that except for the “other race” category, the poverty ratesfollow similar patterns for both cisgender straight people and LGBT people, though LGBT people of allraces and ethnicities show higher rates of poverty than their cisgender straight counterparts.Figure 6. Poverty rates comparing LGBT and cisgender straight people by race and ISPANICCISGENDER PIMULTIRACEASIANWHITELGBTWhen we separate the LGBT population into subgroups (see each row in Table 5), the patterns ofpoverty rates among SOGI groups generally remain the same across racial groups, but the differencesare not all statistically significant. In each racial and ethnic group, cisgender straight women havesignificantly higher poverty rates than cisgender straight men. But among LGB cisgender people,this gender disparity only holds true for Black lesbians (31.3%) and bisexual women (39.7%)when compared to Black gay (17.1%) and bisexual men (20.3%). In most racial and eth
30.8% of Black LGBT people live in poverty, whereas 25.3% of Black cisgender straight people live in poverty. The patterns of racial disparities in poverty rates were similar for both LGBT and cisgender straight people. That is, for nearly all SOGI groups, people of color had significantly