Transcription
Supplement 2For: Ya-Ting Du, Ya-Wei Li, Bin-Jiang Zhao, et al. Long-term survival after combined epidural-generalanesthesia or general anesthesia alone: Follow-up of a randomized trial.1
ContentsAuthors’ affiliations. 3Additional members of the PUCRP Study Group . 4Figure S1. The Kaplan–Meier survival curves of all patients. 5Figure S2. The Kaplan–Meier survival curves of cancer patients . 6Figure S3. Forest plot in cancer patients. 8Table S1. Baseline data of cancer patients . 9Table S2. Type and pathological stage of cancer patients . 11Table S3. Perioperative and follow-up data of cancer patients . 13Table S4. Individual new onset cancer and new serious non-cancer diseases during follow-up . 15Table S5. Cognitive function and quality of life in 3-year survivors. 172
Authors’ affiliationsDepartment of Anesthesiology and Critical Care Medicine, Peking University First Hospital, Beijing, China (YTD, Y-WL, CF, W-JZ, H-JL, Y-FL, TC, D-LM, YZ, D-XW).Department of Anesthesiology, Beijing Shijitan Hospital, Capital Medical University, Beijing, China (B-JZ, PFL).Department of Anesthesiology, Peking University Third Hospital, Beijing, China (X-YG, YL).Department of Anesthesiology, Peking University People’s Hospital, Beijing, China (YF, H-YA).Department of Anesthesiology, Beijing Hospital, National Center of Gerontology; Institute of GeriatricMedicine, Chinese Academy of Medical Sciences, Beijing, China (M-ZZ).Department of Biostatistics, Peking University First Hospital, Beijing, China (S-NZ, X-YL).Peking University Clinical Research Institute, Peking University Health Science Center, Beijing, China (H-JL,Y-FW).Outcomes Research Consortium, Cleveland, Ohio, USA (D-XW).Department of OUTCOMES RESEARCH, Cleveland Clinic, Cleveland, Ohio, USA (DIS).3
Additional members of the PUCRP Study GroupJun Li, Guo-Jin Shan, Qiong Ma, Hao Kong, MD, Da Huang, MD, Chun-Mei Deng, MD, Yi Zhao, MD, Xue-YiZheng, MD, Yue Zhang, MD, PhD, Dan-Feng Zhang, MD, Mu-Han Li, MD, PhD, Xin-Quan Liang, MD, ChaoLiu, MD, Shu-Ting He, MD, Si-Ming Huang, MD, Si-Chao Xu, MD, Xiao-Yun Hu, MD, Run Wang, MD, LiXiao, MD, Jing Zhang, MD, Wen-Zheng Yang, MD, Wei-Ping Liu, MD, Wen-Yong Han, MD, Yao Yu, MD,Hong-Ye Zhang, MD, Zhen Hua, MD, Jing-Jing Zhang, MD, Ping Ji, PhD, Qin Liu, MPH, Shu-Qian Fu, MPH,Xian Su, MPH, Xiao-Yan Yan, PhD, Yong-Pei Yu, PhD, and Mei-Rong Wang, MD.Department of Anesthesiology and Critical Care Medicine, Peking University First Hospital, Beijing, China (JL,G-JS, QM, HK, DH, C-MD, YZ, X-YZ, YZ, D-FZ, M-HL, X-QL, CL, S-TH, S-MH, S-CX).Department of Anesthesiology, Beijing Shijitan Hospital, Capital Medical University, Beijing, China (X-YH,RW, LX, JZ, W-ZY).Department of Anesthesiology, Peking University Third Hospital, Beijing, China (W-PL, W-YH).Department of Anesthesiology, Peking University People’s Hospital, Beijing, China (YY).Department of Anesthesiology, Beijing Hospital, National Center of Gerontology; Institute of GeriatricMedicine, Chinese Academy of Medical Sciences, Beijing, China (H-YZ, ZH, J-JZ).Peking University Clinical Research Institute, Peking University Health Science Center, Beijing, China (PJ, QL,S-QF, XS, X-YY, Y-PY, M-RW).4
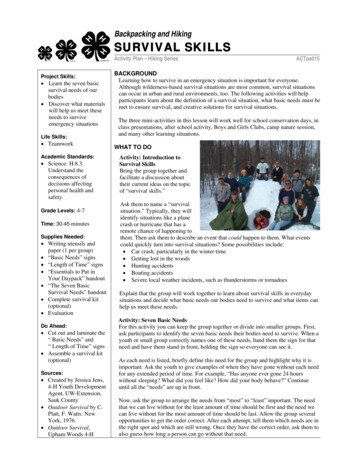
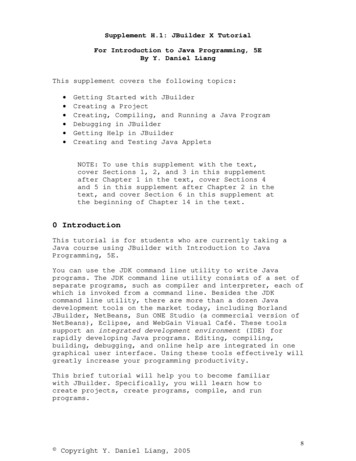
AANumber at riskCombined epidural-generalGeneral 857775777BANumber at riskCombined epidural-generalGeneral anesthesiaFigure S1. The Kaplan–Meier survival curves of all patients.The Kaplan–Meier survival curves for (A) recurrence-free survival and (B) event-free survival. MultivariableCox proportional hazards model adjusted for age, sex, body mass index, Charlson Comorbidity Index, type ofsurgery, location of surgery, type of cancer, Tumor-Node-Metastasis stage, and study center. Crosses indicatecensored patients.5
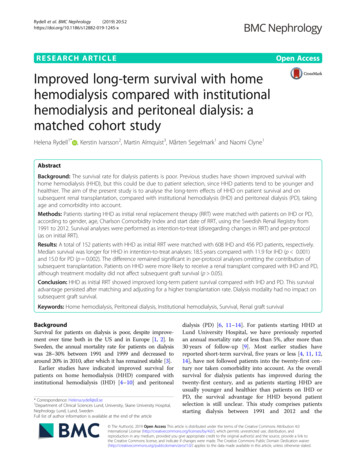
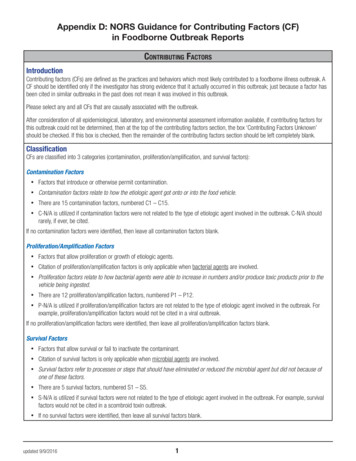
ANumber at riskCombined epidural-generalGeneral 13361916133CNumber at riskCombined epidural-generalGeneral anesthesiaNumber at riskCombined epidural-generalGeneral mber at riskCombined epidural-generalGeneral anesthesia4114303784056
Figure S2. The Kaplan–Meier survival curves of cancer patients.The Kaplan–Meier survival curves of (A) overall survival; (B) cancer-specific survival; (C) recurrence-free survival; and, (D) event-free survival in cancer patients.Multivariable Cox proportional hazards model adjusted for age, sex, body mass index, Charlson Comorbidity Index, type of surgery, location of surgery, type of cancer,Tumor-Node-Metastasis stage, and study center. Crosses indicate censored patients.7
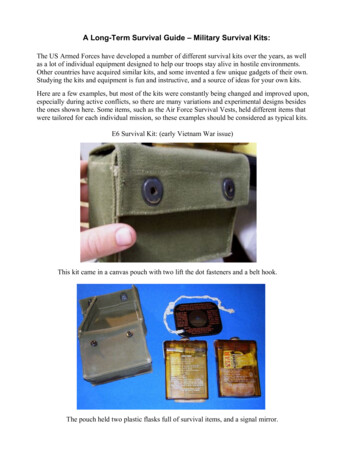
Figure S3. Forest plot in cancer patients.Forest plot assessing interactions between preselected baseline factors and the effect of combined epiduralgeneral anesthesia versus general anesthesia alone on overall survival in cancer patients. Hazard ratios andadjusted 95% CIs are shown. The estimated overall hazard ratio was derived from a multivariable Coxproportional hazards model adjusted for preselected baseline factors of age, sex, body mass index, CharlsonComorbidity Index, type of surgery, location of surgery, type of cancer, Tumor-Node-Metastasis stage, and studycenter. For the subgroup analyses, we assessed the treatment-by-covariate interaction on the primary outcome,adjusting for the same baseline variables.8
Table S1. Baseline data of cancer patientsAge, yearMale sex, n (%)Body mass index, kg/m2Education, yearComorbidity, n (%)StrokeTransient ischemic attackHypertensionCoronary heart diseaseArrhythmiaChronic bronchitisCOPDAsthmaDiabetesThyroid disease aLiver dysfunction bRenal dysfunction cPrevious cancer dChronic smoking, n (%) eAlcoholism, n (%) fCharlson Comorbidity Index gHistory of anesthesia, n (%)NYHA classification, n (%)Class IClass IIASA classification, n (%)Class IClass IIClass IIIPreoperative laboratory test resultsHematocrit, %Albumin, g/LGlucose 4.0 or 10.0 mmol/L, n (%)Na 135.0 or 145.0 mmol/L, n (%)K 3.5 or 5.5 mmol/L, n (%)Creatinine 133 mol/L, n (%)Preoperative delirium, n (%)Mini-Mental State Examination, score hBarthel index, score iPathologically diagnosed cancer, n (%)Study centers, n (%)Center 1Center 2Center 3Combined epiduralgeneral anesthesia (n 781)69 6509 (65)24 310 5General anesthesiaalone (n 793)70 6540 (68)24 310 433 (4)9 (1)305 (39)79 (10)25 (3)17 (2)14 (2)14 (2)138 (18)21 (3)6 ( 1)4 ( 1)14 (2)193 (25)59 (8)2 (2-3)357 (46)42 (5)12 (2)348 (44)70 (9)33 (4)12 (2)15 (2)13 (2)146 (18)18 (2)4 ( 1)3 ( 1)15 (2)193 (24)55 (7)2 (2-3)368 (46)588 (75)193 (25)599 (76)194 (24)60 (8)672 (86)49 (6)56 (7)676 (85)61 (8)38.0 5.240.1 4.342 (5)43 (6)77 (10)17 (2)0 ( 1)29 (27, 30) [10]100 (100, 100) [10]781 (100)38.1 5.440.1 4.4 [1]53 (7)64 (8)73 (9)27 (3)0 ( 1)29 (27, 30) [11]100 (100, 100) [8]793 (100)714 (91)17 (2)17 (2)726 (92)12 (2)16 40.0440.0140.0060.0540.019 0.0010.0550.1020.0220.075 0.0010.0390.039 0.0010.0219
Center 5Center 61 ( 1)32 (4)3 ( 1)36 (5)Data are mean SD, n (%) or median (IQR). Numbers in square brackets indicate patients with missing data.Abbreviations: ASD, absolute standardized difference (an ASD of 0.095 is considered imbalanced between thetwo groups); COPD, chronic obstructive pulmonary disease; NYHA, New York Heart Association; ASA,American Society of Anesthesiologists.aIncluded hyperthyroidism, hypothyroidism, nodular goitre, Hashimoto's thyroiditis and thyroid adenoma.bAlanine transaminase and/or aspartate transaminase higher than 5 times the upper normal limit.cCreatinine 177 mol/L.dConfirmed by pathological examination.eSmoking half a pack (10 cigarettes) per day for at least 1 year, either former or current smoker.fTwo drinks or more daily, or weekly consumption of the equivalent of 150 mL of alcohol.gAccording to the Charlson Comorbidity Index without age.hScore ranges from 0 to 30, with higher score indicating better function.iScore ranges from 0 to 100, with higher score indicating better function.10
Table S2. Type and pathological stage of cancer patientsCombined epidural-generalanesthesia (n 781)Type of cancer, n (%)GastricSmall intestineAppendixColorectalLiverBiliary ductGallbladderPancreaticLungEsophagealMalignant thymomaRenalUrinary bladderUreterProstatePelvic cavityTumor-Node-Metastasis stage gTumor stage, n (%)TxT0TaTisT1T2T3T4Node stage, n (%)NxN0N1N2N3Metastasis stage, n (%)MxM0M1General anesthesiaalone (n 793)ASD0.044a76 (10)8 (1)0 ( 1)208 (27) c39 (5)12 (2)5 ( 1)24 (3)146 (19)31 (4)3 ( 1)48 (6)83 (11)23 (3)58 (7)17 (2) eb89 (11)6 ( 1)1 ( 1)199 (25) d28 (4)16 (2)9 (1)18 (2)125 (16)43 (5)3 ( 1)45 (6)90 (11)32 (4)78 (10)11 (1) f0.0430 ( 1)0 ( 1)8 (1)5 ( 1)145 (19)221 (28)288 (37)114 (15)0 ( 1)0 ( 1)4 ( 1)7 ( 1)169 (21)216 (27)292 (37)105 (13)0.1176 ( 1)508 (65)138 (18)108 (14)21 (3)3 ( 1)560 (71)124 (16)89 (11)17 (2)1 ( 1)696 (89)84 (11)1 ( 1)725 (91)67 (8)0.082Data are n (%).Abbreviations: ASD, absolute standardized difference (an ASD of .095 is considered imbalanced between thetwo groups).aInclude gastric cancer (68 cases) and malignant gastric stromal tumor (8 cases).bInclude gastric cancer (79 cases) and malignant gastric stromal tumor (10 cases).cInclude colon cancer (113 cases), and rectal cancer (95 cases).dInclude colon cancer (98 cases), and rectal cancer (101 cases).11
eInclude cervical cancer (1 case), ovarian cancer (4 cases), malignant tumor of the vulva and vagina (1 case),liposarcoma (6 cases), leiomyosarcoma (1 case), malignant peripheral nerve sheath tumor (1 case), andmalignant fibrous histiocytoma (3 cases).fInclude cervical cancer (2 cases), ovarian cancer (2 cases), liposarcoma (5 cases), malignant peripheral nervesheath tumors (2 cases).gAccording to the American Joint Committee on Cancer 8th Edition Cancer Staging System.12
Table S3. Perioperative and follow-up data of cancer patientsIntraoperative dataDuration of anesthesia, hIntraoperative medicationsMidazolam, mgPropofol, mgUse of nitrous oxide, n (%)Use of sevoflurane, n (%)Remifentanil, gSufentanil, gUse of vasopressors, n (%) aUse of glucocorticoids, n (%) bIntraoperative MAP, mmHg cSBP 80 mmHg, minSBP 180 mmHg, minIntraoperative HR, bpm cHR 40 bpm, minHR 100 bpm, minDuration of surgery, hLocation of surgery, n (%)Intra-thoracicIntra-abdominalType of surgery, n (%)OpenThoraco-/laparoscopicEstimated blood loss, mLIntraoperative blood transfusion, n (%)Postoperative dataICU admission after surgery, n (%)With endotracheal intubation, n (%)Postoperative opioid analgesiaEpidural sufentanil, gIntravenous morphine, mgSupplemental opioids, n (%)Delirium within 7 days, n (%)Other complications within 30 days, n (%)Length of hospital stay, d30-day mortality, n (%)Perioperative dataSufentanil equivalent, ug dUse of NSAIDs, n (%) eLong-term follow-up dataTime to last follow-up, month fPostoperative anti-cancer therapy, n (%)RadiotherapyCombined epiduralgeneral anesthesia (n 781)General anesthesiaalone (n 793)P value4.9 (3.8, 6.1)4.9 (3.8, 6.2)0.8201.5 (1.0, 2.0)780 (220, 1195)492 (63)399 (51)140 (0, 800)20 (15, 30)451 (58)711 (91)79 70 (0, 4)0 (0, 0)69 100 (0, 0)0 (0, 2)3.9 (2.8, 5.1)1.5 (1.2, 2.0)840 (290, 1280)560 (71)456 (58)1200 (600, 1880)35 (25, 45)356 (45)716 (90)83 70 (0, 2)0 (0, 2)67 100 (0, 0)0 (0, 2)3.9 (2.9, 5.2)0.3760.1060.0010.011 0.001 0.001 0.0010.611 0.001 0.001 0.0010.0050.7360.2060.9410.480180 (23)601 (77)171 (22)622 (78)0.363530 (68)251 (32)100 (50, 300)115 (15)521 (66)272 (34)150 (50, 350)133 (17)0.5680.265151 (19)71 (9)166 (21)102 (13)0.4290.017124 (118, 125)0 (0, 0)90 (12)13 (2)174 (22)9 (7, 13)6 ( 1)0 (0, 0)43 (38, 50)88 (11)41 (5)197 (25)9 (7, 13)2 ( 1) 0.001 0.0010.789 0.0010.2310.4610.278165 (145, 225)339 (43)204 (148, 275)378 (48) 0.0010.09066 (60, 80)266 (35) [12]30 (4) [12]66 (61, 80243 (31) [5]45 (6) [5]0.8830.1140.09513
ChemotherapyReoperationInterventional therapy203 (26) [12]41 (5) [12]8 (1) [12]178 (23) [5]32 (4) [5]13 (2) [5]0.0800.2360.411Data are median (IQR), n (%), or mean SD. Numbers in square brackets indicate patients with missing data.Abbreviations: MAP, mean arterial pressure; SBP, systolic blood pressure; HR, heart rate; bpm, beats perminute; ICU, intensive care unit; NSAIDs, non-steroid anti-inflammatory drugs.aInclude ephedrine, phenylephrine, vasopressin, epinephrine, and norepinephrine.bInclude dexamethasone, methylprednisolone and hydrocortisone.cAverage value during anesthesia.dInclude those administered intra- and postoperatively (up to 7 days after surgery). Sufentanil 10 µg (iv) sufentanil 10 µg (epidural) fentanyl 100 µg (iv) remifentanil 100 µg (iv) morphine 10 mg (iv) morphine30 mg (po) oxycodone 15 mg (po) dezocine 10 mg (iv) tramadol 100 mg (iv) pethidine 100 mg (iv).eInclude flurbiprofen axetil and parecoxib administered intra- and postoperatively, up to 7 days after surgery.fFrom the date of surgery to September 30, 2019.14
Table S4. Individual new onset cancer and new serious non-cancer diseases during follow-upAll patientsCombined epiduralGeneral anesthesiageneral anesthesia (n 853)alone (n 859)New onset cancer. aLungThyroidColonBladderPelvis and ureterPorta hepatis bile ew serious non-cancer disease. bStrokeValvular heart diseaseAcute myocardial infarctionArrhythmiaStent implantationThrombusAtelectasisPulmonary embolismPulmonary nodulesIntestinal sP valueCancer patientsCombined epiduralGeneral anesthesiageneral anesthesia (n 781)alone (n 1114100111100.23382333531218211110831231115211P value0.140523125312171118082023111411115
Esophageal stenosisInfectionFracturesProstatic hyperplasiaCataractPolypsBenign tumorHerniaGlaucomaFistulaCirrhosisIntestinal ruptureGastric ulcer with 021281473912201Data are number.aIndicate those that were pathologically confirmed and differing from the primary tumor.bIndicate those that required hospital readmission and/or another surgery.16
Table S5. Cognitive function and quality of life in 3-year survivorsTICS-m , scoreWHOQOL-BREF, scorePhysical domainPsychological domainSocial relationships domainEnvironment domainCombined epidural-generalanesthesia (n 853)33.6 5.2 (n 581)(n 587)63.4 14.660.5 13.757.8 13.659.5 12.9General anesthesia alone(n 859)33.3 4.9 (n 609)(n 614)61.5 12.258.9 12.156.9 12.558.8 12.4Estimated mean difference(95% CI) a0.4 (-0.2, 0.9)1.9 (0.4, 3.4)1.6 (0.1, 3.1)0.8 (-0.6, 2.3)0.7 (-0.8, 2.1)P value0.2090.0150.0330.2620.369Data are mean SD.Abbreviations: TICS-m, the Telephone Interview for Cognitive Status-modified; WHOQOL-BREF, the World Health Organization Quality of Life-Brief version.aCalculated as the combined epidural-general anesthesia group vs. or minus the general anesthesia group.17
Figure S1. The Kaplan–Meier survival curves of all patients. The Kaplan–Meier survival curves for (A) recurrence-free survival and (B) event-free survival. Multivariable Cox proportional hazards model adjusted for age,

![[Type here] BUG OUT BAG CHECKLIST - Skilled Survival](/img/14/bug-out-bug-out-bag-checklist-v3.jpg)