Transcription
Laboratory ManualElectrical Circuits SimulationELECTRICAL CIRCUITSSIMULATION LABII Year - 2 SemestersLABORATORY MANUALDepartment ofELECTRICAL AND ELECTRONICS ENGINEERINGDepartment of Electrical & Electronics Engineering – ASTRA
Laboratory ManualElectrical Circuits Simulation2. PREAMBLE:The significance of the Electrical Circuit Simulation Lab is renowned in the various fields ofengineering applications. For an Electrical Engineer, it is obligatory to have the practical ideasabout the Electrical Circuits and Simulation.By this perspective we have introduced a Laboratory manual cum Observation for ElectricalCircuits and Simulation.The manual uses the plan, cogent and simple language to explain the fundamental aspects ofElectrical Circuits and Simulation in practical. The manual prepared very carefully with our levelbest. It gives all the steps in executing an experiment.Department of Electrical & Electronics Engineering – ASTRA
Laboratory ManualElectrical Circuits Simulation3. CODE OF CONDUCT:CODE OF CONDUCT FOR THE LABORATORIES All students must observe the Dress Code while in the laboratory. Sandals or open-toed shoes are NOT allowed. Foods, drinks and smoking are NOT allowed. All bags must be left at the indicated place. The lab timetable must be strictly followed. Be PUNCTUAL for your laboratory session. Experiment must be completed within the given time. Noise must be kept to a minimum. Workspace must be kept clean and tidy at all time. Handle all apparatus with care. All students are liable for any damage to equipment due to their own negligence. All equipment, apparatus, tools and components must be RETURNED to their originalplace after use. Students are strictly PROHIBITED from taking out any items from the laboratory. Students are NOT allowed to work alone in the laboratory without the Lab Supervisor Report immediately to the Lab Supervisor if any injury occurred. Report immediately to the Lab Supervisor any damages to equipment.Before leaving the lab Place the stools under the lab bench. Turn off the power to all instruments. Turn off the main power switch to the lab bench. Please check the laboratory notice board regularly for updatesDepartment of Electrical & Electronics Engineering – ASTRA
Laboratory ManualElectrical Circuits Simulation4 . OBJECTIVE & RELEVANCE:The objective of Simulation laboratory is to impart hands on experience in verification of circuitlaws and theorems, measurement of circuit parameters, study of circuit characteristics usingPSPICE. It also gives practical exposure to the usage of different circuits with differentcondition.OUTCOME:At the successful completion of this course, the student is expected to gain the following skills: Become familiar with the basic circuit components and know how to connect them to make areal electrical circuit; Become familiar with basic electrical measurement instruments and know how to use themto make different types of measurements; Be able to verify the laws and principles of electrical circuits, understand the relationships anddifferences between theory and practice; Be able to gain practical experience related to electrical circuits, stimulate more interest andmotivation for further studies of electrical circuits; and Be able to carefully and thoroughly document and analyze experimental work.Department of Electrical & Electronics Engineering – ASTRA
Laboratory ManualElectrical Circuits Simulation5. List of experiments:1. PSPICE SIMULATION OF NODAL ANALYSIS FOR DC CIRCUITS2. PSPICE SIMULATION OF D.C. CIRCUIT FOR DETREMINING THEVININ’S EQUIVALENT3. PSPICE SIMULATION OF D.C. NETWORK WITH SUB CIRCUIT4. PSPICE SIMULATION OF TRANSIENT AND PARAMETRIC ANALYSIS OF SERIES RLCCIRCUITS USING STEP AND PULSE INPUT5. PSPICE SIMULATION OF TRANSIENT AND PARAMETRIC ANALYSIS OF SERIES RLCCIRCUITS USING SINE INPUT6. ANALYSIS OF THREE PHASE CIRCUIT REPRESENTING GENERATOR TRANSMISSION LINEAND LOAD7. PSPICE SIMULATION OF MAXIMUM POWER TRANSFER THEOREM FOR DC CIRCUITS8. PSPICE SIMULATION OF RECIPROCITY THEOREM FOR DC CIRCUITS9. PSPICE SIMULATION OF SUPERPOSITIO THEOREM FOR DC CIRCUITS10. PSPICE SIMULATION OF AC CIRCUITS.Department of Electrical & Electronics Engineering – ASTRA
Laboratory ManualElectrical Circuits Simulation6. TEXT AND REFERENCE BOOKSText Books1. Basic Electrical Engineering- By M.S.Naidu and S. Kamakshiah – TMH.2. Basic Electrical Engineering –By T.K.Nagasarkar and M.S. Sukhija OxfordREFERENCES1. Theory and Problems of Basic Electrical Engineering by D.P.Kothari & I.J.Nagrath PHI.2. Principles of Electrical Engineering by V.K Mehta, S.Chand Publications.Department of Electrical & Electronics Engineering – ASTRA
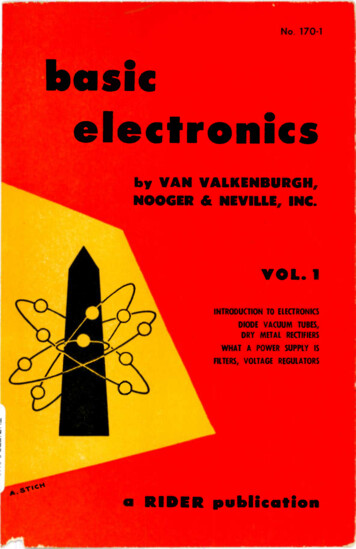
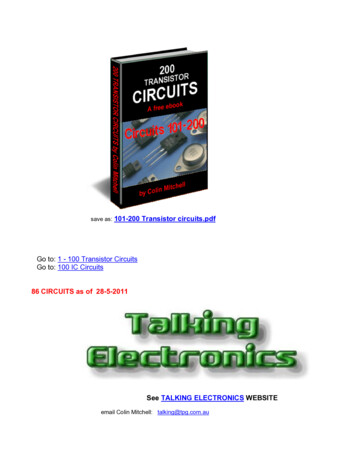
Laboratory ManualElectrical Circuits Simulation7. EACH EXPERIMENT WRITE UP:7.1.PSPICE SIMULATION OF Nodal analysis for DC circuitsAIM: To Simulate the DC Circuit for determining the all node voltages using PSPICE.SOFTWARE REQUIRED: PSPICE – Personal Computer Simulated Programwith Integrated Circuit Emphasis.Program:Circuit diagram:Department of Electrical & Electronics Engineering – ASTRA
Laboratory ManualElectrical Circuits SimulationOutput :NODE VOLTAGE NODE VOLTAGE NODE VOLTAGE NODE VOLTAGE( 1) 20.0000 ( 2) 13.3330 ( 3) -2.0000 ResultsVOLTAGE SOURCE CURRENTSNAME CURRENTVs -1.333E-03 Current entering node 1 of VsTOTAL POWER DISSIPATION 2.67E-02 WATTSJOB CONCLUDEDTOTAL JOB TIME .26Result:Department of Electrical & Electronics Engineering – ASTRA
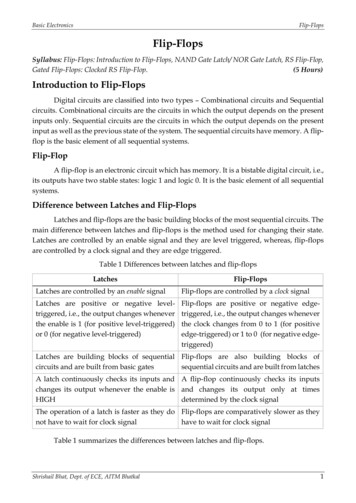
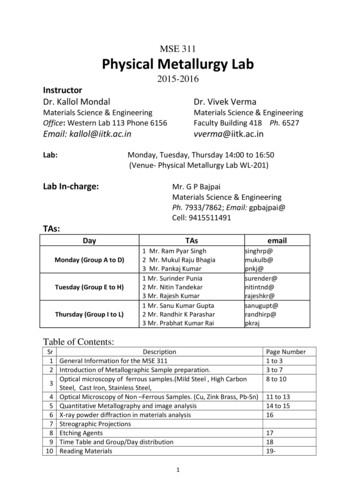
Laboratory ManualElectrical Circuits Simulation7.2.PSPICE SIMULATION OF D.C. CIRCUIT FOR DETREMINING THEVININ’S ANDNORTONS EQUIVALENTAIM: To Simulate the DC Circuit for determining the Thevenin’s equivalentnortons equivalent using PSPICE.andSOFTWARE REQUIRED: PSPICE – Personal Computer Simulated Programwith Integrated Circuit Emphasis.DATA REQUIRED FOR DRAWING CIRCUIT DIAGRAM:A DC Circuit is as shown in the figure. It Consists of Voltage Source whose Value is 10V;the Current source has the Value of 2A. It has the resistance values as 5Ω, 10Ω, 20Ω, 40Ω, and10Ω respectively. Use PSPICE to plot and calculate the Thevenin’s Equivalent Circuit across thenodes 2 and 4.Obtain the transfer function between the two nodes 2 and 4.CIRCUIT DIAGRAM:Department of Electrical & Electronics Engineering – ASTRA
Laboratory ManualPROGRAM:Thevenins theorem :*VIN 1 0 DC 10VIS 4 3 2AVX 4 5 DC 0VR1 1 2 5R2 2 3 10R3 2 0 20R4 3 4 40R5 5 0 10.TF V(2,4) VIN.ENDNortons theorem :CIRCUIT I3).CVS.VENOUTPUT:RESULT:Department of Electrical & Electronics Engineering – ASTRAElectrical Circuits Simulation
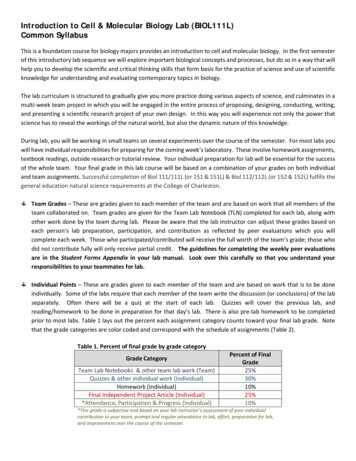
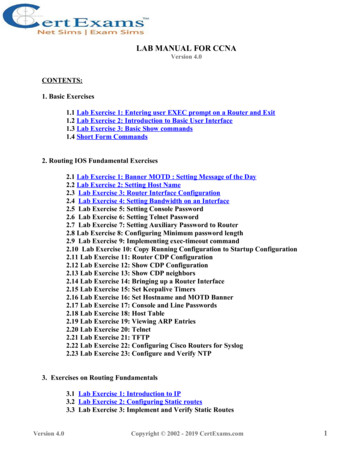
Laboratory ManualElectrical Circuits Simulation7.3.PSPICE SIMULATION OF D.C. network with sub circuitAIM: To Simulate the DC network with sub circuit using PSPICE.SOFTWARE REQUIRED: PSPICE – Personal Computer Simulated Programwith Integrated Circuit Emphasis.Theory :Coding a SubcircuitEach subcircuit used in a study must have a unique name. This is true of any othercircuit element. Also, there must be a list of at least two nodes that can beconnected to elements external to the subcircuit. A subcircuit can have manyexternal node connections, if needed. Later, we will find that parameters can bepassed to a subcircuit in order to allow unique behavior and responses from aninstance of a subcircuit.The initial line of a subcircuit section must begin with ".SUBCKT," followed by thename and then the external node list. After that, optional features (not to bediscussed yet) can be added. The best method of understanding the use of asubcircuit is by example. Below, we find a cluster of components that can becombined into a subcircuit.Sub circuit:Department of Electrical & Electronics Engineering – ASTRA
Laboratory ManualElectrical Circuits SimulationNote that nodes 5, 12 and 18 have external connections. Therefore, they must beincluded in the node list in the subcircuit definition. Nodes 10 and 13 do not haveexternal connections and need not be (indeed should not be) included in thisnode list. They are internal nodes and will be used to help define the subcircuit.Now, we can code the above subcircuit as follows. Note that the code could beembedded into the rest of the code for the main circuit or could be placed in aseparate include file.Program for sub circuit:Main circuit diagram:Department of Electrical & Electronics Engineering – ASTRA
Laboratory ManualMain program:6.0.ENDSVs 1Ra 1Rb 3Rc 7Rd 6X1 2X2 4.END0240076DC 50V1.03.025.045.035Output:Result:Department of Electrical & Electronics Engineering – ASTRAElectrical Circuits Simulation
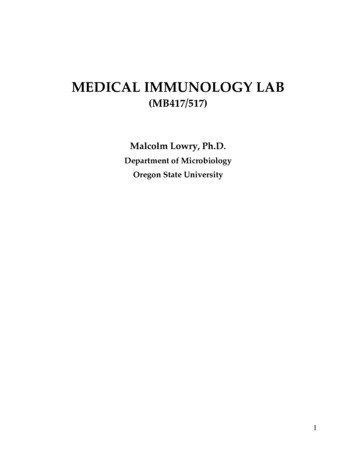
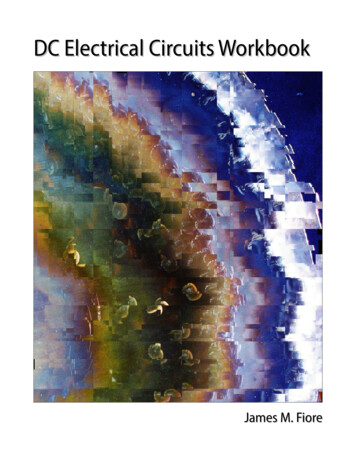
Laboratory ManualElectrical Circuits Simulation7.4.PSPICE SIMULATION OF TRANSIENT AND PARAMETRIC ANALYSIS OF SERIESRLC CIRCUITS using step input and pulse inputAIM: To find out the transient response and parametric analysis by simulationof RLC circuits Using Pulse, and Step responceSOFTWARE REQUIRED: PSPICE – Personal Computer Simulated Programwith Integrated Circuit Emphasis.a) Simulation of STEP RESPONSE Using PSPICE:SYNTAX USED:S.NOTYPE OF SOURCEREPRESENTATIONOF SOURCE1.STEP RESPONSEPWL2.TRANSIENT ANALYSIS.TRAN.TRAN TStep Tstop [TStart TMax] [UIC]3.PROBE STATEMENT.PROBEIt is a wave form analyzer4.PLOT STATEMENT.PLOTDECLARATION FORMATSTEP ( Time at a Point) (Voltage at aPoint).PLOT (Output Variables) {(Lower limitValue), (Upper Limit Value)}DATA REQUIRED FOR DRAWING THE CIRCUIT DIAGRAM:For example, Three RLC circuits with R 2Ω, 1 Ω, and 8 Ω respectively, with L having thevalues of 50μH each, with C having the values of 10μF each. The inputs are identical StepResponse. The Step having the Time at points as 1nsec and 1msec respectively and Voltage at apoint as 1V respectively. Use PSPICE to plot and calculate the transient response from 0 to400μseconds with an increment of 1μsecond. Plot the voltages across the capacitors.CIRCUIT DIAGRAM:Department of Electrical & Electronics Engineering – ASTRA
Laboratory ManualElectrical Circuits SimulationPROGRAM:*VIN1 1 0 PWL(0 0 1NS 1V 1MS 1V)VIN2 4 0 PWL(0 0 1NS 1V 1MS 1V)VIN3 7 0 PWL(0 0 1NS 1V 1MS 1V)R1 1 2 2R2 4 5 1R3 7 8 8L1 2 3 50UHL2 5 6 50UHL3 8 9 50UHC1 3 0 10UFC2 6 0 10UFC3 9 0 10UF.TRAN 1US 400US.PLOT TRAN V(3) V(6) V(9).PROBE.ENDOUTPUT:RESULT: Analysis of Series RLC Circuit with STEP Response has beenSuccessfully completed.Department of Electrical & Electronics Engineering – ASTRA
Laboratory ManualElectrical Circuits Simulationb) Simulation of PULSE RESPONSE Using PSPICE:SYNTAX USED:S.NOTYPE OF SOURCEREPRESENTATIONOF SOURCEDECLARATION FORMAT1.PULSE RESPONSEPULSEPULSE (Initial Value) (Pulsed Value)(Delay Time)( Rise Time)(Fall Time)( Pulse Width) ( period)2.TRANSIENT ANALYSIS.TRAN.TRAN TStep Tstop [TStart TMax] [UIC]3.PROBE STATEMENT.PROBEIt is a wave form analyzer4.PLOT STATEMENT.PLOT.PLOT (Output Variables) {(Lower limitValue), (Upper Limit Value)}DATA REQUIRED FOR DRAWING THE CIRCUIT DIAGRAM:For example, Three RLC circuits with R 2Ω, 1 Ω, and 8 Ω respectively, with L having thevalues of 50μH each, with C having the values of 10μF each. The input is Pulse Response. ThePulse having the Initial voltage as -10V, Pulsed Voltage as 10V, Delay Time as 1nsec, Rise Timeas 1nsec,Fall Time as 1nsec, Pulse Width as 100μSeconds, and Period as 200μseconds.UsePSPICE to plot and calculate the transient response from 0 to 400μseconds with an increment of1μsecond. Plot the voltages across the capacitors.CIRCUIT DIAGRAM:Department of Electrical & Electronics Engineering – ASTRA
Laboratory ManualElectrical Circuits SimulationPROGRAM:*VIN1 1 0 PULSE(-220 220 0 1NS 1NS 100US 200US)VIN2 4 0 PULSE(-220 220 0 1NS 1NS 100US 200US)VIN3 7 0 PULSE(-220 220 0 1NS 1NS 100US 200US)R1 1 2 2R2 4 5 1R3 7 8 8L1 2 3 50UHL2 5 6 50UHL3 8 9 50UHC1 3 0 10UFC2 6 0 10UFC3 9 0 10UF.TRAN 1US 400US.PLOT TRAN V(3) V(6) V(9).PROBE.ENDOUTPUT:RESULT: Analysis of Series RLC Circuit with PULSE Response has beenSuccessfully completed.Department of Electrical & Electronics Engineering – ASTRA
Laboratory ManualElectrical Circuits Simulation7.5.PSPICE SIMULATION OF TRANSIENT AND PARAMETRICSERIES RLC CIRCUITS using sine inputANALYSIS OFAIM: To find out the transient response and parametric analysis by simulationof RLC circuits Using Sinusoidal Responses.SOFTWARE REQUIRED: PSPICE – Personal Computer Simulated Programwith Integrated Circuit Emphasis.SYNTAX USED:S.NOTYPE OF SOURCEREPRESENTATIONOF SOURCE1.SINUSOIDAL RESPONSESIN2.TRANSIENT ANALYSIS.TRAN.TRAN TStep Tstop [TStart TMax]3.PROBE STATEMENT.PROBEIt is a wave form analyzer4.PLOT STATEMENT.PLOTDECLARATION FORMATSIN ( Offset Value) ( Peak Value)( Frequency)( Delay Time) ( DampingFactor) ( Phase Delay).PLOT (Output Variables) {(Lower limitValue), (Upper Limit Value)}DATA REQUIRED FOR DRAWING THE CIRCUIT DIAGRAM:For example, Three RLC circuits with R 2Ω, 1 Ω, and 8 Ω respectively, with L having thevalues of 50μH each, with C having the values of 10μF each. The inputs are identicalSinusoidal Response. The Sinusoidal response having the offset voltage as 0V, RMS voltage as120V and the frequency as 50Hz. Use PSPICE to plot and calculate the transient response from0 to 60mseconds with an increment of 1μsecond. Plot the voltages across the capacitors.CIRCUIT DIAGRAM:Department of Electrical & Electronics Engineering – ASTRA
Laboratory ManualElectrical Circuits SimulationPROGRAM:*VIN1 1 0 SIN(0 169.7V 50)VIN2 4 0 SIN(0 169.7V 50)VIN3 7 0 SIN(0 169.7V 50)R1 1 2 2R2 4 5 1R3 7 8 8L1 2 3 50UHL2 5 6 50UHL3 8 9 50UHC1 3 0 10UFC2 6 0 10UFC3 9 0 10UF.TRAN 1US 400US.PLOT TRAN V(3) V(6) V(9).PROBE.ENDOUTPUT:RESULT: Analysis of Series RLC Circuit with Sinusoidal Response has beenSuccessfully completed.Department of Electrical & Electronics Engineering – ASTRA
Laboratory ManualElectrical Circuits Simulation7.6.ANALYSIS OF THREE PHASE CIRCUIT REPRESENTING GENERATORTRANSMISSION LINE AND LOADAIM: To analyse three phase currents and the neutral current by the analysis ofthree phase circuit representing the Generator, Transmission line andloads using PSPICE.SOFTWARE REQUIRED: PSPICE – Personal Computer Simulated Programwith Integrated Circuit Emphasis.SYNTAX USED:S.NOTYPE OF SOURCEREPRESENTATIONOF SOURCEDECLARATION FORMATSIN ( Offset Voltage) ( Peak Voltage)( Frequency)( Delay Time) (Damping Factor) ( Phase Delay)1.SINUSOIDAL RESPONSESIN2.TRANSIENT ANALYSIS.TRAN.TRAN TStep Tstop3.PROBE STATEMENT.PROBEIt is a wave form analyzer4.PLOT STATEMENT.PLOT.PLOT (Output Variables) {(Lowerlimit Value), (Upper Limit Value)}DATA REQUIRED FOR DRAWING CIRCUIT DIAGRAM:For example, the circuit consists of Generators, transmission lines and loads. It is fedwith a three phase balanced supply. Arrange the generators in STAR connection and connectthe Transmission lines and loads to it. The generator is having a resistance of 0.5Ω and thetransmission line is having a resistance of 1 Ω and consists of loads having R1 10Ω, R2 10Ω, andR3 10Ω respectively, L1 120mH and C1 120μF. The Sinusoidal having the offset voltage as 0V,RMS voltage as 120V, the frequency as 60Hz, the Delay Time and the Damping Factor are givenas 0 and the Phase angle as 1200. Use PSPICE to plot the instantaneous currents. Plot thetransient response from 0 to 50mseconds with an increment of 5μsecond.CIRCUIT DIAGRAM:Department of Electrical & Electronics Engineering – ASTRA
Laboratory ManualPROGRAM:*VIN1 1 0 SIN(0 169.7V 50)VIN2 2 0 SIN(0 169.7V 50 0 0 120)VIN3 3 0 SIN(0 169.7V 50 0 0 240)RA 1 4 0.5RB 2 5 0.5RC 3 6 0.5RX 4 7 1RY 5 8 1RZ 6 9 1R1 7 10 5R2 8 11 10R3 9 12 10VX 12 0 DC 0V.TRAN 5US 50MS.PLOT TRAN I(RA) I(RB) I(RC).PROBE.ENDOUTPUT:Result:Department of Electrical & Electronics Engineering – ASTRAElectrical Circuits Simulation
Laboratory ManualElectrical Circuits Simulation7.7.PSPICE SIMULATION OF MAXIMUM POWER TRANSFER THEOREM FOR DCCIRCUITSAIM: To find out the unknown resistance and maximum power for dc circuitsSOFTWARE REQUIRED: PSPICE – Personal Computer Simulated Programwith Integrated Circuit Emphasis.Circuit diagtam:Department of Electrical & Electronics Engineering – ASTRA
Laboratory ManualProgram:*VS 1 0 DC 100R1 1 2 10R2 2 0 30R3 1 3 20R4 3 0 40RL 2 3 RLOAD 1.MODEL RLOAD RES(R 25).DC RES RLOAD(R) 0.001 40 0.01.TF V(2,3) VS.PROBE.ENDOutput:Result:Department of Electrical & Electronics Engineering – ASTRAElectrical Circuits Simulation
Laboratory ManualElectrical Circuits Simulation7.8.PSPICE SIMULATION OF RECIPROCITY THEOREM FOR DC CIRCUITSAIM: To verify the reciprocity theorem for dc circuitsSOFTWARE REQUIRED: PSPICE – Personal Computer Simulated Programwith Integrated Circuit Emphasis.Circuit diagtam:Program:FOR MAIN VO.VEND5FOR CIRCUIT 1:*VX 1 2 DC 0VDepartment of Electrical & Electronics Engineering – ASTRA
Laboratory ManualR1 1 3 100R2 3 4 200R3 3 0 470R4 2 0 560R5 4 5 100VDC 5 0 DC 10V.OP.ENDOutput:Result:Department of Electrical & Electronics Engineering – ASTRAElectrical Circuits Simulation
Laboratory ManualElectrical Circuits Simulation7.9.PSPICE SIMULATION OF SUPERPOSITIO THEOREM FOR DC CIRCUITSAIM: To verify the superposition theorem for dc circuitsSOFTWARE REQUIRED: PSPICE – Personal Computer Simulated Programwith Integrated Circuit Emphasis.Circuit diagtam:Department of Electrical & Electronics Engineering – ASTRA
Laboratory ManualProgram:FOR MAIN CIRCUIT :*VDC 1 2 DC 10VR1 1 3 100R2 3 4 200R3 3 6 470R4 2 0 560R5 4 5 100VX 5 0 DC 10VVY 6 0 DC 0V.OP.ENDFOR CIRCUIT 1:*VDC 1 2 DC 10VR1 1 3 100R2 3 4 200R3 3 6 470R4 2 0 560R5 4 0 100VY 6 0 DC 0V.OP.ENDDepartment of Electrical & Electronics Engineering – ASTRAElectrical Circuits Simulation
Laboratory ManualFOR CIRCUIT 2:*VDC 1 2 DC 0VR1 1 3 100R2 3 4 200R3 3 6 470R4 2 0 560R5 4 5 100VX 5 0 DC 10VVY 6 0 DC 0V.OP.ENDOutput:Result:Department of Electrical & Electronics Engineering – ASTRAElectrical Circuits Simulation
Laboratory ManualElectrical Circuits Simulation7.10.PSPICE SIMULATION OF AC CIRCUITSAIM: To calculate the responce for the ac circuits.SOFTWARE REQUIRED: PSPICE – Personal Computer Simulated Programwith Integrated Circuit Emphasis.Circuit diagtam:Department of Electrical & Electronics Engineering – ASTRA
Laboratory ManualProgram:*VS 1 0 AC 10VC1 1 0 100UR1 1 0 100C2 1 0 300UR2 1 0 200.AC LIN 1 50 100.PRINT AC IM(VS) IP(VS) IM(C1) IP(C1).ENDOutput:Result:Department of Electrical & Electronics Engineering – ASTRAElectrical Circuits Simulation
Laboratory Manual8.CONTENT BEYOND SYLLABUS1)2)3)4)5)Simulation of networks theorem using MATLAB.Simulation of compensation theorem using pspice.Simulation of filters using pspice.Simulation of cacaded twoport network using pspice.Simulation of tellagans theorem using pspice.Department of Electrical & Electronics Engineering – ASTRAElectrical Circuits Simulation
Laboratory ManualElectrical Circuits Simulation9. SAMPLE VIVA VOCE QUESTIONSExp:11 The frequency of the voltage in your house is 60 Hz. How much time is required for thewaveform to complete three cycles?2- What is the difference between AC and DC coupling of the oscilloscope? Explain how to usethem to measure the average value of any periodic signal.3- Some meters are calibrated to read r.m.s. Value of sinusoidal waveforms from the basic unitthat responds to the peak value of the waveform. In terms of the peak value, Vp , the meterwill read 2Vp which is the correct r.m.s value for a sinusoidal signal. Can this meter be usedto read the correct rms value for other waveforms like square, triangular, etc? Comment.Exp:21. Define thevenin’s theorem.2. What are the conditions to apply the thevenin’s theorem?3. What is the importance of Thevenin’s theorem?Exp:31.2.3.4.What is sub circuit.What is the importance of sub circuit in simulation.Write the program for the sub circuit.Write the program for the sub circuit of thyristor.Exp:4Department of Electrical & Electronics Engineering – ASTRA
Laboratory ManualElectrical Circuits Simulation1 For a resistance and capacitance in series with a voltage source, show that it is possible todraw a phasor diagram for the current and all voltages from magnitude measurement ofthese quantities only. Illustrate your answer graphically2. The equivalent impedance of a capacitor in series with an inductor is equivalent to a shortcircuit (i.e. equal to zero) at a certain frequency. Derive an expression for this frequency.3. The equivalent impedance of a capacitor in parallel with an inductor is equivalent to an opencircuit (i.e. equal to infinity) at a certain frequency. Derive an expression for this frequencyExp:51.2.3.4.5.6.What is transient analysis.What is stedy state analysis.Explain about rlc ckt.Draw the characteristics of RL .Draw the characteristics of RC.Draw the characteristics of RLCExp:61. What is different between line and phase.2. What is line voltage and phase voltage for star and delta.3. How to measure three phase power using two wattmeter method.4. How to measure three phase power using single wattmeter method.5. How to measure three phase power using three wattmeter method.Exp:71. State the maximum power transfer theorem.2 What are the applications of maximum power transfer theorem?3 What is the difference in the application of maximum power transfer theorem to AC andDC?4 Is it possible to find maximum power in any circuit without drawing its equivalentthevenin’s circuit?Department of Electrical & Electronics Engineering – ASTRA
Laboratory ManualElectrical Circuits SimulationExp:81. What is reciprocity theorem.2. Whatt are the advantages of reciprocity theorem.3. What are the applications of reciprocity theorems.4. What are the disadvantages of reciprocity theorems.Exp:91) Where we can apply superposition theorem?2) What is the importance of reciprocity theorem?3) what is bilateral property of the element?4) What is the node in the circuit? Define branch in the circuit?5) State the superposition theorem and reciprocity theorem.Exp:101. What is AC circuits.2. Draw the phasor diagram of RL CKT.3. Draw the phasor diagram of RC CKT.4. Draw the phasor diagram of RLC CKT.Department of Electrical & Electronics Engineering – ASTRA
Laboratory ManualElectrical Circuits Simulation10 SAMPLE QUESTION PAPER OF THE LAB EXTERNAL1) Verify the Thevenin’s theorem USING PSPICE2) Verify the Norton’s theorem USING PSPICE3) Verify the Maximum Power Transfer Theorems USING PSPICE4) Verify the Super position Theorem and RMS value of Complex wave USING PSPICEDepartment of Electrical & Electronics Engineering – ASTRA
Laboratory Manual5) Verify the Reciprocity, USING PSPICEDepartment of Electrical & Electronics Engineering – ASTRAElectrical Circuits Simulation
Laboratory ManualElectrical Circuits Simulation6) Verify the Millman’s theorem USING PSPICE7) Draw the response of Series and parallel resonance8) Calculate the Z & Y parameters USING PSPICE9) Calculate the Transmission & hybrid parameters USING PSPICEDepartment of Electrical & Electronics Engineering – ASTRA
Laboratory ManualElectrical Circuits Simulation10) Measure the active power for star and delta connected balanced loads USING PSPICE11) Measure the active power for star and delta connected balanced loads USING PSPICE12) Simulate the DC Circuits USING PSPICE13) Simulate the DC Transient Response USING PSPICEDepartment of Electrical & Electronics Engineering – ASTRA
Laboratory ManualElectrical Circuits Simulation11. APPLICATIONS OF THE LABORATORY1. Getting electrical knowledge in home appliances as well as basic theorems in Electricalengineering.2. They will get knowledge about different types of supply systems and different types ofmotors which fall in AC and DC.3. Simulation of some dc and ac circuits.Department of Electrical & Electronics Engineering – ASTRA
Laboratory ManualElectrical Circuits Simulation13. PRECAUTIONS TO BE TAKEN WHILE CONDUCTING THE LABSAFETY – 1 Power must be switched-OFF while making any connections. Do not come in contact with live supply. Power should always be in switch-OFF condition, EXCEPT while you are taking readings. The Circuit diagram should be approved by the faculty before making connections. Circuit connections should be checked & approved by the faculty before switching on thepower. Keep your Experimental Set-up neat and tidy. Check the polarities of meters and supplies while making connections. Always connect the voltmeter after making all other connections. Check the Fuse and it’s ratify. Use right color and gauge of the fuse. All terminations should be firm and no exposed wire. Do not use joints for connection wire.SAFETY – II1.The voltage employed in electrical lab are sufficiently high to endanger human life.2.Compulsorily wear shoes.3.Don’t use metal jewelers on hands.4.Do not wear loose dressDon’t switch on main power unless the faculty gives the permissionDepartment of Electrical & Electronics Engineering – ASTRA
Laboratory ManualDepartment of Electrical & Electronics Engineering – ASTRAElectrical Circuits Simulation
Department of Electrical & Electronics Engineering – ASTRA 2. PREAMBLE: The significance of the Electrical Circuit Simulation Lab is renowned in the various fields of engineering applications. For an Electrical Engineer, it is obligatory to have the practical ideas about