Transcription
UVI Key PerformanceIndicatorsPREPARED FORBoard of TrusteesJune 4, 2016 meetingUniversity of the Virgin Islands1
3
June ReportKey Performance Indicators RETENTION RATE (2B1, 2E6)GRADUATION RATE - 6yrs(2B1)DEGREES AWARDED (2B2)ACADEMIC ACHIEVEMENT(1D)STUDY AWAY (3E1)DEVELOPMENT (6E1)4
Peer InstitutionsInstitutional Peers Alabama A&M UniversityClark Atlanta UniversityLangston UniversityAlbany State UniversityUniversity of GuamUniversity of Turabo, Puerto RicoUniversity of the West Indies – Cave HillWestern New Mexico UniversitySavannah State UniversityOhio State University - Lima CampusAspirational Peers Summary of Criteria used to Select Aspirational and Peer Institutions Degree-granting status Highest degree offered Carnegie Classification Institution size Has full-time first-time undergraduatesSUNY at Purchase CollegeWayne State CollegeOregon Institute of TechnologyDelaware State UniversityUniversity of Hawaii at HiloAlfred UniversityAndrews UniversityUniversity of Wisconsin - SuperiorUniversity of MontevalloThe University of Texas of the PermianBasin5
Goal 2C: Attract More High Achieving students7
Goal 2C: Attract More High AchievingstudentsSAT ScoresFall 2012(Benchmark)Fall 2015(Current Performance)Inst. PeersLow-highAsp. PeersLow-highSAT Critical Reading330-440350-470390-465440-550SAT Math320-420330-440390-465455-560 Source IPEDS: Low-High: 25th – 75th percentileUVI (IR)Percent of First-time StudentsSAT Critical Reading (above 450)SAT Math (above 430)Top ten percent of HS. graduating classFall 2012(benchmark)Fall 2015(current e7%5%6%Goal31%31%24%Yield rate of top achieving students: 33% (63 top 10 percentile applicants admitted, 21 registered)Fall 2012: 399 NF, 340 SAT scores recorded, 70 SAT reading scores above 450 and 72 SAT math scores above 430.Number class percentile recorded: 276, top 10 percentile: 26Fall 2015: 393 NF, 346 SAT scores recorded, 97 SAT reading scores above 450 and 90 SAT math scores above 430.Number class percentile recorded: 149, top 10 percentile: 228
Goal 2C: Goal 2C: Attract More HighAchieving studentsSAT ScoresFall 2012(Benchmark)Fall 2015(Current Performance)Inst. PeersLow-highAsp. PeersLow-highSAT Critical Reading330-440350-470390-465440-550SAT Math320-420330-440390-465455-560 Source IPEDS: Low-High: 25th – 75th percentileUVI (IR)Percent of First-time StudentsSAT Critical Reading (above 450)SAT Math (above 430)Top ten percent of HS. graduating classFall 2012(benchmark)Fall 2015(current e7%5%6%Goal31%31%24%Yield rate of top achieving students: 33% (63 top 10 percentile applicants admitted, 21 registered)Fall 2012: 399 NF, 340 SAT scores recorded, 70 SAT reading scores above 450 and 72 SAT math scores above 430.Number class percentile recorded: 276, top 10 percentile: 26Fall 2015: 393 NF, 346 SAT scores recorded, 97 SAT reading scores above 450 and 90 SAT math scores above 430.Number class percentile recorded: 149, top 10 percentile: 229
Goal 2C: Goal 2C: Attract More HighAchieving studentsSAT ScoresFall 2012(Benchmark)Fall 2015(Current Performance)Inst. PeersLow-highAsp. PeersLow-highSAT Critical Reading330-440350-470390-465440-550SAT Math320-420330-440390-465455-560 Source IPEDS: Low-High: 25th – 75th percentileUVI (IR)Percent of First-time StudentsSAT Critical Reading (above 450)SAT Math (above 430)Top ten percent of HS. graduating classFall 2012(benchmark)Fall 2015(current e7%5%6%Goal31%31%24%Yield rate of top achieving students: 33% (63 top 10 percentile applicants admitted, 21 registered)Fall 2012: 399 NF, 340 SAT scores recorded, 70 SAT reading scores above 450 and 72 SAT math scores above 430.Number class percentile recorded: 276, top 10 percentile: 26Fall 2015: 393 NF, 346 SAT scores recorded, 97 SAT reading scores above 450 and 90 SAT math scores above 430.Number class percentile recorded: 149, top 10 percentile: 2210
Goal 2C: Goal 2C: Attract More HighAchieving studentsSAT ScoresFall 2012(Benchmark)Fall 2015(Current Performance)Inst. PeersLow-highAsp. PeersLow-highSAT Critical Reading330-440350-470390-465440-550SAT Math320-420330-440390-465455-560 Source IPEDS: Low-High: 25th – 75th percentileUVI (IR)Percent of First-time StudentsSAT Critical Reading (above 450)SAT Math (above 430)Top ten percent of HS. graduating classFall 2012(benchmark)Fall 2015(current e7%5%6%Goal31%31%24%Yield rate of top achieving students: 33% (63 top 10 percentile applicants admitted, 21 registered)Fall 2012: 399 NF, 340 SAT scores recorded, 70 SAT reading scores above 450 and 72 SAT math scores above 430.Number class percentile recorded: 276, top 10 percentile: 26Fall 2015: 393 NF, 346 SAT scores recorded, 97 SAT reading scores above 450 and 90 SAT math scores above 430.Number class percentile recorded: 149, top 10 percentile: 2211
Enhanced Retention via Engaging StudentsAIM: Retain students through graduation13
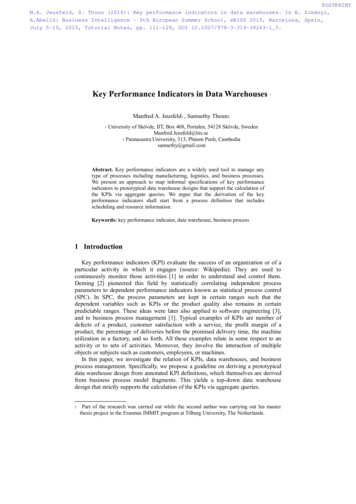
Persistence in STEM: entry levelmathematics success is importantResearch Based Peer Led Team LearningThe averageperception ofconfidence tosolvemathematicsproblems ishigher forstudents whoparticipatedin PLTLsessions thanstudents whodid not(includingstudentsparticipatingin summerresearchprograms).14
Retention Rates (first year to second year)UVI BenchmarkUVI CurrentperformanceFall 2014UVI GoalBy Fall h-Low72%73%82.8%76% - 55%79%-60%Source UVI (IR): Data from the IPEDS reports become available the following yearonly.Peers Institution comparison based on Fall 201415
STEM Retention Rates(first year to second year)UVI BenchmarkUVI Current performanceFall 2014 CohortUVI GoalBy Fall 201773.5%83.8%82.8%Source UVI (IR): Data from the CSRDE reports.Peer information not available16
STEM Retention Rates(first year to second year)UVI BenchmarkUVI Current performanceFall 2014 CohortUVI GoalBy Fall 201773.5%83.8%82.8%Source UVI (IR): Data from the CSRDE reports.Peer information not available17
STEM Success: Males (2015 data)MajorMenWomenTotalProcess Tech (AAS)14115Computer Sci (AAS)11415Biology (BA/BS)44108152Marine Bio (BA/BS)212142Applied Math (ENG)752196Chemistry21012Computer Sci (BS)61768Mathematics8815Math/Sec. Education022Total238184422Percentage56.5%43.5%18
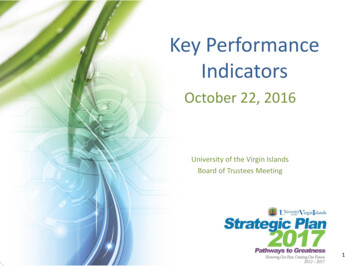
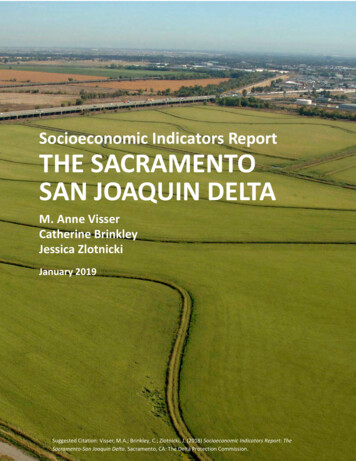
UVI—A gateway to the worldUVIInChinaStudents in the Washington Center ProgramNational Student Exchange students at UVI20
Students Participating in Study Away ProgramsBenchmark*AY 13-14Current PerformanceAY 15-16Goal*Peers34*55*38*N/ASemester Study Abroad: a student is currently at The University of Copenhagen;another student is at Massey University in New Zealand.Exchange Students coming to UVI: A student from The University of Copenhagen is atUVI during the 2016 Spring Semester.National Student Exchange: Three UVI students away in National Student ExchangeSummer Research Abroad (mostly STEM): 20 students in 2013; 22 in 2014; 33 in 2015Boston University (Early Medical School): 4 in 2013; 2 in 2014; 1 in 2015Engineering Students: Approximately 15 students study at a partner institution eachyear.*We have increased the benchmark number. The original was based only on one aspect of studyaway (NSE). It is now more broadly defined.21
Graduation Rate (6yrs) andDegrees Awarded22
Graduation Rate (6yrs)UVI Benchmark Fall2005 CohortUVI CurrentperformanceFall 2008 lPeersHigh-Low31%26%46%41%-6%67%-29%Source IPEDS (IR): Data from the IPEDS reports become available the following yearonly. Cohort: First-time, full-time bachelors seeking students.Peer information for Fall 2009 cohort not yet available.24
Degrees Awarded by LevelUVIAY 13-14%UVIAY 14-15%Inst. PeersMean%Asp. 426%12320%Fall Enrollment range2,3502,3311,056-17,325651-5,560Source IPEDS (IR)25
Degrees Awarded by DisciplineDisciplineEnvironmental and Marine ScienceComputer ScienceEducationEngineering Technologies (PRT)English and LiteratureLiberal Arts and Sciences, HumanitiesBiological and Biomedical SciencesMathematics and StatisticsPhysical SciencesPsychologyCriminal JusticePublic Administration and Social ServicesSocial SciencesMusic EducationNursingBusiness, Management, and AccountingAY 13-1465436AY urce UVI (IR)Comparison with peers is not available26
% Degrees Awarded by DisciplineCOLLEGE/SCHOOLSCIENCE & MATHEMATICSAY 13-14(%) AY 14-15(%)60 (19%)54 (19%)BUSINESS132 (41%)91 (32%)NURSING25 (8%)27 (9%)CLASS62 (19%)66 (23%)EDUCATION43 (13%)32248 (17%)286Source UVI (IR)Comparison with peers is not available27
DEVELOPMENT28
DEVELOPMENTOctober 1, 2015 – May 26, 2016 Total Contributions 580,652-25%ContributedTotalContributions% /-AverageGiftAlumni7% 24,978-49% 56Cabinet33% 4,747-20% 1,187Trustees38% 8,972-54% 1,79429
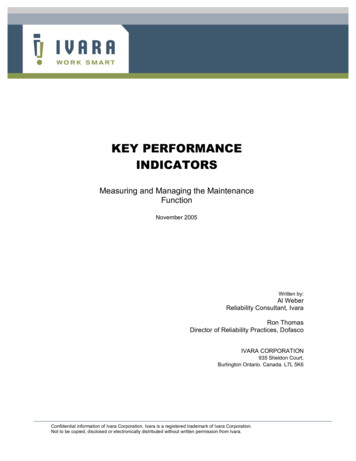
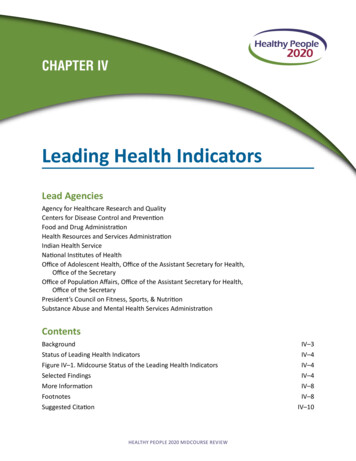
MillionsDEVELOPMENTCUMULATIVE CONTRIBUTIONSOctober 1, 2012 – May 26, 2016161514 11.671212.13 9.64108 5.6264 2.90206E: Expand the funding base of the University through increased philanthropic support. By spring 2018, UVI will raise 15 million in gifts and contributions throughannual giving and the capital campaign. (Data source – UVI and IPEDS)30
Thank you toInstitutional Research and Planning31
Goal 2C: Attract More High Achieving students SAT Scores Fall 2012 (Benchmark) Fall 2015 (Current Performance) Inst. Peers Low-high Asp. Peers Low-high SAT Critical Reading 330-440 350-470 390-465 440-550 SAT Math 320-420 330-440 390-465 455-560 Source IPEDS: Low-High: 25th –75th perc