Transcription
Key PerformanceIndicatorsOctober 22, 2016University of the Virgin IslandsBoard of Trustees Meeting1
Peer InstitutionsInstitutional Peers Alabama A&M UniversityClark Atlanta UniversityLangston UniversityAlbany State UniversityUniversity of GuamUniversity of Turabo, Puerto RicoUniversity of the West Indies – Cave HillWestern New Mexico UniversitySavannah State UniversityOhio State University - Lima CampusAspirational Peers SUNY at Purchase CollegeWayne State CollegeOregon Institute of TechnologyDelaware State UniversityUniversity of Hawaii at HiloAlfred UniversityAndrews UniversityUniversity of Wisconsin - SuperiorUniversity of MontevalloThe University of Texas of the PermianBasin2
Fall ReportKey Performance Indicators ENROLLMENT (6C) ACADEMIC ACHIEVEMENT / TOP ACHIEVINGSTUDENTS (2C) FINANCIAL AID ACADEMIC QUALITY (1A, 1B, 1H, 1K) COMMUNITY ENGAGEMENT AND GLOBALIZATION(3B) DEVELOPMENT3
ENROLLMENT (6C1)EnrollmentTotal EnrollmentFall 2014*Fall 2015*Fall 2016** /-2,3312,3722,4162%*Fall 2014 and Fall 2015: Census data**Fall 2016 Preliminary enrollment as of September 14, 20166C. Increase enrollment across the University. 6C1. By fall 2017, UVI will increase its enrollment by 3 percent annually to a total of 3,000students.5
ENROLLMENT (6C)UVIFall 2016Institutional PeersFall 2014*Aspirational PeersFall 2014*Full-time Students30%50%49%Part-time Students70%50%51%Total Graduate100%100%100%Full-time Students68%74%77%Part-time Students32%26%23%Total Undergraduate100%100%100%Grand Total100%100%100%Enrollment byleveland statusGraduates and FirstProfessionalUndergraduates6C. Increase enrollment across the University.Numbers rounded to nearest whole numberSource IRP – Banner / IPEDS* most recent data, Fall 2015 IPEDS data scheduled to be released early to mid-October6
ENROLLMENT (6C)UVIFall 2016Institutional PeersFall 2014*Aspirational PeersFall 2014*Full-time Students30%50%49%Part-time Students70%50%51%Total Graduate100%100%100%Full-time Students67%74%77%Part-time Students33%26%23%Total Undergraduate100%100%100%Grand Total100%100%100%Enrollment byleveland statusGraduates and FirstProfessionalUndergraduates6C. Increase enrollment across the University.Numbers rounded to nearest whole numberSource IRP – Banner / IPEDS* most recent data7
ENROLLMENT (6C)UVIFall 2016InstitutionalPeersFall 2014AspirationalPeersFall 2014Non-Resident, Non-US Citizen13%2%11%American Indian or Alaskan Native0%1%0%Asian1%2%8%Native Hawaiian or Other Pacific Islander0%2%1%Black or African %42%Two or more races1%0%4%Race Unknown*17%4%6%Total100%100%100%Student DiversityGraduate and Doctorate*Student chose not to self-reportNumbers rounded to nearest whole numberSource IRP – Banner / IPEDS reports6C. Increase enrollment across the University.8
ENROLLMENT (6C)UVIFall 2016InstitutionalPeersFall 2014AspirationalPeersFall 2014Non-Resident, Non-US Citizen13%2%11%American Indian or Alaskan Native0%1%0%Asian1%2%8%Native Hawaiian or Other Pacific Islander0%2%1%Black or African %42%Two or more races1%0%4%Race Unknown*17%4%6%Total100%100%100%Student DiversityGraduate and Doctorate*Student chose not to self-reportNumbers rounded to nearest whole numberSource IRP – Banner / IPEDS reports6C. Increase enrollment across the University.9
ENROLLMENT (6C)Student DiversityUndergraduateNon-Resident, Non-US CitizenAmerican Indian or Alaskan NativeAsianNative Hawaiian or Other Pacific IslanderBlack or African AmericanHispanic/LatinoTwo or more racesWhiteRace Unknown*TotalUVIFall 2016InstitutionalPeersFall 2014AspirationalPeersFall %5%6%49%9%3%5%100%100%100%*Student chose not to self-reportNumbers rounded to nearest whole numberSource: IRP – Banner / IPEDS6C. Increase enrollment across the University.10
ENROLLMENT (6C)Student DiversityUndergraduateNon-Resident, Non-US CitizenAmerican Indian or Alaskan NativeAsianNative Hawaiian or Other Pacific IslanderBlack or African AmericanHispanic/LatinoTwo or more racesWhiteRace Unknown*TotalUVIFall 2016InstitutionalPeersFall 2014AspirationalPeersFall %5%6%49%9%3%5%100%100%100%*Student chose not to self-reportNumbers rounded to nearest whole numberSource: IRP – Banner / IPEDS6C. Increase enrollment across the University.11
ENROLLMENT (6C)Student DiversityUndergraduateNon-Resident, Non-US CitizenAmerican Indian or Alaskan NativeAsianNative Hawaiian or Other Pacific IslanderBlack or African AmericanHispanic/LatinoTwo or more racesWhiteRace Unknown*TotalUVIFall 2016InstitutionalPeersFall 2014AspirationalPeersFall %5%6%49%9%3%5%100%100%100%*Student chose not to self-reportNumbers rounded to nearest whole numberSource: IRP – Banner / IPEDS6C. Increase enrollment across the University.12
ENROLLMENT (6C2)Enrollment byResidencyIn-territoryOut-of-territory -USOut-of-territory InternationalTotal Out-of-territoryFall 2710%n/a15%Source: IRP – Banner6C. Increase enrollment across the University. 6C2. By Fall 2017, UVI will increase to 15% the number of students from outside of theVirgin Islands.13
ENROLLMENT (6C2)Enrollment byResidencyIn-territoryOut-of-territory -USOut-of-territory InternationalTotal Out-of-territoryFall 2710%n/a15%Source: IRP – Banner6C. Increase enrollment across the University. 6C2. By Fall 2017, UVI will increase to 15% the number of students from outside of theVirgin Islands.14
ENROLLMENT (6C2)Enrollment byResidencyIn-territoryOut-of-territory -USOut-of-territory InternationalTotal Out-of-territoryFall 2710%n/a15%Source: IRP – Banner6C. Increase enrollment across the University. 6C2. By Fall 2017, UVI will increase to 15% the number of students from outside of theVirgin Islands.15
ENROLLMENT (6C2)Enrollment byResidencyIn-territoryOut-of-territory -USOut-of-territory InternationalTotal Out-of-territoryFall 2710%n/a15%Source: IRP – Banner6C. Increase enrollment across the University. 6C2. By Fall 2017, UVI will increase to 15% the number of students from outside of theVirgin Islands.16
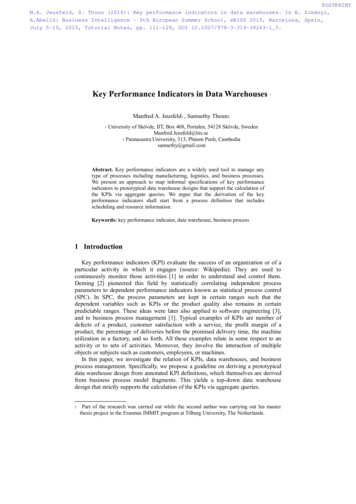
ACADEMIC ACHIEVEMENT2C: Attract more high achieving students to the University.By fall 2015, UVI will increase by 10 percent the number ofstudents who score above 450 on the SAT – Critical Reading.By fall 2015, UVI will increase by 10 percent the number ofstudents who score above 430 on the SAT MathBy fall 2016 UVI will increase by 15 percent the number ofstudents who rank in the top 10 percent of their graduating class.Yield rate of top achieving students17
ACADEMIC ACHIEVEMENT (2C)SAT ScoresFall 2012(Benchmark)Fall 2016(Current Performance)Inst. PeersLow-highAsp. PeersLow-highSAT Critical Reading330-440370-490394-470441-568SAT Math320-420330-460383-463441-567 Source IPEDS: Low-High: 25th – 75th percentileUVI (IR)Percent of First-time StudentsSAT Critical Reading (above 450)SAT Math (above 430)Top ten percent of HS. graduating classFall 2012(benchmark)Fall 201521%21%9%28%26%14%Fall 2016% Goal31%31%24%Yield rate of top achieving students: 26% (133 top 10 percentile applicants admitted, 35 registered)Fall 2012: 399 NF, 340 SAT scores recorded, 70 SAT reading scores above 450 and 72 SAT math scores above 430.Number class percentile recorded: 276, top 10 percentile: 26Fall 2016: 348 NF, 215 SAT scores recorded, 65 SAT reading scores above 450 and 58 SAT math scores above 430.Number class percentile recorded: 254, top 10 percentile: 3518
ACADEMIC ACHIEVEMENT (2C)SAT ScoresFall 2012(Benchmark)Fall 2016(Current Performance)Inst. PeersLow-highAsp. PeersLow-highSAT Critical Reading330-440370-490394-470441-568SAT Math320-420330-460383-463441-567 Source IPEDS: Low-High: 25th – 75th percentileUVI (IR)Percent of First-time StudentsSAT Critical Reading (above 450)SAT Math (above 430)Top ten percent of HS. graduating classFall 2012(benchmark)Fall 201521%21%9%28%26%14%Fall 2016% Goal31%31%24%Yield rate of top achieving students: 26% (133 top 10 percentile applicants admitted, 35 registered)Fall 2012: 399 NF, 340 SAT scores recorded, 70 SAT reading scores above 450 and 72 SAT math scores above 430.Number class percentile recorded: 276, top 10 percentile: 26Fall 2016: 348 NF, 215 SAT scores recorded, 65 SAT reading scores above 450 and 58 SAT math scores above 430.Number class percentile recorded: 254, top 10 percentile: 3519
ACADEMIC ACHIEVEMENT (2C)SAT ScoresFall 2012(Benchmark)Fall 2016(Current Performance)Inst. PeersLow-highAsp. PeersLow-highSAT Critical Reading330-440370-490394-470441-568SAT Math320-420330-460383-463441-567 Source IPEDS: Low-High: 25th – 75th percentileUVI (IR)Percent of First-time StudentsSAT Critical Reading (above 450)SAT Math (above 430)Top ten percent of HS. graduating classFall 2012(benchmark)Fall 201521%21%9%28%26%14%Fall 2016% Goal31%31%24%Yield rate of top achieving students: 26% (133 top 10 percentile applicants admitted, 35 registered)Fall 2012: 399 NF, 340 SAT scores recorded, 70 SAT reading scores above 450 and 72 SAT math scores above 430.Number class percentile recorded: 276, top 10 percentile: 26Fall 2016: 348 NF, 215 SAT scores recorded, 65 SAT reading scores above 450 and 58 SAT math scores above 430.Number class percentile recorded: 254, top 10 percentile: 3520
ACADEMIC ACHIEVEMENT (2C)SAT ScoresFall 2012(Benchmark)Fall 2016(Current Performance)Inst. PeersLow-highAsp. PeersLow-highSAT Critical Reading330-440370-490394-470441-568SAT Math320-420330-460383-463441-567 Source IPEDS: Low-High: 25th – 75th percentileUVI (IR)Percent of First-time StudentsSAT Critical Reading (above 450)SAT Math (above 430)Top ten percent of HS. graduating classFall 2012(benchmark)Fall 201521%21%9%28%26%14%Fall 2016% Goal31%31%24%Yield rate of top achieving students: 26% (133 top 10 percentile applicants admitted, 35 registered)Fall 2012: 399 NF, 340 SAT scores recorded, 70 SAT reading scores above 450 and 72 SAT math scores above 430.Number class percentile recorded: 276, top 10 percentile: 26Fall 2016: 348 NF, 215 SAT scores recorded, 65 SAT reading scores above 450 and 58 SAT math scores above 430.Number class percentile recorded: 254, top 10 percentile: 3521
ACADEMIC ACHIEVEMENT (2C)SAT ScoresFall 2012(Benchmark)Fall 2016(Current Performance)Inst. PeersLow-highAsp. PeersLow-highSAT Critical Reading330-440370-490394-470441-568SAT Math320-420330-460383-463441-567 Source IPEDS: Low-High: 25th – 75th percentileUVI (IR)Percent of First-time StudentsSAT Critical Reading (above 450)SAT Math (above 430)Top ten percent of HS. graduating classFall 2012(benchmark)Fall 201521%21%9%28%26%14%Fall 2016% Goal31%31%24%Yield rate of top achieving students: 26% (133 top 10 percentile applicants admitted, 35 registered)Fall 2012: 399 NF, 340 SAT scores recorded, 70 SAT reading scores above 450 and 72 SAT math scores above 430.Number class percentile recorded: 276, top 10 percentile: 26Fall 2016: 348 NF, 215 SAT scores recorded, 65 SAT reading scores above 450 and 58 SAT math scores above 430.Number class percentile recorded: 254, top 10 percentile: 3522
FULL-TIME, FIRST-YEAR STUDENTSRECEIVING VAL & SAL SCHOLARSHIPSSource: UVI BannerVal & Sal ScholarshipsFall 2016Fall 2015Fall 2014Fall 2013Fall 2012129101310Source UVI Banner23
Honors Program Director: Dr. Emily Allen Williams, Dean of College ofLiberal Arts and Social Sciences Freshman students participating from bothcampuses (20 total) Inaugural lecture series: The Different Faces ofLeadership– Dr. John Rudley, President Emeritus and Immediate PastPresident of Texas Southern University, October 28th.24
FINANCIAL AID COMPARATIVE DATA25
FULL-TIME, FIRST-YEAR STUDENTSRECEIVING FINANCIAL AIDSource: IPEDS ReportsAid Year14-15Aid Year13-14AverageInstitutional PeersAid Year 13-14AverageAspirational PeersAid Year 13-1466%63%73%39%Pell Grants66%63%73%39%Other Federal Grants6%4%12%12%Val and Sal Scholarships3%3%N/AN/AInstitutional scholarships37%32%26%66%Federal Loans to Students36%40%65%60%Federal, State, Local or InstitutionalAid79%77%86%82%Any Type of Financial Aid*86%86%93%93%Federal Grants*Drop from 91% in AY 11-1226
FULL-TIME, FIRST-YEAR STUDENTSRECEIVING FINANCIAL AIDSource: IPEDS ReportsAid Year14-15Aid Year13-14AverageInstitutional PeersAid Year 13-14AverageAspirational PeersAid Year 13-1466%63%73%39%Pell Grants66%63%73%39%Other Federal Grants6%4%12%12%Val and Sal Scholarships3%3%N/AN/AInstitutional scholarships37%32%26%66%Federal Loans to Students36%40%65%60%Federal, State, Local or InstitutionalAid79%77%86%82%Any Type of Financial Aid*86%86%93%93%Federal Grants*Drop from 91% in AY 11-1227
FULL-TIME, FIRST-YEAR STUDENTSRECEIVING FINANCIAL AIDSource: IPEDS ReportsAid Year14-15Aid Year13-14AverageInstitutional PeersAid Year 13-14AverageAspirational PeersAid Year 13-1466%63%73%39%Pell Grants66%63%73%39%Other Federal Grants6%4%12%12%Val and Sal Scholarships3%3%N/AN/AInstitutional scholarships37%32%26%66%Federal Loans to Students36%40%65%60%Federal, State, Local or InstitutionalAid79%77%86%82%Any Type of Financial Aid*86%86%93%93%Federal Grants*Drop from 91% in AY 11-1228
ACADEMIC QUALITY1A: Increase faculty productivity and effectiveness by expandingresearch and faculty scholarship expectations and opportunities.1B: Increase the number of academic programs at the graduate andundergraduate levels.1H: Number of professionally accredited programs.1K: Online course and degree programs29
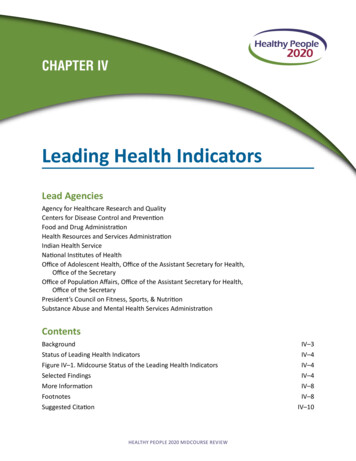
NUMBER OF FACULTY PUBLICATIONSAY 12-13Goal 10%AY 14-15AY 15-1624262072ARSA – Provost’s Report – 2013 JuneARSA – Provost’s Report – 2015 MarchARSA – Provost’s Report – 2015 OctoberARSA – Provost’s Report – 2016 MarchBoard of Trustees Report – Pres Report 2012 October1A: Increase faculty productivity and effectiveness by expanding research andfaculty scholarship expectations and opportunities. By spring 2016, UVI faculty will increase the number of faculty publications by10 percent over current numbers30
NUMBER OF FACULTY PUBLICATIONSAY 12-13Goal 10%AY 14-15AY 15-1624262072ARSA – Provost’s Report – 2013 JuneARSA – Provost’s Report – 2015 MarchARSA – Provost’s Report – 2015 OctoberARSA – Provost’s Report – 2016 MarchBoard of Trustees Report – Pres Report 2012 October1A: Increase faculty productivity and effectiveness by expanding research andfaculty scholarship expectations and opportunities. By spring 2016, UVI faculty will increase the number of faculty publications by10 percent over current numbers31
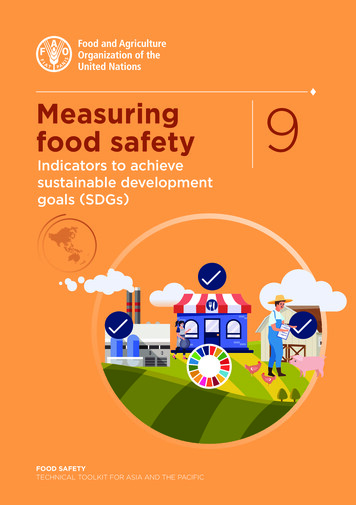
ACADEMIC QUALITY: Number 1692874484816-175311145148GoalSource: UVI Catalog. /current/Chapter10-St Thomas st/Catalog/current/Chapter9-Albert A Sheen Campus.pdf1B1: Increase the number of academic programs at the graduate and undergraduate levels. By fall 2017, UVI will increase by five the number of programs at the graduate andundergraduate levels.32
ACADEMIC QUALITY: Number 1692874484816-175311145148GoalSource: UVI Catalog. /current/Chapter10-St Thomas st/Catalog/current/Chapter9-Albert A Sheen Campus.pdf1B1: Increase the number of academic programs at the graduate and undergraduate levels. By fall 2017, UVI will increase by five the number of programs at the graduate andundergraduate levels.33
ACADEMIC QUALITY: Number 1692874484816-175311145148GoalSource: UVI Catalog. /current/Chapter10-St Thomas st/Catalog/current/Chapter9-Albert A Sheen Campus.pdf1B1: Increase the number of academic programs at the graduate and undergraduate levels. By fall 2017, UVI will increase by five the number of programs at the graduate andundergraduate levels.34
First cohort—51 students in the PhD Program inCreative Leadership for Innovation and Change35
NUMBER OF PROFESSIONALLYACCREDITED PROGRAMS (1H)School of Education: Accreditation was confirmed – Goal Achieved.School of Business: Accreditation was confirmed as of May 2014 – Goal achievedCollege of Science and Mathematics: Computer Science Programs The Readiness Review Request for Accreditation was submitted on August 30th,2016 for the 2017-2018 review cycle.1H: Obtain accreditation of the business, education, and computer programs 1H1. By spring 2016, UVI will receive ACBSP accreditation for the School of Business. 1H2. By Spring 2017, UVI will receive NCATE accreditation for the School of Education. 1H3. By fall 2015, UVI will receive ABET accreditation for the Computer Science Program.36
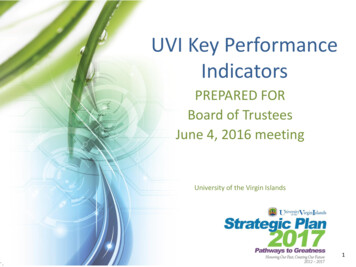
NUMBER OF ONLINE COURSES &DEGREE PROGRAMS OFFERED (1K)AY 12-13GoalAY 15-16Number of online Sections104114204Number of online Courses74811111K. Increase enrollment through the offering of online bachelor, associate, and mastersprograms. 1K1. By spring 2017, UVI will implement three online degree programs. 1K2. By spring 2015, UVI will increase by 10 percent the number of its courses offeredonline.37
NUMBER OF ONLINE COURSES &DEGREE PROGRAMS OFFERED (1K)AY 12-13GoalAY 15-16Number of online Sections104114204Number of online Courses74811111K. Increase enrollment through the offering of online bachelor, associate, and mastersprograms. 1K1. By spring 2017, UVI will implement three online degree programs. 1K2. By spring 2015, UVI will increase by 10 percent the number of its courses offeredonline.38
COMMUNITY ENGAGEMENTAND GLOBALIZATION (3B)3B: Develop and implement a formal mentorship program betweenUVI personnel and identified community groups.39
GLOBALIZATION UVI has various initiatives aimed at bringing aglobal perspective to the campus:– Passport to the World initiative: faculty, students,staff experience a new culture through service andeducation exchange. 2015: China 2016: India 2017: Denmark– Memoranda of Understanding with universities in45 different countries40
DEVELOPMENT41
DEVELOPMENTOctober 1, 2015 – September 07, 2016 Total Contributions 1,311,221-28%ContributedTotalContributions% /-AverageGiftAlumni13% 63,746-14% 70Cabinet81% 9,713 1,728Trustees83% 23,788 1,163 School of Medicine - Eleven (11) Donors have pledged 2,643,000.00for the School of Medicine.Alumni Pledges - 817 alumni have pledged 47,850.60 through thealumni call program.42
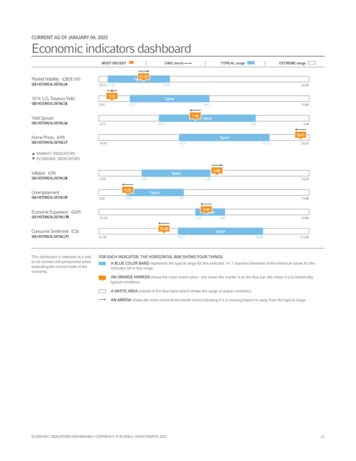
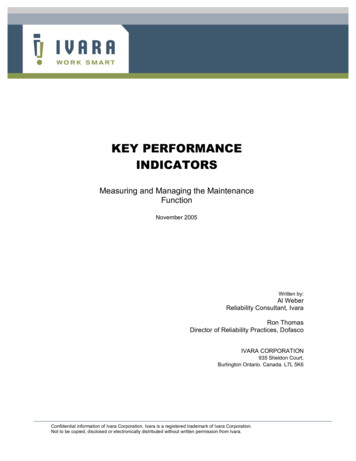
MillionsDEVELOPMENTCUMULATIVE CONTRIBUTIONSOctober 1, 2012 – September 07, 2016161514 12.82 11.6712 9.64108 5.6264 2.90206E: Expand the funding base of the University through increased philanthropic support. By spring 2018, UVI will raise 15 million in gifts and contributions throughannual giving and the capital campaign. (Data source – UVI and IPEDS)43
ACADEMIC ACHIEVEMENT (2C) SAT Scores Fall 2012 (Benchmark) Fall 2016 (Current Performance) Inst. Peers Low-high Asp. Peers Low-high . SAT Math (above 430) 21% 26% 27% 6% 31% Top ten percent of HS. graduating class 9% 14% 14% 5% 24% Fall 2012: 399 NF, 340 SAT scores recorded, 70 SAT reading scores above 4