Transcription
Diffraction-Induced Stray Light in InfraredMicrospectroscopy and Its Effect on Spatial ResolutionA. J. S O M M E R * and J. E. K A T O NMolecular Microspectroscopy Laboratory, Department of Chemistry, Miami University, Oxford, Ohio 45056Model experiments were conducted in nn effort to quantitatively assessthe extent of stray light, resulting from diffraction, in an FT-IR microscope system. The effects of stray light were studied under conditionsemploying different aperturing modes, aperture sizes, and wavelengthsof light. Results and consequences of the findings are discussed withrespect to the spatial resolution and quantitative integrity of the dataobtainable in mapping analyses of muitilayer polymer laminates.Index Headings: Infrared microspectroscopy; Polymer laminates; Mapping analysis; Diffraction effects; Spatial resolution; Quantitative analysis.INTRODUCTIONInfrared microspectroscopy is widely employed for theanalysis of individual layers in cross-sectioned multilayerpolymer laminates. By optical isolation of the layer ofinterest with a remote aperture, it can easily be analyzedwith minimal interference from neighboring layers provided that the thickness of the layer is on the order of100 micrometers or larger. If the thickness of the layeris less than this dimension, the ability to obtain spectrawithout interference from neighboring layers becomesmore difficult. This difficulty arises from diffraction effects associated with the various optical components ofthe microscope. As a result, the image of the infraredsource and/or sample is redistributed to areas outsidethat defined by the aperture. Consequently, the spectrum of the single layer will be contaminated with spectral features from neighboring layers. The current trendin mapping analyses by infrared microspectroscopy dictates that quantitative or, at the very least, semi-quantitative data be obtained. The significance of these datais therefore dependent on knowing (1) the extent to whichdiffraction affects the spatial resolution and (2) the conditions needed to minimize diffraction.Although diffraction theory can be employed to yielda qualitative relationship between wavelength, numerical aperture, and spectral interferences, a quantitativeanalysis requires the use of a more detailed theory ormodel experiments. In this investigation we report onmodel experiments which quantitatively assess the straylight produced in an infrared microscope. A comparisonof single apertures, both before and after the sample, anddual apertures is made with regard to stray light effects.The effect of wavelength is also studied. Consequencesof the findings will be discussed with regard to spatialresolution in the analysis of multilayer laminates andsamples embedded in a host matrix. Diffraction theorywill be used only in a qualitative sense to explain someof the important relationships and observations.Received 1 April 1991; revision received 14 June 1991.* Author to whom correspondence should be sent.Volume 45, Number 10, 1991EXPERIMENTALInfrared spectra were collected on a Spectra Tech IRP L A N t microscope integrated with a Perkin-ElmerModel 1800 Fourier transform infrared spectrophotometer. The spectrophotometer uses a proprietary heatedwire source operated at 1050 C, and a germanium-overcoated potassium bromide beamsplitter. Microscope optics included a 15 x (N.A. 0.58) objective, a 10 (N.A. 0.71) condenser, and a liquid-nitrogen-cooled, narrowband, mercury-cadmium-telluride (HgCdTe) detector.The detector was dedicated to the microscope and hadan active area of 250 x 250 um. Rectangular apertureswere employed to isolate the samples and were fixed tothe microscope to prevent alignment errors. Positioningof the sample was done manually in either brightrfieldor reflected light with the use of the existing illuminators.The entire optical path of the microscope was purgedwith nitrogen.Double-sided interferograms were collected at 8 cm -1resolution with a mirror velocity of 1.5 cm/s. Two hundred fifty-six scans (two-minute data collect) were coadded for both the reference and sample. Interferogramswere self-corrected for phase errors with the use of 128points on either side of the centerburst. Transformationof these interferograms into spectra was performed witha fast Fourier transform and a medium Beer-Nortonapodization function. All experimental results were obtained over a two-day period'to minimize instrumentinstability. The signal-to-noise ratio (S/N) for the microscope system, determined after the experiments, was4400 to 1 based on peak-to-peak noise. This value wasdetermined with the use of a 100-#m pinhole as the sample and apertures both before and after this sample. Scanconditions for the S/N determination were as statedabove.The sample employed for this investigation was a freestanding film of cellulose acetate. The film was preparedby drawing an acetone solution of the material across aglass slide with the side of a glass pipette. Prior to application of the solution, a trough was formed on theglass slide by affixing Scotch1: tape to both edges. Afterdrying, the film could be cut to the desired dimensionand peeled off the glass substrate. The film was mountedover a 6-mm-diameter circular opening in a black anodized aluminum slide. Positioning of the film was suchthat the film covered only half of the opening. Film thicknesses were controlled by adjusting the concentration ofthe solution to yield an infrared spectrum of the film int IRPLAN is a registered trademark of Spectra Tech, Inc. Scotch brand tape is a registered trademark of 3M Corporation.0003-7028/91/4510-163352.00/0 1991Societyfor AppliedSpectroscopyAPPLIED SPECTROSCOPY1633
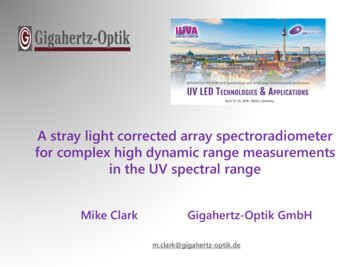
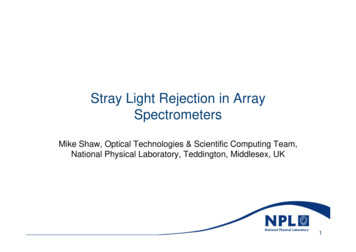
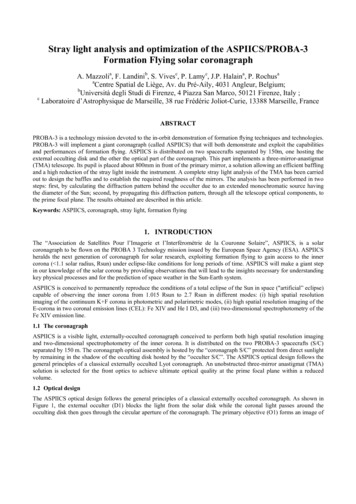
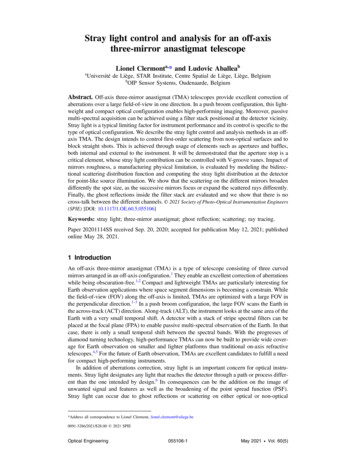
physical dimensions of the aperture, the distance of thescreen from the aperture, and the wavelength of light: 21.22hR(1)2aHere r is the radius of the Airy disk, a is the radius ofthe aperture, h is the wavelength of light, and R is relatedto the distance between the screen/3 and the aperture.If a lens is placed in the aperture, as in Fig. 1B, the radiusof the Airy disk can be described in terms of the physicalcharacteristics of the lens: 21.22X/r - (2)DrAfor f approximately equal to R. Here f is the focal lengthof the lens, and D is the diameter of the lens. The morefamiliar form of the equation for high-magnification lenses relates the numerical aperture (N.A.) of the lens tothe Airy disk as:1.22Xr - (3)2 N.A."FIG. 1.(A and B) Diffraction at a circular aperture.which the transmittance extremes were 100 and 20%.The same film sample was employed for the entire investigation, and its edge roughness did not exceed 0.5/.tm.RESULTS AND DISCUSSIONUnder normal sampling conditions (i.e., samples whosesizes are twice the diffraction limit for the given system)the effects of diffraction are minimal. However, whenspatial resolution and quantitative interpretation arepushed to the extremes, diffraction becomes a significantproblem. Fresnel diffraction describes the interaction oflight waves with various optical elements. A special caseof Fresnel diffraction is Fraunhofer diffraction, whichrequires the light waves .to be plane or collimated. Bydefinition, the type of diffraction which occurs in theinfrared microscope is Fresnel since the light is not exactly collimated. However, if the diffracting object is ata distance from the observation point which is muchgreater than the ratio of d2/ , where d is the diameter ofthe diffracting object and X is the wavelength of light,the diffraction effects may be qualitatively expressed bythe relationships describing Fraunhofer diffraction. 1Figure 1A illustrates plane waves passing through anaperture c of radius a. The far field diffraction patternobserved on the screen/3 takes the form of the familiarAiry diffraction pattern illustrated in Fig. lB. The central bright spot or maximum of this pattern is called theAiry disk. Its radius can be described in terms of the1634Volume 45, Number 10, 1991Diffraction and its effects can arise in an infrared microscope from many different sources. Several reportshave been published showing the effects of diffractionproduced by the sample, by improper aperturing, bywavelength, and by the central obscuration present inthe reflecting objectives employed in the microscope2 -9The analyst has very little control over these sources,with the exception of the type of aperturing and, to acertain extent, the wavelength chosen for analysis. Insome instances the sample can be manipulated (e.g.,oblique microtoming) to yield enhanced separation ofthe layers.Tracing a light ray through the optical train of theI R P L A N microscope illustrates that diffraction occursat several optical components employed to isolate thesample of interest. Figure 2 shows the configuration ofthese optical components. First, the infrared source inthe spectrometer is focused to a 3-mm-diameter imageat the aperture before the sample. Diffraction of thesource by this aperture occurs as a result of decreasingthe aperture size to facilitate the analysis of samplessmaller than 200 gm. For example, if an 8-gm-diametersample is to be analyzed, the size of the aperture shouldbe 15 x larger, or 120 gm (i.e., the aperture size is theproduct of the sample size and objective magnification).Since the aperture size required to analyze the 8-#mdiameter sample is significantly smaller than the imageof the source, diffraction will arise, as depicted in Fig.1A. The light rays will further experience diffraction onbeing imaged from the aperture to the sample plane bythe objective. If a point source is placed at the apertureinstead of the extended infrared source image, the bestand smallest diffraction-limited dimension obtainable atthe sample plane is dictated by the N.A. of the objectiveand the wavelength of light in accordance with Eq. 3.For 9.5-gm-wavelength light and an N.A. of 0.58, thediameter of the diffraction-limited image formed at thesample plane is 20 ttm. Once again, diffraction will spreadlight into an area larger than that of the sample forsample diameters of 20 ttm or less.Similar diffraction occurs by imaging the sample
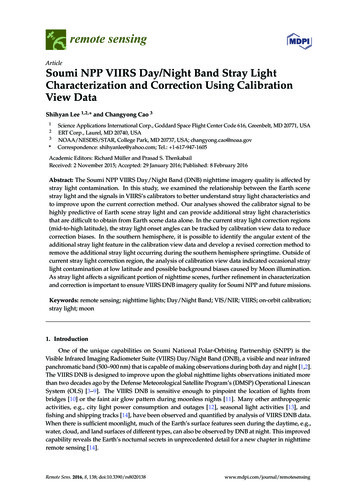
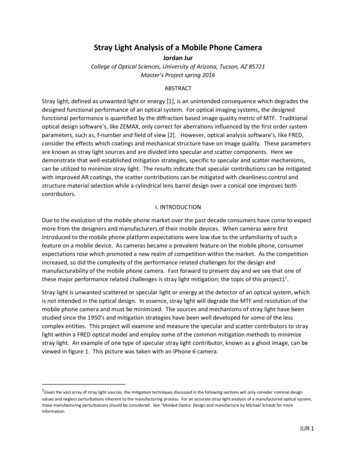
Preaperture(aperture before sample)8 mE:::LObjective(15X, N.A. 0.58)free standingcelluloseacetatefilm0II48II12 16IIIII,,,,20 24 28 32 36 40 44 48 52 56distanceawayfrom edgeof rectangularaperture (micrometers)Sample planeCondenser(IOX, N.A. 0.71)Postaperture(aperture after sample)FIG. 2.Optical configuration of the IRPLAN microscope.through the remaining elements of the optical train tothe detector. For a self-luminous point sample imagedonto the aperture after the sample by the condenser, thebest or smallest image formed at the aperture is determined by the product of the diffraction-limited dimension from Eq. 3 and the condenser magnification. 1 Thus,a 163-#m-diameter image of the point source is formedat the aperture after the sample. From a considerationof the condenser magnification of 10 , analysis of an8-#m-diameter sample would dictate that the apertureafter the sample be 80 gm in diameter. Here again, theaperture is significantly smaller than the diffractionlimited diameter of the self-luminous point source. Asa result, considerable diffraction will occur at the aperture.As Messerschmidt points out, 5 the situation is somewhat worse for the following reasons: The relationshipdeveloped in the first few paragraphs describe theradius of the Airy disk. The Airy disk is defined as thecentral bright spot or light maximum and contains only84% of the energy associated with the original source.The remaining energy is distributed in the lobes whichoccur at larger radii and, subsequently, areas outside thatdefined by the imaging elements. Second, the relationships are valid for an infinitely small point source or selfluminous sample being imaged through each of the optical components. In reality, the source and the samplehave finite dimensions--which tends to broaden the Airydiffraction pattern still further.From the above considerations it can be seen that theFIG. 3. Sample configuration employed to generate stray radiationprofiles.spatial profile of the source image or sample image isconsiderably altered on being imaged through the entireoptical train of the microscope. By the time the imageof the source reaches the sample it has undergone diffraction at the aperture, the objective, and the centralobscuration of the objective. The image of the sampleundergoes similar diffraction effects on being imagedthrough the optical train to the detector. As a result, thediffraction of the source and/or sample image throughthe microscope yields a spread function for the entiremicroscope which is the superposition of the diffractionpatterns from each imaging element in the system. Thespread function defines the extent to which a point source,imaged through an optical element, spreads outside itsdefined boundary.Knowing the spread function of the individual opticalcomponents in the infrared microscope is not importantfrom the analyst's standpoint since most, if not all, elements are employed during a measurement. Knowingthe spread function for the entire microscope systemunder different conditions is important because it willallow the true spatial resolution of the system to be determined. Figure 3 schematically illustrates the methodby which radiation falling outside the sample area defined by the system was determined. In an initial experiment, an 8 x 240 m aperture placed between the sourceand the sample was used to collect a background spectrum. The left-most edge of the free-standing celluloseacetate film was then stepped away from the right-mostedge of the aperture image, and transmission spectrawere collected at each position. Theoretically, if no diffracted light is present outside the area defined by theaperture, a true 100% transmittance line should be observed. Figure 4 shows a reference infrared spectrum ofthe cellulose acetate film recorded within the 8 x 240#m aperture. Figure 4 also illustrates spectra of the samefilm but with its edge located next to and 40 m awayfrom the edge of the aperture image, respectively. Theselatter two spectra clearly demonstrate that diffractedradiation is present in areas outside that defined by theaperture. Perhaps the most surprising result is that absorptions attributed to the cellulose acetate film can beobserved when the edge of the film is 40 m away fromthe edge of the aperture image. The spectra also showthat this stray radiation has larger components at longerAPPLIED S P E C T R O S C O P Y1635
ENCE21.514000IIII3500@00025002000I10007001000700 m - 197. ggIT86.08NEXT TO 8.98H40 MICROMETERS 000n700c,m-1Fla. 4. Spectra of ce ulose acetate film obtained with 8 240 pm apertures be re the sample. (Top) re rence; (middle) film edge aligned withedge of aperture image; (bottom) film edge aligned 40 pm away om edge of aperture image.wavelengths. A comparison of the intensity of the C-O-Casymmetric stretch to that of the C O stretch in eachspectrum shows that the intensity of the C-O-C stretchis much stronger in the spectra obtained outside the areadefined by the aperture. This simple example clearlyshows that, if steps are not taken to determine the extentof diffraction, the results of a mapping type analysis will1636V o l u m e 45, N u m b e r 10, 1991not be very reliable unless the individual layers of a crosssectioned laminate are nearly 100 #m thick or larger. Thesame criterion holds true for an isolated particle embedded in a surrounding matrix. This latter situation is evenmore severe since the sample geometry is such that diffraction is occurring in two dimensions. In the presentinvestigation the aperture dimension corresponding to
13.%J 12.0 o 8 X 240z 24 X 240a 40 X 24011.0t\10"01 \g'oI 8.0.\oD 7.0,O8.0' ',,, o:33o) ,oCLU\2.0o 1.0(Da ""'oo)8 12 18 20 24 28 32 36 40 44 48D i s t a n c e o f R p e r t u r e from C e n t e r in M i c r o m e t e r s00 o4812I82024D i s t a n c e o f Fi Im Edge fFom283238Aperture4044ImageFIG.5. Sourceprofilesformedat the sampleplane for variousaperturesizes (aperture placed before sample).FIG. 6. Percent of stray energy outside area defined by aperture forvarious aperture sizes (apertures placed before and after sample).the y-axis was purposely made much larger than thex-dimension so that diffraction in the x-dimension woulddominate. This configuration is also consistent with thoseemployed for the analysis of multilayer laminates.A second experiment was conducted to determine theprofile of the source image formed at the sample planewhen various aperture sizes before the sample were employed. In this experiment no polymer film was used.The profiles were obtained by setting the aperture beforethe sample to the desired size and centering this aperturein the field of view. The aperture after the sample wasthen set to a size of 8 x 240 m and used to analyzediscrete (8- m) sections of the source image at the sampleplane. These measurements were done by maintainingthe aperture before the sample at a fixed position andtranslating the 8 x 240 m aperture after the sampleaway from the center of the field of view in 4- m steps.Figure 5 shows the results of these experiments, whichare plotted as a function of energy and distance of theaperture after the sample away from the center of thefield of view.Aperture settings before the sample of 8, 24, and 40 m represent sample diameters which are below, slightlylarger than, and above the diffraction-limited dimensions, respectively. The diffraction-limited dimensionsare dictated by Eq. 3 with an objective N.A. 0.58 anda wavelength of 9.5 m. Ideally, the source profile formedat the sample plane for the various aperture settingsshould be an edge or step function. The general shapeof the curves indicates that aperture dimensions abovethe diffraction limit (e.g., 40 um) more closely approximate an edge function, as described by Messerschmidt2At dimensions below the diffraction limit, the image profile takes on the shape of the Airy pattern. At the diffraction limit, the profile is somewhat intermediate between an edge function and the Airy pattern. The verticallines drawn for each curve in Fig. 5 delineate the position(i.e., the image of the aperture edge) at which the energyshould drop to zero, assuming an ideal edge function. Asa result of diffraction, stray energy extends past this edgeand illuminates those areas not defined by the aperture.The problem is most severe for the 8- m aperture setting,which demonstrates that a larger percentage of energyis redistributed to areas not defined by the aperture. Oncomparison, as the aperture dimension is increased, thepercentage of stray energy present outside the edge ofthe aperture image is reduced. Figure 5 also illustratesthe profile of the imaged source when the aperture beforethe sample is completely open. The fluctuations, or ringing, in this profile at different locations are normal fordiffraction at a high contrast edge. 1 In order to quantitatively assess the stray energy present past the edge of the aperture image, the initial experiment employing the polymer film was conducted withthe use of different aperture sizes and aperturing modes.As a further illustration of the significance of these experiments in terms a spectroscopist can easily digest, theintegrated intensity of the C-O-C absorption (9.5 m,1050 cm -1) in those spectra obtained outside the aperturewas ratioed to that of the reference spectrum obtainedwithin the aperture. This ratio was then plotted as afunction of the distance of the film edge from that of theaperture image. The ratios are the average of three different measurements taken at each position. The uncertainty in the ratios does not exceed 0.5%.Figure 6 illustrates the data collected for three different aperture dimensions with apertures both before andafter the sample. The curves clearly demonstrate thatthe amount of stray radiation, present outside the areadefined by the apertures, becomes larger as the dimension of the apertures decreases. Again the surprising result is that noticeable (i.e., 1-2 % ) stray radiation is present when the film edge is 24 um away from the edge ofthe aperture image. A common practice in infrared microspectroscopy is to over-aperture the sample to ensurethat spectral impurities from neighboring samples areminimized. These data demonstrate that, for smallsamples (samples less than 40 m in diameter), overaperturing will actually increase spectral impurities fromneighboring samples.Figure 7 illustrates the percent of diffracted light present outside the areas defined for apertures (8 x 240 m)placed before the sample, after the sample, and bothbefore and after the sample. The results demonstratethat a significant amount of stray light is present whenonly the aperture after the sample is employed. At 36APPLIED SPECTROSCOPY1637
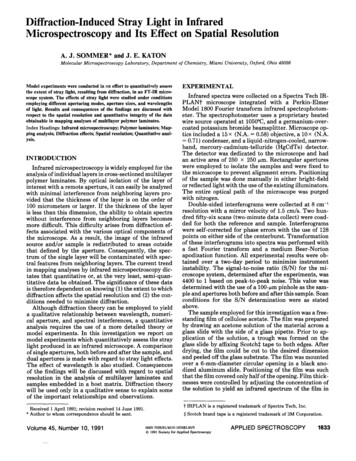
1.00.30.012, 27.5 ,O 25.0A 8 X 240 Rftero.o \ \ %o 8 X 240 Dual Remoten 8 X 240 Beforee .5,(D17.5o15.o0.50.,\0.25,12.5,w7.55.0z z r---.(1) 0.0,,,,j,8 gm, u o o - - o4 8 12 IB 20 24 2B 32 38 40 44Distance of Fi Inn Edge from RpeFtuFe ImegeFIG. 7. Percent of stray energy outside area defined by aperture forvarious aperturing modes (8 x 240 m aperture size). m away from the edge of the aperture image, more than2 % of stray radiation is detected. Employing only theaperture before the sample reduces the amount of straylight reaching the detector. This reduction is such that2 % is observed at only 24 #m away from the aperture,and at 32 m away from the aperture the amount ofimpure or stray radiation has dropped to well below 1%.Employing apertures both before and after the samplereduces the stray light still further. In this case an equalamount of stray light is observed only out to 20/zm awayfrom the edge of the aperture. If an acceptable level ofstray light is 2 %, then the spatial resolutions for aperturing after, before, and before and after the sample are72, 48, and 40 #m, respectively.An explanation for the vast difference in stray lightobserved when aperturing after the sample as opposedto before the sample arises from the fact that the aperturebefore the sample limits the source image to illuminateonly the sample of interest. An idealized depiction of thesource image formed at the sample plane for both aperturing modes is shown in Fig. 8. Under the best conditions, the image of the source formed at the sample orsample plane has an Airy disk whose diameter is approximately 20/ m. This dimension is also very close tothat which was measured experimentally for the sourceprofile (Fig. 5, profile for 8-/zm aperture). Figure 8A showsthe Airy diffraction pattern of the source superimposedon the sample of interest or, in the present experimentalcase, the area which should be defined by the aperture(i.e., 8 x 240 #m). The outside arrows delineate the extent of the Airy disk. As a result of diffraction, energy isspread into areas not defined by the aperture. Thus, ifthe edge of the polymer film is aligned with the edge ofthe aperture image, absorptions of the film will still beobserved as a result of the diffracted light. The percentof stray radiation will decay in accordance with the Airyprofile on stepping the film edge out to greater distancesfrom the edge of the aperture image.Figure 8B illustrates the case for aperturing after thesample. Since no aperture is present before the sample,the sample is illuminated by an entire image of the source.In the IRPLAN, the image of the source at the sampleplane is 200/ m in diameter. Due to diffraction, the in1638O,OCA2.5Q0.75.Volume 45, Number 10, 19911.00l0"75l0'50t0'25toooI-.AJ200I.un8pm .u,n . 16BFI6. 8. Idealized source energy distributions formed at the sampleplane for aperturing before the sample (A) and after the sample (B).tensity distribution will not be a perfect edge functionbut one whose intensity distribution is as shown in thefigure. In this aperturing mode, the spatial resolution orability to observe the image of one sample without interferences from a neighboring sample is again dictatedby Eq. 3. Thus the element forming the image of thesample at the aperture after the sample can do so witha spatial resolution of 16 m (based on N.A. 0.71). Inother words, under the best conditions, the diameter ofthe smallest sample that one can observe with this element while maintaining spectral purity is 16 m.As a result of diffraction, the area viewed by the opticalelement is larger than that defined by the aperture. Placing the edge of a polymer film next to the edge of theaperture image at the sample plane will result in absorptions being observed from the stray radiation presentin these areas. Here again the stray radiation will followthe profile of the intensity distribution on stepping thefilm edge to larger distances from the aperture edge. Incontrast, the intensity will not decay, as in the case ofthe Airy profile, but will remain relatively constant,thereby yielding higher stray energy for this aperturingmode.Finally, Fig. 9 demonstrates the effect of diffractionin terms of wavelength. This figure compares the percentof stray radiation present outside the area defined bythe aperture for both the C-O-C asymmetric stretch (9.5#m-wavelength light) and the C O stretch (5.72- mwavelength light). Apertures both before and after the
]3.002, 12.00o 5.72 C OA 9.5B C-O-C 11.00a:10.00L9.008.00 7.00o 6.005.00CONCLUSIONSA4.mmc 3. 2.00 I.O0O.OOi0 48axis elements are not diffraction limited in terms of imaging, and the aperturing, because of a design constraint,is done after the sample. This expectation is not to saythat mapping analyses cannot be conducted with thesemicroscopes but that the quantitative integrity of thedata will be limited or compromised.12 18 2024 2832 313 40Oistonce from Edge o f Flperture (micrometers)FIG. 9. Percent of stray energy outside area defined by aperture fordifferent wavelengths (apertures placed before and after sample).sample with dimensions of 8 x 240 #m were employed.The figure illustrates, in accordance with relationships1-3, that diffraction is more severe for longer wavelengths. By choosing the carbonyl absorption as the analytical peak, one can effectively reduce the stray light.On the basis of an acceptable stray light level of 1%, thespatial resolution with the use of the C-O-C absorptionis 56 gm, whereas that for the carbonyl absorption is only32 #m. The implication for quantitative analysis is that,if mapping analysis is done on the basis of functionalgroups, those groups with absorptions occurring at shorter wavelengths should be employed to maximize the spatial resolution and thus the quantitative integrity of thedata collected.The emphasis in this investigation was placed on thestudy of those variables related to diffraction which canbe controlled by the analyst (i.e., aperturing mode, aperture size, and choice of analytical wavelength). Although it has been shown that diffraction occurs fromthe use of Cassegrainian condensers and objectives, theanalyst has no control over these design parameters. Itshould be stated that the experiments conducted employed the use of a model sample under ideal conditions.A thin free-standing film was chosen to minimize errorssuch as diffraction from the sample and changes in imageplanes associated with differing refractive indices of asupporting substrate. Under conditions where normalnonideal laminates are studied, it is expected that theseerrors will introduce stray light errors into the analysis.In addition to these errors a laminate presents a sampleconfiguration in which waveguiding of the infrared lightthrough the individual layers could have a dramatic effect on the pathlength of the light through the sampleand quite possibly the spatial resolution. Here againmapping analyses which infer some level of quantitationwith regard to spatial resolution will require a carefulcharacterization of the sample and system variables.While some of the results may be helpful for improvingfuture microscope designs, they are only valid for a designsimilar to the IRPLAN. Those microscopes which employ off-axis elements to image the infrared source ontothe sample will exhibit different stray light characteristics. It is expected that the stray light will be moreproblematic in microscopes of this design since the off-The results of the investigation have shown that theapertures which are employed to spatially isolate thesample of interest are responsible for most of the diffraction occurring in an infrared microscope. In general,the extent of diffraction (spread function analysis) fordifferent aperturing modes can be described by the Airyfunction provided that the aperture dimension is belowthat dictated by diffraction. For aperture dimensions farabove the limit, an edge function is sufficient to describethe energy distribution. Aperture dimensions at or justabove the diffraction limit are described as intermediatebetween the Airy and edge functions. As predicted bythe diffraction relationships, decreasing the size of theaperture will increase the amount of stray energy presentin those areas not defined by the geometrical image ofthe aperture. In this view the common practice of overaperturing will work only for relatively large samples. Asthe sample size approaches the diffraction limit, overaperturing will actually increase spectral impurities fromneighboring samples.The results have also shown that spatial resolutionestimates based of the relationships developed for theAiry disk (central maximum of the Airy pattern) areinsufficient if quantitative analysis is to be attempted.The diameter of the Airy disk for the present experimental conditions is 20/ m. If a stray light level of only1% can be tolerated, the experimental results show thatt
the extent of stray light, resulting from diffraction, in an FT-IR micro- scope system. The effects of stray light were studied under conditions employing different aperturing modes, aperture sizes, and wavelengths of light. Re