Transcription
Ventilator Waveforms:InterpretationAlbert L. Rafanan, MD, FPCCPPulmonary, Critical Care and Sleep MedicineChong Hua Hospital, Cebu City
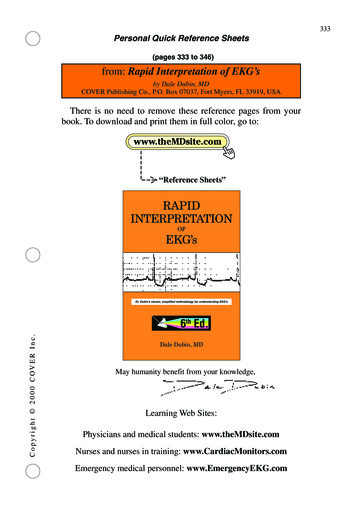
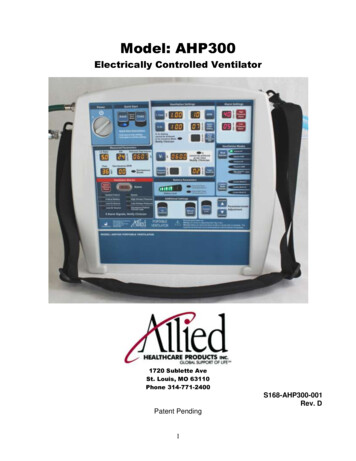
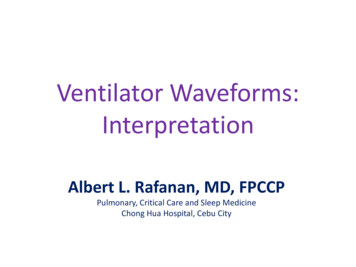
Types of Waveforms Scalars are waveform representations of pressure,flow or volume on the y axis vs time on the x axis Loops are representations of pressure vsvolume or flow vs volume
Scalar Waveforms
Loop
Common problemsthat can be diagnosedby analyzingVentilator waveformsAbnormal ventilatoryParameters/lung mechanicsE.g. Overdistension,Auto PEEPCOPDPatient-ventilatorInteractionsE.g. flow starvation,Double triggering,Wasted effortsActive expirationVentilatory circuit relatedproblemsE.g. auto cycling andSecretion build up in theVentilatory circuit
Lung Mechanics Use Scalar Pressure Time Waveform with a square waveflow pattern
Understanding the basic ventilator circuit eventilatormakesthe firstofpartmechanicallypatientcan isbeof thecircuit.ventilatedIts pumplike parts .depictedsimplisticallya pistonmakesup connectedthatin a reciprocatingThemovesdiaphragmis also shownfashionas abyanpiston;endotrachealtubewe canduringcausingthe respiratory2ndair towhichbe cycle.drawnintoconsiderasanextensionofthethe lungs during contraction.patient’s airways.ET TubeairwaysChest wallDiaphragm
Understanding airway pressuresThe respiratory system can be thought of as a mechanicalsystem consisting of resistive (airways ET tube) and elastic(lungs and chest wall) elements in seriesTHUSPaw FlowX Resistance Volume x 1/ComplianceET TubePawAirway pressureET tube AirwaysAirwaysLungs element) ChestET tubewall(resistive(resistive(elastic element)airwaysLungs Chest wall(elastic esvarieswithwithairflowvolume andand thediameterofETTandairways.stiffness of lungs and chest wall.Pleural pressureChest wallDiaphragmFlowresistancePel Volume x 1/CompliancePalvAlveolar pressure
Understanding basic respiratory mechanicsThus the equation of motion for the respiratory systemisPaw (t) VentilatorPres (t) Pel (t)ElungsRETtubeET TubeRawErsairwaysRairwaysEchest wallThe total ‘elastic’ resistance (Ers) offered by theLet us nowunderstandhow resistancethe respiratoryThetotal s respiratoryto move airsysteminto theislungsgiventime (t),inherentelastanceand ventilatedresistance patientto airflowinthemechanicallyresistancesoffered bythetheelasticventilatorhas to generatesufficientdeterminesthesumpressuresais equal to theof the generatedresistanceswithinofferedEandthepressure stem.bymechanicallythe endotrachealtube (RET tube)wall E chest(Pwallelastic (Pel (t))chestand resistanceres(t)) propertiesand the patient’s airways ( R airways)of the respiratory systemDiaphragm
Understanding the pressure-time waveformusing a ‘square wave’ flow patternpressurePpeakPresventilatorPplatPresRET tubetimePresRairwaysAfter this, the pressure rises in a linear fashionto finally reach Ppeak. Again at end inspiration,Theis a reflectionAt pressure-timethe beginning waveformof the inspiratorycycle,air flow is zero and the pressure drops by anthe pressuresthe Ptheofventilatorhas togeneratedgenerate withina pressureamount equal to Pres to reach the plateau resairwaysduringtheeachphaseof theto overcomeairwayresistance.pressure Pplat. The pressure returns toventilatorycycle. at this time.Note: No volumeis deliveredbaseline during passive expiration.Diaphragm
Pressure-time waveforms using a ‘square wave’ flow patternPaw(peak) Flowx Resistance Volume x 1/ ComplianceScenario # 1pressurePaw(peak)PresPrestimeThis is a normal pressure-time waveformWith normal peak pressures ( Ppeak) ;plateau pressures (Pplat )andairway resistance pressures (Pres)flowPplattime‘Square wave’flow pattern
Waveform showing high airways resistancepressurePaw(peak) Flow x Resistance Volume x 1/ CompliancePpeak PEEPScenario # 2NormalPrese.g. ET tubeblockagePrestimeThe increase in the peak airway pressure is drivenentirelyan increasein the airwaysresistanceThisis anbyabnormalpressure-timewaveformpressure. Note the normal plateau pressure.flowPplattime‘Square wave’flow pattern
Waveform showing increased airways resistance‘Squarewave’ flowpatternPpeakPplatPres
Waveform showing high inspiratory flow ratespressurePaw(peak) Flow xResistance Volume x 1/compliance PEEPScenario # 3Paw(peak)NormalPrese.g. high flowratesPplatPresThe increase in the peak airway pressure is causedThis inspiratoryis an abnormalwaveformby highflowpressure-timerate and airwaysresistance.Note the shortened inspiratory time and high flowflowtimeNormal (low)flow ratetime‘Square wave’flow pattern
Waveform showing decreased lung compliancepressurePaw(peak) Flow x Resistance Volume x 1/ Compliance PEEPScenario # 4Paw(peak)NormalPrese.g. ARDSPplattimeThe increase in the peak airway pressure is drivenby the decrease in the lung compliance.Thisis an abnormalwaveformIncreasedairways pressure-timeresistance is oftenalso a part of this scenario.flowPrestime‘Square wave’flow pattern
Common problemsthat can be diagnosedby analyzingVentilator waveformsAbnormal ventilatoryParameters/lung mechanicsE.g. Overdistension,Auto PEEPCOPDPatient-ventilatorInteractionsE.g. flow starvation,Double triggering,Wasted effortsActive expirationVentilatory circuit relatedproblemsE.g. auto cycling andSecretion build up in theVentilatory circuit
Recognizing Lung Overdistension
Flow-time waveform Flow-time waveform has both an inspiratory and an expiratoryarm. The shape of the expiratory arm is determined by:– the elastic recoil of the lungs– the airways resistance– and any respiratory muscle effort made by the patient duringexpiration (due to patient-ventilator interaction/dys synchrony) It should always be looked at as part of any waveform analysisand can be diagnostic of various conditions like COPD, autoPEEP, wasted efforts, overdistention etc.
Recognizing lung overdistensionSuspect this when:There are high peak and plateauPressures Accompanied by high expiratoryflow ratesPEARL: Think oflow lung compliance (e.g. ARDS),excessive tidal volumes,right mainstem intubation etc
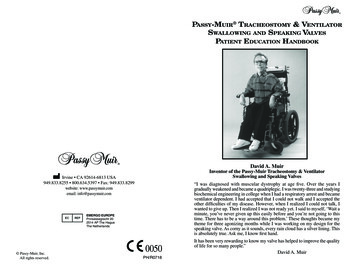
The Stress Index In AC volume ventilation using aconstant flow waveform observe thepressure time scalar.flow Normal, linear change in airwaypressure Stress index 1Paw Upward concavity indicates decreasedcompliance and lung overdistensionStress index 1 Downward concavity indicatesincreased compliance and potentialalveolar recruitmentStress index 1Note: Patient effort must be absenttime
The Stress Index
Pressure-volume loopCompliance (C)is markedly reduced in theinjured lung on the right ascompared to the normal lungon the leftNormallungARDSUpper inflection point (UIP)above this pressure,additional alveolar recruitmentrequires disproportionateincreases in appliedairway pressureLower inflection point (LIP)Can be thought of as theminimum baselinepressure (PEEP)needed for optimalalveolar recruitment
onpointNote: During normal ventilation the LIP cannot be assessed due to the effect ofthe inspiratory flow which shifts the curve to the right
Recognizing Auto-PEEP
Dynamic Hyperinflation (Gas Trapping) Dynamic hyperexpansion, defined as prematuretermination of exhalation, often occurs when respiratoryrate, inspiratory time, or both have been increased. By not permitting exhalation to finish, an increase in meanairway pressure results. Gas trapping may occur leading to an elevation in PCO2. Careful attention must be paid to dynamic hyperexpansionin patients with obstructive lung disease whose long timeconstants and slow emptying can result in progressive airtrapping, hypercarbia, and eventually decreased cardiacoutput.
Expiratory flow continues and fails to return to thebaseline prior to the new inspiratory cycle
Detecting Auto-PEEPRecognizeAuto-PEEPwhenExpiratory flow continuesand fails to return tothe baseline prior to the newinspiratory cycle
The development of auto- PEEP over severalbreaths in a simulationNotice how the expiratory flow failsto return to the baseline indicatingair trapping (AutoPEEP)Also notice how air trapping causesan increase in airway pressuredue to increasing end expiratorypressure and end inspiratorylung volume.
Understanding how flow rates affect I/E ratios andthe development of auto PEEPDecreasing the flow rateIncrease the inspiratory timeand consequently decrease theexpiratory time(decreased I/E ratio)Thus allowing incomplete emptyingof the lung and the developmentof air trapping and auto-PEEPLluis Blanch MD, PhD et al: Respiratory Care Jan 2005 Vol 50 No 1
Understanding how inspiratory time affect I/Eratios and the development of auto-PEEP In a similar fashion, an increase in inspiratory timecan also cause a decrease in the I: E ratio and favorthe development of auto-PEEP by not allowingenough time for complete lung emptying betweenbreaths.
Recognizing Expiratory FlowLimitation(e.g. COPD, asthma)
Recognizing prolonged expiration (air trapping)Recognizeairway obstructionwhenExpiratory flow quickly tapers offand then enters a prolongedlow-flow state without returning tobaseline (auto- PEEP)This is classic for the flowlimitation and decreased lungelastance characteristic of COPDor status asthmaticus
Common problemsthat can be diagnosedby analyzingVentilator waveformsAbnormal ventilatoryParameters/lung mechanicsE.g. Overdistension,Auto PEEPCOPDPatient-ventilatorInteractionsE.g. flow starvation,Double triggering,Wasted effortsActive expirationVentilatory circuit relatedproblemsE.g. auto cycling andSecretion build up in theVentilatory circuit
PATIENT-VENTILATOR INTERACTIONSWasted effortsDouble triggeringFlow starvationActive expiration
Ventilator Dyssynchrony: Inaccurate Sensingof Patient’s Effort Many modern ventilators sense patient effort– by detecting decreases in airway pressure or– flow between the inspiratory and expiratory limbs of the circuit. Inadequate sensing of patient effort leads to tachypnea, increasedwork of breathing, ventilator dyssynchrony, and patient discomfort. Flow triggering is often used in children, as it is very sensitive topatients with minimal respiratory effort and small endotrachealtubes. Dyssynchrony also occurs when an air leak leads to loss of PEEP,resulting in excessive ventilator triggering (auto cycling). The unstable pressure baseline that occurs due to leak may bemisinterpreted as patient effort by the ventilator.
Recognizing ineffective/wasted patient effortPatient inspiratory effortfails to trigger ventresulting in a wasted effortResults in fatigue, tachycardia,increased metabolic needs,fever etcCauses: High AutoPEEP,respiratory muscle weakness,inappropriate sensitivity settings
Recognizing double triggeringHigh peak airwaypressures anddouble the inspiratoryvolumeContinued patient inspiratory effortthrough the end of a deliveredbreath causes the ventilator to trigger againand deliver a 2nd breath immediately afterthe first breath.This results in high lung volumes and pressures.Causes: patient flow or volume demand exceedsventilator settingsConsider: Increasing tidal volume, switchingmodes i.e. pressure support, increasing sedationor neuromuscular paralysis as appropriate
Ventilator Dyssynchrony: Inadequate VentilatorySupport Inadequate ventilatory support occurs when patient effort is notsatiated by the inspiratory flow of the mechanical breath. As a result, patients attempt to initiate breaths during a mechanicalbreath. This phenomenon is seen as a reduction of airway pressure, seen asa decrease in airway pressure tracing during inspiration (flowdyssynchrony). In volume-limited ventilation a reduction of the inspiratory pressureas a result of dyssynchronous patient effort can translate into ahigher PIP. Titration of flow rate, decreasing inspiratory time, or changing themode of ventilation can help meet a patient’s inspiratory demand.
Another example of double triggering
Recognizing flow starvationLook at the pressure-timewaveformIf you see this kind ofscooping or distortion insteadof a smooth rise in thepressure curve .Diagnose flow starvationin the setting of patientdiscomfort, fatigue,dyspnea, etc on the vent
Recognizing active expirationLook at the flow-time& pressure-timewaveformNotice the high and variableexpiratory flow rates due tovarying expiratory muscle effortThe patient’s active expiratory effortsduring the inspiratoryphase causes a pressure spike.PEARL: This is a high drive state where increased sedation/paralysis and modechange may be appropriate for lung protection.
Common problemsthat can be diagnosedby analyzingVentilator waveformsAbnormal ventilatoryParameters/lung mechanicsE.g. Overdistension,Auto PEEPCOPDPatient-ventilatorInteractionsE.g. flow starvation,Double triggering,Wasted effortsActive expirationVentilatory circuit relatedproblemsE.g. auto cycling andSecretion build up in theVentilatory circuit
RecognizingAirway Secretions&Ventilator Auto-Cycling
Recognizing airway or tubing secretionsNormal flow-volumeloopFlow volume loopshowing a ‘saw tooth’pattern typical ofretained secretions
Characteristic scalars due to secretionbuild up in the tubing circuit
Recognizing ventilator auto-cycling Think about auto-cycling when– the respiratory rate increases suddenly without any patient input and– if the exhaled tidal volume and minute ventilation suddenly decrease. Typically occurs because of a leak anywhere in the system startingfrom the ventilator right up to the patients lungs– e.g. leaks in the circuit, ET tube cuff leak, lungs (pneumothorax) May also result from condensate in the circuit The exhaled tidal volume will be lower than the set parameters andthis may set off a ventilator alarm for low exhaled tidal volume, lowminute ventilation, circuit disconnect or rapid respiratory rate.
Take home points Ventilator waveform analysis is an integralcomponent in the management of a mechanicallyventilated patient. Develop a habit of looking at the right waveform forthe given mode of patient ventilation. Always look at the inspiratory and expiratorycomponents of the flow-time waveform. Don’t hesitate to change the scale or speed of thewaveform to aid in your interpretation.
Thank You
Where is the plateau pressure?
2. Which of thefollowingwaveformsindicate anincreasedresistance and adecreasedcompliance?
Waveform showing decreased lung compliance‘Squarewave’ flowpatternPpeakPplatPres
3. What is the best Stress Index?This is on AC volumeventilation using a constantflow waveform. The graph is apressure time scalar.Note: Patient effort must be absentPawtime
4. Which waveform shows autopeep?
5. What is shown by the Red ArrowA. Auto PeepB. RetainedSecretionsC. IneffectivePatient EffortD. DoubleTriggering
COPD Patient-ventilator Interactions E.g. flow starvation, Double triggering, Wasted efforts Active expiration Ventilatory circuit related problems E.g. auto cycling and Secretion build up in the Ventilatory circuit. Lung Mechani