Transcription
A DYNAMIC BAYESIAN NETWORK TO PREDICT THE TOTAL POINTSSCORED IN NATIONAL BASKETBALL ASSOCIATION GAMESbyEnrique M. Alameda-BasoraA thesis submitted to the graduate facultyin partial fulfillment of the requirements for the degree ofMASTER OF SCIENCEMajor: Industrial EngineeringProgram of Study Committee:Sarah Ryan, Major ProfessorDan NettletonSigurdur OlafssonThe student author, whose presentation of the scholarship herein was approved by theprogram of study committee, is solely responsible for the content of this thesis. TheGraduate College will ensure this thesis is globally accessible and will not permitalterations after a degree is conferred.Iowa State UniversityAmes, Iowa2019Copyright Enrique M. Alameda-Basora, 2019. All rights reserved.
DEDICATIONI dedicate this work to my beloved parents, Eloiris Basora-Cintron and Rafael A. AlamedaRojas. Thank you for always loving me unconditionally and instilling within me the values of hardwork and dedication. Before embarking on my journey to Iowa State University, I had to copewith the decision not to see you as often, and that was probably the hardest decision of my life. Icould imagine how difficult it was to take care of four children. I vividly recall times when youwould spend a whole day of your busy lives making sure everyone completed their science fairproject due that week. I want you to know that all the sacrifices you made for us were not in vain.Incredibly, we have all grown up and become adults with promising careers and/or graduatedegrees. Our success is a testament to all the hours of hard work you put into raising us and makingsure we believed in our abilities to succeed. Thank you for teaching me the value of education andlife-long learning. Without you, I would not be where I am today. I will forever be grateful andindebted to you.ii
TABLE OF CONTENTSLIST OF FIGURES . viLIST OF TABLES . viiACKNOWLEDGEMENTS . viiiABSTRACT. ixCHAPTER I INTRODUCTION . 11.1 Background and Motivation . 11.2 Research Problem . 21.3 Proposed Solution . 31.4 Organization of Thesis . 3CHAPTER II LITERATURE REVIEW . 52.1 Introduction . 52.2 Data Mining and its Role in Sports Predictive Modeling . 52.2.1 Data Mining Concept . 52.2.2 Sports Predictive Modeling. 72.3 Data Mining Techniques Applied to Basketball Predictive Modeling . 72.3.1 Naïve Bayes Classifier . 72.3.2 Logistic Regression. 92.3.3 Neural Networks . 122.3.4 Review of Bayesian Networks Applied to Sports. 14iii
2.3.5 Conclusion and Research Gap . 16CHAPTER III BAYESIAN NETWORK DETAILS AND JUSTIFICATION . 183.1 Introduction to Bayesian Networks . 183.2 The Importance of the Directed Acyclic Graph Structure . 183.3 Bayesian Network Learning . 193.4 Why a Bayesian Network?. 213.5 Bayesian Network Limitations . 213.6 Simple Bayesian Network Example . 223.7 Guide on Computing Probabilities in this Study . 27CHAPTER IV DATA COLLECTION AND PREPARATION. 284.1 Collection of Data Sets and Additional Features Constructed. 284.1.1 Training Data Set . 284.1.2 Test Data Set . 294.1.3 Features Scraped and Additional Constructed Features . 304.2 Discretization of Data Sets. 314.3 Feature Selection. 334.3.1 Information Gain Ratio . 354.3.2 Chi-Square Test of Independence for Feature Selection . 374.3.3 Final Learning Features and Validation . 39CHAPTER V EXPERIMENTAL DESIGN . 45iv
5.1 Introduction . 455.2 Cramer’s V Measure of Association . 455.3 Chi-Square Test for Conditional Independence . 475.4 Expert Bayesian Network . 485.4.1 Methodology . 485.4.2 Initial Comparison to Non-Expert Bayesian Network with Feature Selection . 495.5 Calculating the Probabilities . 52CHAPTER VI MODEL EVALUATION . 536.1 Results . 536.1.1 Accuracy Results . 536.1.2 Profitability Results . 556.1.3 Time Results . 586.2 Discussion of Results . 59CHAPTER VII CONCLUSIONS . 63BIBLIOGRAPHY . 67APPENDIX A: Interpretations of In-Game Statistics . 74APPENDIX B: R Program to Estimate Probabilities for All Game Instances (BNs) . 76v
LIST OF FIGURESFigure 1: Simple Bayesian Network Example . 25Figure 2: Average Pace and Three-Point Shots Attempted for Individual Teams Last 10 NBARegular Seasons . 29Figure 3: Top 25 Features by Information Gain Ratio in Relation to TOTAL POINTS . 37Figure 4: Top 25 Features by Chi-Square Statistic in Relation to TOTAL POINTS . 39Figure 5: Directed Acyclic Graph of the Non-Expert Bayesian Network . 44Figure 6: Cramer’s V Measure of Association Between Pairs of Selected Features . 46Figure 7: Directed Acyclic Graph of the Expert Bayesian Network . 49Figure 8: Overall Accuracy of Over/Under Prediction (%) . 54Figure 9: Distribution of TOTAL POINTS in the Training (left) and Test (right) Data Sets. 60Figure 10: Offense-Driven Statistics’ Average over the Last Six Regular Seasons . 61vi
LIST OF TABLESTable 1: Typical Example of the Three Betting Options . 1Table 2: Data Used for Simple Bayesian Network Example . 23Table 3: Exhaustive List of Attributes in the Data Sets . 31Table 4: Attributes Discretized into Different Bin Widths than Five . 33Table 5: Description and Discretization of Features Selected . 40Table 6: BIC Comparison of Non-Expert Bayesian Networks . 43Table 7: BIC Comparison of Bayesian Networks. 51Table 8: AIC Comparison on the Class Node . 52Table 9: Description of Odds When Wagering 100. 55Table 10: Total Profit Amount Overall and per Quarter (Expert BN) . 56Table 11: Total Profit Amount Overall and per Quarter (Naïve Bayes Classifier) . 57Table 12: Summary Statistics of Prediction Time Over All 300 Instances . 58Table 13: Expert Bayesian Network’s Confusion Matrices by Quarters . 59Table A1: Interpretation of In-Game Statistics (from: https://stats.nba.com/help/glossary) . 74vii
ACKNOWLEDGEMENTSThis thesis was completed due to the collective efforts of many individuals. First andforemost, I want to thank my committee members: Dr. Sigurdur Olafsson, Dr. Dan Nettleton, andDr. Sarah Ryan for being willing to serve as my advisors and mentors. I want to thank specificallymy major professor, Dr. Sarah Ryan, for her continued patience throughout this whole process andfor taking me in when I was a junior in my undergraduate program and introducing me to thewonderful and incredibly rewarding world of research. Thanks to her, I was able to choose a topicof my interest and define a research problem that would test my intellect and expand my knowledgeof statistics and machine learning.Next, I wish to thank two dear friends and colleagues that helped me get motivated to solvemy research problem: Dr. Hieu T. Pham and Gorkem Emirhuseyinoglu. Hieu, thank you for alwaysasking about my progress and being genuinely interested in my topic. Also, thank you for sharingyour views on the Data Science community with me and answering some of the questionsregarding the profession. Gorkem, thank you for staying up all night with me all winter breakworking on your research while I worked on mine. If it was not for seeing how hard you workedin a span of three weeks, I would have probably not finished as quickly as I did. Keep up that goodwork ethic!Lastly, I want to thank all those people who in one way or another understood how tediousthis five year program was for me and sacrificed their time with me, allowing me to finish myresearch. Thank you Courtney Geiken, Pierre Alameda-Basora, Valeria Alameda-Basora, andRafael Alameda-Basora. I promise that I will make up all the time I missed with you.viii
ABSTRACTBettors on National Basketball Association (NBA) games commonly place wagersconcerning the result of a game at time points during that game. We focus on the Totals(Over/Under) bet. Although many forecasting models have been built to predict the total numberof points scored in an NBA game, they fail to provide bettors engaged in live-betting withpredictions that are based on the game currently being played. We construct an Expert BayesianNetwork to sequentially, as the game progresses, update the probability that the total points scoredby both teams will exceed that set by the oddsmakers, and then use this probability to influenceour wager at the end of the first, second, and third quarters. Research methods include datacollection of team statistics over the last five NBA seasons, discretization of features, filter-basedfeature selection and specification of the network structure using domain knowledge and statisticaltests. We compare the profit of our live-betting strategy against amateur betting strategies, wagersinformed by a Naïve Bayes classifier, and wagers informed by a Bayesian Network whosestructure is specified using a greedy search algorithm. When applied to games played during theearly 2018-2019 NBA regular season, the Expert Bayesian Network and the Naïve Bayes modelprovide the most accurate predictions. Wagers informed by these two models yield profits of over10% and 6%, respectively, but the other models and strategies are not profitable.ix
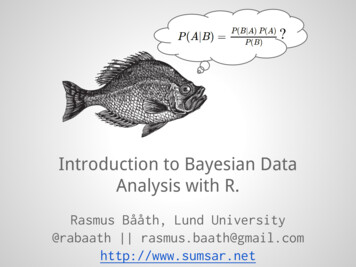
CHAPTER IINTRODUCTION1.1 Background and MotivationWith a total of 1,230 games each regular season, there are far more opportunities to wageron a National Basketball Association (NBA) game than most other sports leagues. The outcomeof NBA games is moderately predictable and, therefore, betting on the conclusion of a game yieldslittle to no profit due to low-risk wagers (Stern, 2008). The three most common bets placed on anNBA game are Point Spread, Moneyline and Totals (bettingexpert, 2018). Point Spread is definedas the differential of the points scored between the two teams, whereas the Moneyline is a simplewin/lose bet. For Totals (also known as the Over/Under), oddsmakers (also known as bookmakers)set a total number of points for any given NBA game and bettors place their wagers on whetherthe combined teams’ scores are more points (over) or fewer points (under) than the number ofpoints set by the oddsmakers. Although intuition suggests that bets should be placed on the endresult only at the beginning of the game, bettors commonly place wagers during specific timepoints in the game such as the ends of quarters (Williams 2010). With the risk of wagering on thetotal points in basketball games, one can see how predictive models can aid bettors in decisionmaking. To better illustrate the three common types of betting options in an NBA game, we providean example in Table 1 of a hypothetical game matchup between the Los Angeles Lakers (LAL)and the Toronto Raptors (TOR).Table 1: Typical Example of the Three Betting Options1
In Table 1, at the beginning of the game, the bettor can wager on any of the three options.For point spread, the bettor can wager on whether the underdog, as denoted by the positive ( )sign, Toronto Raptors will win the game or lose by fewer than five points, or the Los AngelesLakers will win the game by more than five points. For the Moneyline option, the bettor canchoose to either bet that the Los Angeles Lakers will win the game or, if they want to maximizetheir potential earnings (and risk), bet that the Toronto Raptors will win the game. For theOver/Under option, the oddsmakers set the total points for both teams to be 169 and the bettor hasthe option to wager on whether the total points scored by both teams will be Over or Under thatnumber. Unless specified by the bookmakers, the payout for an accurate wager is, if denoted bythe positive ( ) sign, how much money the bettor wins if they wager 100 and, if denoted by thenegative (-) sign, how much money the bettor must wager to win 100.Due to basketball’s high and volatile scoring nature, Point Spread and Totals bettingapproaches are more difficult to predict than Moneyline; however, the payoff is larger in mostcases (Williams, 2010). In fact, the difficulty with predicting winning probabilities (Moneyline) iswell-known as there is a lack of context within the game, no measure of prediction uncertainty andno publicly available data sets or models against which researchers and analysts can compare theirresults (Ganguly & Frank, 2018). Due to the risk involved in wagers, a tool for bettors thatestimates the joint probability distribution of scoring totals given a set of variables, uses thisdistribution to estimate the probability that the score is greater than that value set by theoddsmakers, and is updated as the game proceeds would be valuable to users.1.2 Research ProblemAlthough many forecasting models have been built to predict the total number of points,these models’ predictions are primarily based on data from previously completed games. This2
method fails to provide bettors with predictions also based on the current game being played.Specifically, there does not exist a publicly available model that estimates the probability that thescore total is greater than the total number of points set by the oddsmakers using in-game data. Inthis thesis, we aim to sequentially update this probability through a machine learning-basednetwork and use it to make wagering decisions at the end of each of the first three quarters as thegame progresses.1.3 Proposed SolutionThe machine learning-based network we propose is a Bayesian network (BN). Given a setof conditional probability tables, computed on random variables, the BN captures all existingknowledge about its inputs (random variables of interest) and converts it into a directed acyclicgraph (Jensen, 2009). This is a graph which consists of a set of nodes, a set of directed arcs thatpair distinct nodes to each other and contains no cycle (Bertsekas, 1998). The knowledge is thenused to predict outcomes or diagnose causal effects (if the structure is known), or to discover causalrelationships (if the structure is unknown). As with every sport, basketball possesses a vast arrayof statistics that are collected in every game which are correlated and can be used as inputs, orpredictors, within the Bayesian network.1.4 Organization of ThesisThe remaining chapters of this thesis are organized as follows. In Chapter II, we reviewthe related studies in the literature. In Chapter III, we give an extensive overview of BayesianBelief Networks and describe how one can be used to solve the research problem presented in thisthesis. In Chapter IV, we provide a description of the data collected for both the training and testingsets and how feature selection was conducted. In Chapter V, we detail the experiment which wasdesigned in hopes of building a profitable Bayesian Network which can estimate the probability3
that the score total is greater than the total number of points set by the oddsmakers. In Chapter VI,we evaluate the networks constructed in the study and compare them to amateur betting strategiesas well as a Naïve Bayes classifier. Finally, concluding remarks are provided in Chapter VII.4
CHAPTER IILITERATURE REVIEW2.1 IntroductionIn this chapter, we review the sources and documentation that relate to the topic and pavethe way for future research work. While reviewing them, we give a critical evaluation of theseworks with respect to the research problem being investigated. This whole review consists of twomain parts. The first is an overview of data mining followed by the role it plays in sports predictivemodeling. Then, we review the data mining techniques applied to making predictions in basketball.2.2 Data Mining and its Role in Sports Predictive Modeling2.2.1 Data Mining ConceptAggarwal (2015) describes data mining, a complex and multistage process, as “the studyof collecting, cleaning, processing, analyzing and gaining useful insights from data.” Colloquially,data mining starts when a method to collect data is employed and ends when results andrecommendations for a specific system are given through the analysis of said data. Aninterdisciplinary process, data mining requires fluency in the quantitative disciplines of statistics,mathematics, decision science and computer science (Dhar, 2013). Not to be confused with thedata extracted from statistics, the data often collected in the process of data mining areheterogeneous and unstructured. One may argue that the most important part in the process of datamining is transforming these conglomerated data into a standardized format one can comprehendmore easily (Mikut & Reischl, 2011). After the data collection and pre-processing step, it isimportant to specify a training and a testing data set. Typically, most of the data collected are usedas a training set from which the model can learn, and a smaller portion of data is then used fortesting and evaluating the corresponding data mining model.5
After the data sets have been determined, the analysis phase begins. One of the mostcommon ways of analyzing the data is using a machine learning algorithm. These algorithms, asexplained by Alpaydin (2014), “involve collecting a large sample of data and programmingcomputers to optimize a performance criterion using these samples.” Essentially, the goal ofmachine learning is to “teach” the computer to extract an algorithm for a specific task (Alpaydin,2014). There are two types of machine learning algorithms: supervised learning and unsupervisedlearning. Although the machine learning concept remains the same, the clear distinction betweenthese types involve whether the data collected combine input variables with an associated outputvariable (supervised learning) or if it is a collection of input data with no corresponding outputdata (unsupervised learning).In supervised machine learning the goal is to learn, from a training data set, all the inputvariables and their corresponding output variable in such a way that when given new input data,the machine can predict the value of the output variable for the data. If this output variable isdiscrete, then it becomes a classification problem. On the other hand, if the output variable is acontinuous real value, it is referred to as a regression problem (Kotsiantis, 2007). The machinelearning-based network in this thesis is an example of a supervised machine learning algorithm.To be specific, we focus on a classification problem where, given a set of input variables such aseffective field goal percentage and pace, we estimate the total points scored by both teams, ouroutput variable. Then, using the constructed network, we find the probability that the total numberof points is greater than the value specified by the oddsmakers.6
2.2.2 Sports Predictive ModelingSports predictive modeling, also known as sports analytics, is an emerging field thatinvolves data management, predictive models and information systems to predict specific sportrelated outcomes in hopes of improving sporting performance (Gerrard, 2014). Due to the vastamount of statistics and metrics collected for each player and team every game, the practicality ofdata mining tools and techniques in sports analytics is evident. To name a few examples, if sportsorganizations can perform machine learning algorithms on the data collected from every gamethey would be able to correctly predict which of their players will be stars, successful coachingand training strategies and how well they will do in the upcoming season.Because Operations Research in sports has been around for more than 50 years (Wright,2009), using data mining tools and techniques to make predictions is not a novel idea (Haghighatet al., 2013). Forecasting models have been used to determine the outcome of sports for years.What drives a lot of these models, just like the one constructed in this thesis, is the sports bettingmarket. In Section 2.3, we examine some of these models. Specifically, we describe those modelsused to predict the outcome or find the joint probability distribution of total points scored in abasketball game, whether it be a National Collegiate Athletic Association (NCAA) basketballgame or an NBA game. For an in-depth comparison that explains the similarities and differencesof predictions in both leagues, refer to Zimmerman (2016).2.3 Data Mining Techniques Applied to Basketball Predictive Modeling2.3.1 Naïve Bayes ClassifierNaïve Bayes (NB) is a simple machine learning algorithm used for classification. Beforeusing the NB algorithm, one must understand its underlying assumptions. It assumes that all theinput variables are equally important and that they are all independent of one another. These7
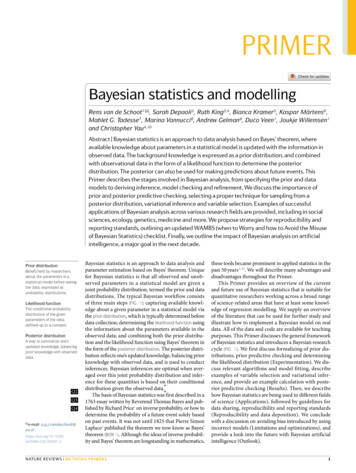
assumptions are quite strong and, therefore, it is difficult to find a data set where they hold true.Nevertheless, the NB classifier works surprisingly well despite its unrealistic assumptions.Essentially the NB classifier is centered on Bayes’ theorem. Bayes’ theorem, depicted in Eq. (2.1),describes how to update the probability of a hypothesis ( ) when given evidence ( ). It followsthe axioms of conditional probability and it is a common technique on which many modernmachine learning algorithms, including Bayesian Networks, rely. Using Bayes’ Theorem, NBfinds the most likely hypothesis (given the data and its evidence. (2.1),.,Rigorously, given a problem instance to predict, represented by a vector ,.,representing n input variables, the NB assigns to this instance a probabilityeach ofpossible outcomes for an output variablefor. Using Bayes’ theorem to calculate theposterior probability, one can reformulate the model withas our evidence andas ourhypotheses to make it more manageable for computing probability tables involving a large numberof input variables such that . Afterwards, following the assumption that allthe input variables are independent of one another, one can assume each featureis independentof every other feature. This means that the probability of a feature given the other features and itsoutput variables becomes simply the probability of the feature given the output variables, thatis ,.,, . Finally, by creating a joint model, one can then calculate eachhypothesis’ maximum likelihood such that ,., and make theirprediction (Raschka, 2014).In their research study, Miljković et al. (2010) use the NB classifier to build a model andpredict the outcome of 778 NBA games. They are interested in the point spread betting option.8
The system has an accuracy of 10%, as only 78 out of the 778 games’ spread (or point difference)are correctly determined (in the sense of the point spread wager in Table 1). As mentionedpreviously, due to the volatility of scoring, it is extremely difficult to predict the point differentialof an NBA game. In fact, de Saá Guerra et al. (2011) studies the volatility of these gamesthoroughly and proves how dynamic and how dependent on phase transitions the scoring of anNBA game is. However, Miljković et al. clearly violate one of the assumptions of the NB classifier,as the input variables they use are obviously dependent upon one another. An example of thisdependence is when they use field goals made and field goals attempted as one cannot make morefield goals than those attempted. Although the authors use input variables that violate theassumptions of the NB, they claim that the results are satisfactory and in line with expectations.One important limitation is that Miljković et al. use end-game summary statistics to build theirmodel. Although a common practice, it limits the practicality of their model as it can only beapplied after the game has concluded, when bets have already been decided, and cannot be usedfor live-betting.2.3.2 Logistic RegressionDeveloped by statistician David Cox (1958), logistic regression is an example of asupervised machine learning algorithm where the output variable is categorical. A clear distinctionto make is that logistic regression in itself is not a classification algorithm. It only becomes aclassification algorithm when combined with a decision rule that associates the output variables’outcomes with dichotomous predicted probabilities. There are different types of logistic regressionsuch as binary logistic regression, multinomial logistic regression where the dependent variablehas more than two outcome categories, ordinal logistic regression where there are multiple ordered(in terms of nature of informati
of my interest and define a research problem that would test my intellect and expand my knowledge of statistics and machine learning. Next, I wish to thank two dear friends and colleagues that helped me get motivated to solve my research problem: Dr. Hieu T. Ph