Transcription
World Environmental and Water Resources Congress 2007: Restoring Our Natural Habitat 2007 ASCEFLOODPLAIN ANALYSIS USING COMPUTATIONAL TOOLSTatiana Hernandez, CFM, PE1, and Bin Zhang, CFM, PE, PhD2Tetra Tech EM Inc., 1 S. Wacker Drive, 37th Floor, Chicago, IL 60606; PH (312)201-7434; FAX (312) 938-0118; email: tatiana.hernandez@ttemi.com2Tetra Tech EM Inc., 1 S. Wacker Drive, 37th Floor, Chicago, IL 60606-4651; PH(312) 201-7479; FAX (312) 938-0118; email: bin.zhang@ttemi.com1AbstractWhen conducting hydraulic studies or floodplain analysis or when producingDFIRMs for the FEMA map modernization program, two of the more timeconsuming processes are setting up the hydraulic model and delineating thefloodplain zones. The integration of widely available computational tools withhydrologic and hydraulic modeling and floodplain mapping improves accuracy,effectiveness, and quality. The various tools discussed in this paper include HECGeoHMS, HEC-GeoRAS, WISE, CHECK-RAS, and RASPLOT.In this paper, the county-wide draft DFIRM of Scott County, Minnesota, isused to demonstrate the applications, capabilities, and challenges faced when usingthese tools. By using Geographic Information Systems (GIS) raster and feature datasets, HEC-GeoHMS and HEC-GeoRAS automate the pre-processing of input dataand post-processing of HEC-RAS results. CHECK-RAS is used to verify the validityof hydraulic parameters, structure and cross section data, as well as floodway andflood profile results. RASPLOT facilitates the creation of flood profiles. These toolsare successfully linked with HEC-RAS to expedite the production of floodplainmapping and obtain accurate hydraulic results.IntroductionAdvances in computer technology for data processing and analysis haveresulted in the development and availability of high-resolution topographic data,state-of-the-art Laser Imaging Detection and Ranging (LIDAR), and GIS raster andfeature datasets. Interest in geospatial data usage has increased in recent years andGIS applications have become the common approach in engineering analysis andmapping. Local communities, districts, and state agencies are making numerousefforts to collect GIS data that facilitates the development and applications ofhydrologic and hydraulic models and floodplain mapping. As a result, extensive,improved and more comprehensive data is currently available.This trend has prompted the creation of computational aids to process andanalyze the substantial amount of data on hand. The need for automation of taskshas become extremely important for managing data efficiently. The preparation or1
World Environmental and Water Resources Congress 2007: Restoring Our Natural Habitat 2007 ASCEpre-processing of data for hydrologic and hydraulic modeling can be time consumingdue to the large amount of data available. When performing floodplain analysis at theregional and state levels, significant amounts of parameters and input data arerequired for computer models such as the Hydrologic Engineering Center’sHydrologic Modeling System (HEC-HMS) and the Hydrologic Engineering Center’sRiver Analysis System (HEC-RAS).In addition, the post-processing of hydrologic and hydraulic modeling resultscan be cumbersome when using improved computer capabilities such as GIS foranalysis and visualization. In the past, Flood Insurance Rate Maps (FIRMs) wereproduced by the Federal Emergency Management Agency (FEMA) and distributed onpaper. Presently, FEMA is implementing a map modernization initiative to upgradeand digitize the maps that will be created and distributed in a GIS format. Thesemaps, digital flood insurance rate maps (DFIRMs), utilize state-of-the-art technologyto increase the quality, reliability, and accessibility of flood hazard maps and data.The county-wide draft DFIRM of Scott County, Minnesota, is used in thispaper. Hydrologic and hydraulic analysis and preparation of DFIRMs for all majorstreams within Scott County were performed. Scott County is located just south ofMinneapolis, Minnesota, and is bounded on the west and north by the MinnesotaRiver. Approximately 150 miles of streams, draining 350 square miles, weremodeled and digital floodplain maps were developed for the county using FEMA’sdetailed and approximate studies for riverine hydraulics. The studied streams containsegments with significant differences in geometry varying from steep and narrowcross sections to flat and wide river segments over very short distances. In addition,segments of the river cross urban areas where the streams become channelized,narrower, blocked by dams, or bounded by levees. These situations require the use ofGIS and computational tools to accurately represent watershed characteristics in thehydrologic model and flow conveyance in the hydraulic model.Computational ToolsIntegrating several computational tools into hydrologic and hydraulicmodeling and floodplain mapping improves quality, provides better visualization ofresults, and decreases processing time. The computational tools discussed in thispaper are widely available and include HEC-GeoHMS, HEC-GeoRAS, WISE,CHECK-RAS, and RASPLOT. This analysis was conducted to demonstrate theapplicability and efficiency of using computational tools for hydrology, hydraulics,and floodplain mapping.HydrologyScott County hydrology was studied using HEC-HMS (Tetra Tech EM Inc.2006). HEC-HMS is a rainfall-runoff model developed by the U.S. Army Corps ofEngineers (USACE) Hydrologic Engineering Center. HEC-HMS is designed tosimulate the event-based and continuous precipitation-runoff processes of dendrite2
World Environmental and Water Resources Congress 2007: Restoring Our Natural Habitat 2007 ASCEwatershed systems. Details about the HEC-HMS model are provided in the User’sManual (Scharffenberg 2001).Setting up the HEC-HMS model requires the use of high-resolution spatialdata including topographic, land use, and hydrologic soil conditions data to extractthe watershed input parameters needed for the model. The spatial data analysis isperformed in Arcview GIS interface using the Geospatial Hydrologic Modelingextension, HEC-GeoHMS, developed by USACE (Doan 2003).The watershed delineation for Scott County was performed using HECGeoHMS. Figure 1 shows the major streams and delineated watersheds in ScottCounty using HEC-GeoHMS. The basic data requirement for delineation in theHEC-GeoHMS extension is a digital elevation model (DEM) of the study area whichis a raster representation of the area’s terrain or topography. In the HEC-GeoHMSextension, a terrain-preprocessing tool was used to derive intermediate auxiliary datasets that collectively describe the watershed drainage patterns and allow for streamand sub-watershed delineation.Figure 1.Watersheds in Scott County, Minnesota3
World Environmental and Water Resources Congress 2007: Restoring Our Natural Habitat 2007 ASCEThe first five data sets created were grid representations of flow direction,flow accumulation, stream definition, stream segmentation, and watersheddelineation. The next two data sets were the vector representation of watershedpolygons and stream polylines. The last data set consisted of aggregated subwatersheds representing a preliminary delineation based on a specified threshold area.Then, the basin processing function was used to revise the sub-watershed delineationand define the stream reaches.The basin characteristics function of the HEC-GeoHMS extension was used toderive physical characteristics for the streams and sub-watersheds, such as reachlength, slope, and longest flow path, and to attach these characteristics to theattributes table of the sub-watershed GIS layer. These physical characteristics werethen used to estimate hydrologic parameters required by HEC-HMS.The land use analysis was performed using HEC-GeoHMS with two availabledatabases, the existing Minnesota Land Cover Class System (MLCCS) and theMinnesota Gap Analysis Program (GAP). The MLCCS (Richardson 2004) databasehas a very comprehensive land-cover classification system. However, the GAPdatabase consists of a detailed vegetation cover map produced through computerclassification of combined satellite imagery. The MLCCS database was used themajority of Scott County and was combined with the GAP database for areas of thecounty which have no MLCCS data available. In order to obtain consistent land-useclassifications for curve number definition, the more detailed MLCCS data werereclassified into common classes as Level 4 land-use types of GAP data. Figure 2illustrates the differences between the MLCCS data and the GAP data, as the map forRobert Creek watershed shows more well-defined and smoother land use areas thanthe map for Vermillion River. Area-weighted composite impervious percentageswere then estimated for each land use, based on reference values and professionaljudgment.NTNutaryribme ekVerillion R i vRobertrCerVermilion Rive r0.600.61.2 MilesRiverLand UseBare soilClose-seeded cropForestGrasslandPavementRow CropWaterWood,fair0.4Robert CreekFigure 2.00.4 MilesRiver.ShpLand UseBare soilClose-seeded cropForestGrasslandLow intensity urbanPavementRow CropWaterWood,fairVermillion RiverLand use maps of Robert Creek Watershed (MLCCS) andVermillion River Watershed (GAP)4
World Environmental and Water Resources Congress 2007: Restoring Our Natural Habitat 2007 ASCEHydrologic soil data used for Scott County included an updated county soilsurvey database and the Soil Survey Geographic (SSURGO) data from NaturalResources Conservation Service (NRCS) of the U.S. Department of Agriculture(USDA) for watershed areas outside of the county. The databases were processed inGIS using HEC-GeoHMS and they were merged and clipped to cover the countywatersheds. Soil type was represented by polygon shapes with attributes such as soilname, symbol, and area. Each soil group is associated with one of four hydrologicsoil groups (A, B, C, or D) based on soil infiltration capacities. Duel assignmentssuch as A/D, B/D, and C/D were redefined based on the assumption of drainedconditions because of the prevalent tile drain present in the area. Duel hydrologic soilgroups A/D, B/D, and C/D were therefore reassigned as A, B, or C, respectively.Curve number determines the runoff volume of a watershed. Curve numbervalues were created by NRCS as indices that represent the combination of hydrologicsoil groups and land use. Land use and soil data were integrated using HEC-GeoHMSto create the GIS polygons that include unique combinations of land use andhydrologic soil group in each watershed. Because of the heterogeneity of land andsoils in the watershed, the curve number of a sub-watershed was calculated ascomposite curve number based on the area-weighted average of various curve numbervalues for individual sub-watersheds.A HEC-HMS hydrologic model was then created using the hydrologicparameters developed by HEC-GeoHMS. The Clark Unit Hydrograph (UH) Methodwas used to compute the unit hydrograph for runoff calculations. The Clark UHmethod uses time of concentration (Tc) and storage coefficient (K). HEC-GeoHMSprovides several tools to estimate these parameters as well.HEC-GeoHMScapabilities extend from processing the digital elevation model to performingspatially intensive analysis of grid-based data to develop and import many of theinputs needed by HEC-HMS. The HEC-HMS model calculates the peak flows foreach storm event (Lorenz 1997).HydraulicsHydraulic modeling of surface streams for floodplain analysis is usuallyperformed using the USACE Hydrologic Engineering Center’s River AnalysisSystem (HEC-RAS) model. For Scott County, four separate steady state HEC-RASmodels were created, thus streams that were hydraulically connected were in the samemodel (Tetra Tech EM Inc. 2006).HEC-RAS (Brunner 2002) performs one-dimensional water surface profilecalculations using geometric data and steady flow data. The geometric data requiredfor the model includes the stream network, cross-section river stationing, elevationand station information for each cross section, and channel and overbank downstreamreach lengths. The flow data required includes peak flows for each flood profile,which are exported from HEC-HMS into HEC-RAS.5
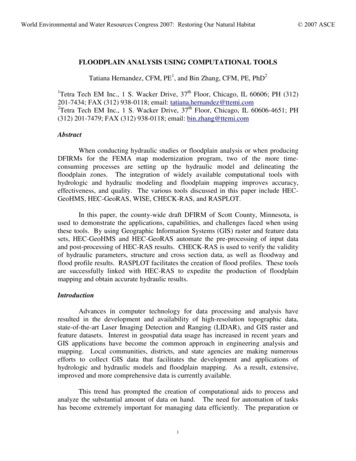
World Environmental and Water Resources Congress 2007: Restoring Our Natural Habitat 2007 ASCEThe HEC-RAS geometric data was created using the GIS extension HECGeoRAS, Version 4.1.1 (Ackerman 2005), developed by USACE in conjunction withthe ArcMap GIS application. HEC-GeoRAS is a set of ArcGIS tools designed toprocess geospatial data for use with the HEC-RAS model. It automates andstreamlines a number of GIS operations and eventually creates a HEC-RAS importfile containing geometric data based on digital terrain model (DTM) information suchas station identifiers, cross-section cut and surface lines, cross-section bank stationlocations, downstream river reach lengths, main channel alignment, right and leftoverbank data, ineffective flow areas, storage areas, and cross-section Manning’sroughness N-values. In addition, the HEC-GeoRAS tool is used to post-processHEC-RAS modeling results and delineate floodplains and floodways for each stream.For Scott County streams, the DTMs were created using GIS point layersextracted from LIDAR data. The point layers were converted into TriangularIrregular Network (TIN) layers that represent the ground topography. Field surveydata was also obtained around the channel crossings. The TIN layers were mergedwith field survey data from surveyed cross sections. The river centerline layer wascreated in ArcMap using U.S. Geological Survey (USGS) National Hydrograph Data(NHD), 2004 aerial photographs, and 2-foot topography.The cross-section layer consist of cut lines located perpendicular to the streamcenterline at: (1) locations that represent the average geometry of the stream reach;(2) road and railroad crossings; and (3) locations of significant changes in geometry,slope, channel conveyance, overbank roughness, and discharge. The locations of thecross sections can be set and edited by the user or can be automated using HECGeoRAS. For Scott County, available aerial photographs and contour data were usedto lay out the cross-section cut lines. The existing FEMA 100-year floodplainboundary was used as a guide in determining the extent of the cross sections. Theaverage distance between cross sections was 1,000 feet, with smaller distancesbetween cross sections near structures and near abrupt changes in channelconveyance. A total of 533 cross sections were field surveyed and 680 wereextracted from the TIN layer. Figure 3 illustrates an example of the stream geometryfor Credit River. The figure shows a segment of Credit River with cross-section cutlines upstream and downstream of a roadway crossing. The HEC-GeoRAS extensionis showing (near the upper left corner) the menu available to automatically generatethe stream geometric data.Field survey data, including cross sections and structures, was processed usingthe Watershed Information System (WISE). WISE (Watershed Concepts, 2005) is atool for managing and utilizing data for watershed studies. WISE consists of severalmodules that provide integration of GIS with hydrologic and hydraulic programs.The Open Inventory module was used to convert the structure and cross-section datafrom survey ASCII format into HEC-RAS input data format. The cross sections andstructures generated from the TIN layers in HEC-GeoRAS, for which survey data wasavailable, were adjusted in HEC-RAS with the surveyed cross sections and structuresdata exported from WISE.6
World Environmental and Water Resources Congress 2007: Restoring Our Natural HabitatFigure 3.Example of Stream Geometry for Credit River using ArcMAP with HEC-GeoRAS extension7 2007 ASCE
World Environmental and Water Resources Congress 2007: Restoring Our Natural Habitat 2007 ASCEThe channel banks and overbank flow path layers were drawn in ArcMapusing the existing FEMA 100-year floodplain boundary, topographic contours, fieldsurvey data, and aerial photographs. HEC-GeoRAS also has an automated tool thatoffsets the main channel to create the left and right channel banks.The bridge layer identifies the location of each channel crossing includingbridge, roadway, pedestrian bridges, and railroad crossings. The bridge lines weregenerated in ArcMap based on field survey data, aerial photographs, and streetshapefiles. A total of 160 crossings in Scott County main streams were identified,surveyed, and modeled. The flow lengths between the bridge cross sections and theupstream and downstream cross sections were determined by HEC-GeoRAS. Thehydraulic structure location, in stream miles, was estimated by intersecting the rivercenterline layer with the street shapefile and the location of surveyed structures.Manning’s roughness N-values were developed in HEC-GeoRAS based onthe MLCCS land use data for most areas in the county and the national GAP databasefor areas with no MLCCS data. Once the land uses were identified, typicalManning’s roughness values were assigned for each land use. Manning’s roughnessN-values polygon layers were developed by HEC-GeoRAS by intersecting theManning’s roughness N-values layer with the cross-section cut lines These valueswere imported into HEC-RAS as the starting point. The N-values incorporated intothe HEC-RAS hydraulic model were manually refined at the channel bottom utilizingstandard Manning’s roughness values, field survey observations, field surveyphotographs, and aerial photographs.Once the geometric data is prepared in HEC-GeoRAS, the data is importedinto the HEC-RAS model. The HEC-RAS model geometry should be reviewed andadjusted using field survey data to correct potential erroneous representations causedby DTM resolution constraints, such as poor resolution in the presence of treecanopy. The HEC-RAS model should be also checked for reasonableness of thehydraulic parameters assumed and water surface profiles obtained. HEC-RASAutomated Review Program, CHECK-RAS (Dewberry & Davis LLC. 2000), was usedfor this purpose.CHECK-RAS was applied to assess input data for accuracy and resolvewarning messages generated by the HEC-RAS model run. Specifically, CHECKRAS reviews geometric, steady-flow, and output data to verify that hydraulicparameter estimates and assumptions made in the model are justified and are inaccordance with the assumptions and limitations of the HEC-RAS software.CHECK-RAS was run iteratively to verify the reasonableness of Manning’sroughness N-values, contraction and expansion coefficients, cross-section geometry,floodway results, structure data, and flood profile results. The four HEC-RASmodels developed for Scott County were validated with CHECK-RAS and errorsdetected were corrected in HEC-RAS to improve the accuracy and quality of themodel. Figure 4 shows the selection of profiles in the CHECK-RAS interface.8
World Environmental and Water Resources Congress 2007: Restoring Our Natural HabitatFigure 4. 2007 ASCECHECK-RAS Interface Showing Selection of ProfilesThere are two ways to visualize the HEC-RAS modeling results. Results canbe displayed as X/Y coordinate plots or in spatial graphical maps. X/Y coordinateplots are two-dimensional graphs of the flooding profiles that show the relationshipbetween distance along the stream and water surface elevations. X/Y coordinate plotsof flood profiles can be automatically generated using RASPLOT. Spatial graphicalmaps are two-dimensional representations of flooding areas. These maps can beautomatically generated using HEC-GeoRAS.RASPLOT (Dewberry & Davis LLC. 2005) is a computer program thatcreates flood profiles by automatically extracting data from HEC-RAS input andoutput files. The final product from RASPLOT is in DXF file format (drawinginterchange format) which allows for editing and printing of profiles as necessary.Flood profiles for the 10-, 50-, 100-, and 500-year events were generated for the studystr
Minnesota Gap Analys is Program (GAP) . The MLCCS (Richardson 2 04) database has a very comprehensive land -cover classification system. However, the GAP data base consist s of a detailed vegetation cover map produced through computer classification of co