Transcription
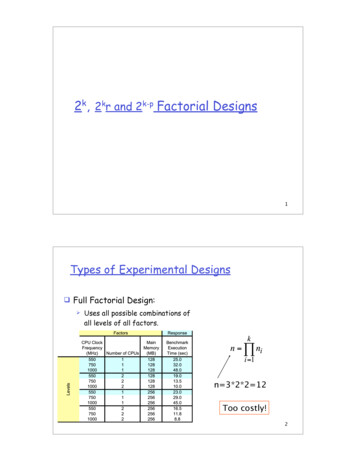
2k, 2kr and 2k-p Factorial Designs1Types of Experimental Designs! Full Factorial Design:"Uses all possible combinations ofall levels of all factors.n 3*2*2 12Too costly!2
Types of Experimental Designs! Reducing Cost of Full Factorial Design:"Reduce the no. of levels of each factor. If allfactors have 2 levels, we have a 2k factorialdesign."Reduce the number of factors."Use fractional factorial designs.3Types of Experimental Designs! Fractional Factorial Design:"Use a fraction of the fullfactorial design.n 3*2 6The factor memory size was eliminated.Some interactionsamong factors maybe lost!4
2k Factorial Designs52k Factorial Designs! 2k designs are used to determine theeffects of k factors, each of which havetwo alternatives or levels"Easier to analyze than full factorial designs"Help sort out factors in the order of theirimpact, especially when there are a largenumber of factors6
22 Factorial Designs! Special case of 2k design with k 2! Example: impact of cache size and memorysize on the performance of a computerCachesize (KB)Memory Size4 MB16 MB1154522575Performance in MIPS7Regression ModelLet y denote the performance of the computer. Wecan model y using a non-linear regression model asfollows:y q0 qa x a qb x b qab x a x b!where xa and xb are variables that represent thefactors memory size and cache size respectively,and the q’s are called effects8
Regression Model (con’td)Let#"1 if memory size 4 MBxa % 1 if memory size 16 MB#"1 if cache size 1 KBxb % 1 if cache size 2 KB!Substituting the four observations yields15 q0 " qa " qb qab45 q0 qa " qb " qab25 q0 " qa qb " qab!!!!75 q0 qa qb qab9!Regression Model (cont’d)There is a unique solution for the four effects:q0 40, qa 20, qb 10, qab 5. So, we have:y 40 20x a 10x b 5x a x bThus the mean performance is 40 MIPS, the effectof memory size is 20 MIPS, the effect of cache! size 10 MIPS, and the interaction betweenmemory and cache size accounts for 5 MIPS10
Computing effectsIn general, the model for a 22 design can besolved to obtain:1q0 (y1 y 2 y 3 y 4 )41qA ("y1 y 2 " y 3 y 4 )41qB ("y1"y 2 y 3 y 4 )!41q (y1"y 2 " y 3 y 4 )AB!411!!Sign table method for calculating 20Total4020105Total/412
Allocation of variation! The importance of a factor is explained by theproportion of the total variation in the responsethat is explained by the factor"If one factor contributes 90% of the variation whereasanother factor contributes only 5%, then the secondfactor may be considered relatively unimportant! The total variation of y or Sum of Squares Total(SST) is given by:22SST " (y i # y ) 2i 113!Allocation of variation (cont’d)For a 22 design, the variation can be divided intothree parts:2SST 2 2 qA2 2 2 qB2 2 2 qABwhere the three terms on the RHS represent theportion of the variation that is explained by theeffects of A, B, and the interaction AB! respectively (see derivation in textbook). ThusSST SSA SSB SSAB!14
ExampleFor the memory-cache example,y 1(15 55 25 75) 4044Total variation! " (y i # y ) 2 (25 2 15 2 15 2 35 2 )i 1 2100 4 20 2 4 10 2 4 5 2Thus, 76% (1600) of the total variation can be attributed to!memorysize, 19% (400) can be attributed to cache, and only5% (100) can be attributed to the interaction betweenmemory and cache.15General 2k Factorial Designs! The analysis techniques described so farfor 22 designs can be extended to that fora 2k design"Given k factors with two levels each, 2kexperiments are required and there are 2keffects"k%"k% k main effects, # 2'& two-factor interactions, # 3'&three-factor interactions, and so on The sign table technique for calculating effects!!and allocatingthe variation is applicable16
2kr Factorial Designs with Replications172kr Factorial Designs! Shortcoming of 2k design: cannot estimateexperimental error because no experimentis repeated! Solution: Replication"Repeat each experiment in a 2k design r timesyielding 2kr observations (called a 2kr design)"We will discuss k 2 Can be generalized as in 2k design (see section18.9 of Jain)18
22r Factorial Design! Model for 22 design is extended to add an errortermy q0 qA x A qB x B qAB x A x B ewhere the q’s are effects as before and e is theexperimental error! Holding the factor level constant and repeating!the experiment yields samples of the response yi! Statistical analysis of the yi’s yields the fractionof variation due to experimental error, andconfidence intervals for y19Computation of EffectsThe effects can be calculated using a sign table as before except that inthe y column we put the sample mean of r measurements at the givenfactor levelIABABYMean /4!20
Estimation of experimental errorsOnce the effects have been computed, the modelcan be used to estimate the response for anygiven factor values as:yˆ i q0 qA x Ai qB x Bi qAB x Ai x BiThe difference between the estimate and themeasured value yij in the jth replication of the ithexperiment represents the experimental error!eij y ij " yˆ i y ij " q0 qA x Ai qB x Bi qAB x Ai x Bi21!Sign table augmented with errorsIABAB(yi1,yi2,yi3)yˆ i1-1-11(15,18,12)1503-311-1-1(45,48,51) 48-3031-11-1(25,28,19) 2414-51111(75,75,81) 77-2-244121.5 9.5!ei1ei2ei3522rSSE " " eij2 102i 1 j 1!22
Allocation of variationLet y. represent the mean of responses from allreplications of all experiments. Then2SST " (y ij # y. ) 2 2 rqA2 2 2 rqB2 2 2 rqAB " eij2i, j!i, jSST SSA SSB SSAB SSEWe can also show that SST SSY - SS0, giving usan easier way to compute SSE:SSE SSY " (SS0 SSA SSB SSAB)!where SSY # y ij2 and SS0 2 2 rq02i, j23!ExampleFor our memory-cache exampleSSY 152 182 122 452 752 752 812 27,204SS0 12 x 412 20,172SSA 5547, SSB 1083, SSAB 300SSE 27,204 - 22x3(412 21.52 9.52 52) 102SST SSY - SS0 27,204 - 20,172 7032Thus, factor A explains 5547/7032 or 78.88% of thevariation, factor B explains 15.4%, interaction ABexplains 4.27% of the variation.The remaining 1.45% is attributed to experimentalerrors24
Confidence intervals for effects! The effects computed from a sample are randomvariables! We can calculate the confidence intervals for theeffects if we assume that"Errors are normally distributed with zero mean"Errors for different experiments are independent"Errors have a constant standard deviation! Under these assumptions, we can use the t-distribution to compute confidence intervals asdiscussed previously (Chapter 13, Jain)25Confidence intervals for effects! The sample variance of errors can beestimated from the SSE as follows:SSEse2 22 (r "1)sq20 sq2A sq2B sq2AB se2 /(2 2 r)! The confidence intervals for effects can!then be computed as qi t[1"# / 2;2 2 (r"1)]sq i26!
Example! For the memory-cache example,se SSE102 12.75 3.572 2 (r "1)8sq i se / (2 2 r) 3.57 / 12 1.03! The t-value for 8 degrees of freedom and 90%! confidence is 1.86. Thus, the confidence intervalsfor the effects areqi (1.86)(1.03) qi 1.92that is (39.08,42.91), (19.58,23.41), (7.58,11.41),(3.08,6.91) for q0, qA, qB, and qAB respectively!27Additional Reading (Jain)! Confidence intervals for predictedresponses: Section 18.6! Visual tests for verifying the model:Section 18.7! Multiplicative models: Section 18.8! General 2kr factorial design: Section 18.928
2k-p Fractional Factorial Designs29Fractional Factorial Designs! If we have 7 factors, a 27 factorial designwill require 128 experiments! How much information can we obtain fromfewer experiments, e.g. 27-4 8experiments?! A 2k-p design allows the analysis of k two-level factors with fewer experiments30
A 27-4 Experimental DesignConsider the 23 design below:Experiment -11-1811111111If the factors, AB, AC, BC, ABC are replaced by D, E, F,and G we get a 27-4 design31A 27-4 designIf the interactions AB, AC, AD, , ABCD are negligible we can use the tablebelowExperiment 46.7508.10.03Percentvariation32
Preparing the sign table for a 2k-p design1.Choose k-p factors and prepare a complete signtable for a full factorial design with k-p factors.There are 2k-p rows and columns in the table.The first column is marked I and consists of all 1’s.The next k-p columns correspond to the k-p selectedfactors. The remaining columns correspond to theproducts of these factors.2. Of the 2k-p-k p-1 remaining columns, select pcolumns corresponding to the p factors thatwere not chosen in step 1.Note: there are several possibilities; the columnscorresponding to negligible interactions should bechosen.33A 24-1 designExperiment 1-11-1811111111If the ABC interaction is negligible, we should replaceABC with D. If AB is negligible, we can replace AB with D.34
Confounding! The drawback of 2k-p designs is that the experiments only yieldthe combined effects of two or more factors. This is calledconfounding"On the previous slide, the effects of ABC and D are confounded(denoted as ABC D)! In a 2k-1 design, every column represents a sum of two effects."For our example, A BCD, B ACD, C ABD, AB CD, AC BD,BC AD, ABC D, I ABCD This means that columns for A, B, C, D actually correspond toA BCD, B ACD, C ABD, D ABC, etc."If we replace AB with D, I ABD, A BD, B AD, C A BCD, D AB, AC BCD,BC ACD, ABC CD! In a 2k-p design, 2p effects are confounded35Algebra of ConfoundingConsider the first design in which ABC is replacedwith D"Here, I ABCD"All the confoundings can be generated using thefollowing rules1. I is treated as unity.e.g. I multiplied by A is A1. Any term with a power of 2 is erased, e.g. AB2C isthe same as AC.The polynomial I ABCD is used to generate all theconfoundings for this design, and is called thegenerator polynomialThe second design in which AB was replaced by D in thesign table has generator polynomial I ABD36
Design Resolution! The resolution of a design is measured by the orderof effects that are confounded"The effect ABCD is of order 4, while I is of order 0"If an i-th order effect is confounded with aj-th order term, the confounding is of order i j"The minimum of orders of all confoundings of a design iscalled its resolution We can easily determine the resolution of a design bylooking at the generator polynomial, e.g. if I ABCD, thenthe design has resolution 4, if I ABD, the design hasresolution 3! In general, higher resolution designs are consideredbetter under the assumption that higher orderinteractions are smaller than lower-order effects37
3 Types of Experimental Designs! Reducing Cost of Full Factorial Design: " Reduce the no. of levels of each factor. If all factors have 2 levels, we have a 2 k factorial design. " Reduce the number of factors. " Use fractional factorial