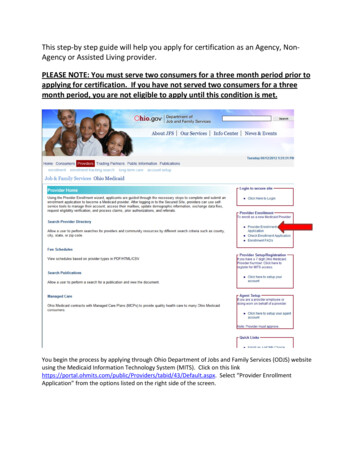
Transcription
PRACTICE QUESTIONSTO HELP YOU MASTER THE PART I FRM EXAMWiley 2016
FRM Exam Reviewefficientlearning.com/frmTop questions you must master to pass the Part I FRM ExamPreparing for the Part I exam is tough, but you can make life easier with an effective studyplan. If you have yet to get a plan, Wiley’s adaptive Digital Exam Planner in our Silver andSelf-Study FRM review courses will help you create a personalized plan down to the day,provide a dashboard to keep on track and track your progress every step of the way.But first, here are some questions to test your knowledge of typical, fundamental topics thatare likely to appear on the actual exam.1. The minimum variance frontier most likely consists of:A. 9.20%A. Individual assets only.B. 8.34%B. Portfolios only.C. 10.40%C. Individual assets and portfolios.D. 12.20%D. Only risk-free assets.Answer: DExpected return Rf R (Rm – Rf)Answer: BAssets with low correlations can be combined intoportfolios that have a lower risk than any of the individualassets in the portfolio. The minimum variance frontierconsists of portfolios that minimize the level of risk for eachlevel of expected return.2. Compute her portfolio’s standard deviation, if thecorrelation between the two assets equals 0.7.A. 8.05%II. Manager A’s Sharpe ratio is closest to:A. 0.51B. 0.40C. 0.20D. 0.68Answer: AB. 9.86%Sharpe ratio (RA – Rf) / RA (0.19 – 0.05) / 0.27 0.5185C. 7.06%III. Manager C’s Treynor ratio is closest to:D. 12.68%A. 0.20Answer: D2Expected return 0.05 1.2 (0.11 – 0.05) 12.20%222[(0.3 0.12 ) (0.7 0.0 ) 2 (0.3) (0.7) (0.12) (0.1414)0.5(0.7)] 12.68%3. Use the following information to answer the next fourquestions:The following information is available regarding theportfolio performance of three investment managers:ManagerReturnStandardDeviationB. 0.25C. 0.57D. 0.12Answer: DTreynor ratio (RC – Rf) / RC (0.16 – 0.05) / 0.9 0.1222IV. Manager C’s Jensen’s alpha is closest to:BetaA. 5.60%A19%27%0.7B. 10.40%B14%22%1.2C. 8.5%C16%19%0.9Market (M)11%24%D. 9.0%Risk-free rate5%I. Manager B’s expected return is closest to:Answer: AManager C’s expected return Rf R (Rm – Rf) 0.05 0.9(0.11 – 0.05) 10.4%Jensen’s alpha 16% 10.4% 5.6%Wiley 2016
FRM Exam Review4. Darren Peters, FRM, has gathered information on allthe monthly returns of actively managed portfolios andpassive indices. He is using multifactor models, of whichhe has examined many. Darren determines the optimalnumber of factors using the R-squares for differentmodels.He selects a model that has a reasonable but smallnumber of factors. He uses the difference in monthlyreturns between the managed portfolios and the marketindex represented by the S&P 500, represented as RTN, asthe dependent variable. The independent variables arethe S&P 500 return less the 90-day T-bill rate representedas MKT, the monthly returns to a passive portfolio of highEPS stocks less the returns of a passive portfolio of lowEPS stocks represented by EPSS, and the monthly returnsto a passive portfolio of small cap stocks less the returnsof a passive portfolio of large cap stocks, represented byLCSC.efficientlearning.com/frmonly systematic risk.The Sharpe ratio is standardized bysigma, not beta, so the Treynor ratio is the correct ratio touse in this case. The Treynor formula is Tρ [E(Rρ) – Rf] / βρ,which describes the difference between excess return oversystematic risk—the beta—which is what the question asks.6. Ashley selected a sample of 20 stocks and calculated theirmean return over a three-year period to be 4.25%. Giventhat the sample standard deviation is 0.3% and assumingthat the population is normally distributed, the 90% confidence interval is closest to:A. 4.13% to 4.37%B. 4.22% to 4.44%C. 4.14% to 4.36%Answer: AThe following results were derived for the historical data:Since the population variance is not known, but thepopulation is assumed to be normally distributed, and thesample size is small we must use the t-distribution.RTN –.0025 .15MKT – .08EPSS – .07LCSCStandard error 0.3 / (20) 0.06708Which of the following is not a reason to support the casefor active portfolio management?Degrees of freedom 20 1 19A. Failure of the CAPM beta to explain returnsB. Excess volatility in market pricesC. The existence of market anomaliesD. Efficient frontier theoryAnswer: DAll are valid reasons to support the case for active portfoliomanagement except for the efficient frontier theory. Theefficient frontier theory is the theory that all investorsallocate their money between the risk-free asset and thetangency efficient portfolio.5. Assume that you are concerned only with systematic risk.Which of the following would be the best measure to useto rank order funds with different betas based on theirrisk-return relationship with the market portfolio?A. Treynor ratioB. Sharpe ratioC. Jensen’s alphaD. Sortino ratioAnswer: ASystematic risk is the risk that can’t be diversified awayand the beta of our portfolio is:βP (ρPM * σP * σM) / σ2 where ρPM is the correlation coefficient between the portfolio and the market, σp is the risk ofthe portfolio, and σM is the risk of the market.In either case, beta explains the volatility of the portfoliocompared to the volatility of the market, which captures0.5For a 90% confi dence interval, we need 5% in either tail.The relevant t-score with 19 degrees of freedom is 1.7291.Confidence interval 4.25% (1.7291 0.067%) 4.13% to 4.37%7. Alexis is conducting research on the stock market of anemerging economy. She believes that the mean dailyreturn on the market’s all-share index is statisticallysignifi cantly different from zero. She randomly selects 50stocks that are traded on the country’s stock exchangeand calculates their average daily return to be 0.3%. Theindex that comprises all the shares in the country has adaily standard deviation of 0.2%. At the 5% level of significance, Alexis would most likely:A. Reject the null hypothesis, and conclude that themean daily return is not statistically significantlydifferent from zero.B. Fail to reject the null hypothesis, and conclude thatthe mean daily return is not statistically significantlydifferent from zero.C. Reject the null hypothesis, and conclude that themean daily return is statistically significantly differentfrom zero.Answer: CH0: μ 0; Ha: μ 0Since the population (index comprising of all shares tradedin the country) standard deviation is known, use the z-test.This is a two-tailed test. At the 5% level of significance, thecritical z-values for a two-tailed test are 1.96.0.5Test stat {(0.003 0) / [(0.002) / (50) ]} 10.607Wiley 2016
FRM Exam Reviewefficientlearning.com/frmSince the test stat (10.607) is greater than the uppercritical value ( 1.96), the null hypothesis is rejected. Alexiswould conclude that the mean daily return is statisticallysignificantly different from zero.8. Use the following information to answer the next fivequestions:SSRegression18.395Residual47.428A. 0.3879B. 736.14C. 0.0014An analyst regresses the bid/ask spread (dependentvariable) for a sample of 1,900 stocks against the naturallog of trading volume (independent variable). The resultsof the regression are provided below:ANOVAIV. The F-stat is closest to:Answer: BF-stat MSR / MSE (RSS / 1) / [SSE / (n – k – 1)]F-stat (18.395 / 1) / [47.428 / (1900 – 1 – 1)] 736.14139. Consider the following statements:Statement 1: The lower the risk aversion coefficient, thelower the negative impact of risk on portfolio pt0.629410.02663523.63094Slope coefficient 0.052480.002941 17.84427I. The coefficient of determination is closest to:Statement 2: The fact that indifference curves are upwardsloping suggests that investors experience diminishingmarginal utility of wealth.Which of the following is most likely?A. Only Statement 1 is correct.B. Only Statement 2 is correct.C. Both statements are incorrect.A. 0.2795D. Neither is correct.B. 0.3879Answer: AC. 0.7205Answer: ACoefficient of determination Explained variation / Totalvariation Coefficient of determination 18.395 / (18.395 47.428) 0.2795II. The correlation coefficient (r) is closest to:A. 0.6228B. 0.5286C. 0.5286Answer: BCorrelation coefficient (Coefficient of determination)0.50.5Correlation coefficient 0.2795 0.5286As the slope coefficient provided in the regression is anegative figure, so the correlation coefficient (r) is 0.5286.III. The standard error is closest to:Statement 1 is correct. A lower risk aversion coefficientmeans that the effect of risk on portfolio utility will belower.The fact that indifference curves are curved suggests thatinvestors exhibit diminishing marginal utility of wealth. Asmore risk is added to the portfolio, the increase in returnrequired increases at an increasing rate. The upward slopeof indifference curve tells us that investors are risk averse—in order to be indifferent between two portfolios withdifferent levels of risk, the high risk portfolio must offer ahigher return as well.10. The chief risk officer of your firm has asked you to decidebetween buying a futures contract on an exchange andbuying a forward contract directly in the OTC Space withthe firm’s best client. Both have the identical terms. Youfind that the forward price is higher than the futuresprice. What single factor acting alone would be a realisticexplanation for this price difference?A. 0.0984A. The asset is strongly negatively correlated withinterest rates.B. 0.1581B. The futures contract is more liquid and easier to clear.C. 0.0250C. The forward contract counterparty has a higherdefault probability.Answer: B0.5Standard error [SSE / (n – 2)]0.5Standard error [47.428 / (1900 – 2)] 0.1581D. The convenience yield on the forward contract is lessthan on the futures contract.Wiley 2016
FRM Exam ReviewAnswer: Aefficientlearning.com/frmAnswer: CForward contracts do not have a daily settlement featureand is the reason for the convexity impact on eurodollarfutures. The futures contract has a “free” option on thepotential to earn the risk-free rate of return on the markto mark movement of the futures price. This free optionimpact—also called the convexity impact—is closely relatedto both volatility of the futures and how closely negativelycorrelated with interest rates the underlying asset is. If thefutures contract moves higher in price, and you are longthe future (hence have an overnight gain), that gain will beinvested at lower rates.11. Sarah Carter is a trader in the arbitrage unit of a largebank. She finds that an asset is trading at USD 2,000, theprice of a 1-year futures contract on that asset is USD2,025, and the price of a 2-year futures contract is USD2,055. Assume that there are no cash flows from the assetfor two years. If the term structure of interest rates is flatat 1% per year, which of the following is an appropriatearbitrage strategy?A. Short 2-year futures and long 1-year futuresB. Short 1-year futures and long 2-year futuresC. Short 2-year futures and long the underlying assetfunded by borrowing for 2 yearsThe forward rate, FT , is given by the interest rate parityequation:Ft So e(r r )TfwhereSo is the spot exchange rate,r is the domestic (USD) risk-free rate, andrf is the foreign (EUR) risk-free rate.T is the time to delivery.Substituting the values in the equation:(0.01 0.02)Ft 1.35 e13. Jacquie Chan is an analyst with Donahue ManagementInc. She is studying value at risk as a means to measureand manage risk. Jacquie believes that using a riskbudgeting program based on VaR could significantlyenhance SIM’s risk management processes. Whenpresenting her idea to senior members of the firm,Jacquie receives the following responses: Amanda Peters, Chief Market Strategist: We havea solid process in place to determine the optimalasset allocation for various market conditions. Riskbudgeting is basically another way to conduct assetallocation. Kathy Hu, Chief Compliance Officer: We haveguidelines in place that include principal limits,sensitivity limits, and leverage limits. The thresholdsset under a risk budget program accomplish the samething. Thomas Archer, Director of Portfolio Management: Wealready use tools such as beta, standard deviation,and duration to determine risk. These tools arewidely used in the market and provide all the riskmeasurement we need.D. Short 1-year futures and long the underlying assetfunded by borrowing for 1 yearAnswer: C.01The 1-year futures price should be 2000 e 2020.10. The.01*22-year futures price should be 2000 e 2040.40.The current 2-year futures price in the market is overvaluedcompared to the theoretical price. To lock in a profit, youwould short the 2 year futures, borrow USD 2000 at 1%,and buy the underlying asset. At the end of 2 years, you willsell the asset at USD 2,055 and return the borrowed money.01*2with interest, which would be 2,000 e USD2040.40,resulting in a USD 14.60 gain.12. You are examining the exchange rate between theU.S. dollar and the euro and are given the followinginformation regarding the USD/EUR exchange rate andthe respective domestic risk-free rates:Current USD/EUR exchange rate is 1.35Current USD-denominated 1-year risk-free interest rateis 1% per year. Current EUR-denominated 1-year risk-freeinterest rate is 2% per yearAccording to the interest rate parity theorem, what is the1-year forward USD/EUR exchange rate?A. 1.24B. 0.95C. 1.34D. 1.37 1.336Which of the following is the least effective response forChan to use in countering Archer’s argument?A. When computed for fixed income portfolios, VaR usesinterrelationships between different yield curves.B. VaR accounts for illiquidity, which may be present inlarger positions.C. VaR is based on the current portfolio and does notrequire a large amount of historical datafor its computation.D. VaR is based on tracking error and does not require aspecific index for its computation.Answer: BVaR accoun
FRM Exam Review efficientlearning.com/frm 4. Darren Peters, FRM, has gathered information on all the monthly returns of actively managed portfolios and passive indices. He is using multifactor models, of which he has examined many. Darren determines the optimal number of