Transcription
Seattle Department of Transportation2019 ANNUAL STREETCAROPERATING REPORTSeptember 2020
CONTENTS1. EXECUTIVE SUMMARY.32. INTRODUCTION.52.1. Ordinance 124946.52.2. South Lake Union Streetcar.52.3. First Hill Streetcar.72.4. Center City Connector.73. FINANCIAL METRICS.83.1. Operations & Maintenance costs.83.2. Revenue.83.3. Investment in Streetcar Operations.84. PERFORMANCE METRICS.124.1. Ridership.124.2. Reliability.134.3. Productivity.144.4. Proposed Operations Improvements.145. OPERATIONS HIGHLIGHTS.175.1. Governance Structure and Budget Overview.175.2. Safety & Security Update.175.2.1. Changes to Streetcar Safety Management.18Table 1 - Projected Streetcar Balances and Investment Per Rider. 9Table 2 - First Hill Streetcar Financials. 11Table 3 - South Lake Union Streetcar Financials. 11Table 4 - First Hill Streetcar Performance. 15Table 5 - South Lake Union Streetcar Performance. 15Table 6 - Proposed Operations Improvements. 16Figure 1 - Seattle Streetcar System Map. 6Figure 2 - Seattle Streetcar Ridership (NTD Reported) 2015-2019. 12Figure 3 - On-Time Performance 2008-2019. 13
1. EXECUTIVE SUMMARYThis report reflects 2019 performance andfinancial metrics and does not capture thesignificant changes in ridership and operatingstatus resulting from the COVID-19 pandemic.Those changes will be described in the 2020Operations Report.The Seattle Streetcar system consists of twoseparate, modern streetcar lines: the South LakeUnion Streetcar (SLU), which opened in 2007,and the First Hill Streetcar (FHS), which openedin 2016. The system is owned and funded by theCity of Seattle, which partners with King CountyMetro to serve as the operator of the system onthe City’s behalf.Highlights from 2019 include:Systemwide ridership continued to grow in 2019,driven by First Hill StreetcarIn 2019, ridership on the Seattle Streetcarcontinued to grow, exceeding 2018 ridership by11%, or 182,000 riders. As in previous years,this growth was driven by substantial ridershipgrowth on the FHS line, which exceeded 2018ridership by 17%, or 193,000 riders. Ridershipon the SLU line continued trends from previousyears, remaining relatively flat, declining 2%, or10,000 riders from 2018.Fare revenue grew in 2019 on both linesORCA fare revenue, the primary source of farerevenue for the Seattle Streetcar, grew in 2019by approximately 18%, or 252,000 systemwide.This was driven by increases on both the SLUand FHS lines. ORCA revenue increased by 10%( 62,000) on SLU and by 24% ( 190,000) on FHSin 2019. This increase in revenue appears to bedriven in large part by a commensurate increasein ORCA usage. ORCA taps on SLU and FHSincreased by 10% and 22%, respectively in 2019,outpacing ridership gains. Increased ORCA usageis likely due to many factors, which could includeincreased ORCA distribution through employersor transit agency programs.City and County executed a new 5-yearagreement for streetcar operations andmaintenanceA year of cooperative negotiation between the Cityof Seattle and King County culminated in 2019with the execution of a new Interlocal Agreement(ILA) for the operations and maintenance of theSeattle Streetcar. The new agreement replacesthe expiring 2014 ILA and includes a number ofimprovements to the City-County relationship,including improved budgeting and invoicingprocedures and more efficient maintenanceby consolidating previously City-performedmaintenance functions with King County.2019 ANNUAL STREETCAR OPERATING REPORT 3
SDOT Streetcar Operations staff prepared toimplement new federal safety requirements2019 saw new changes to federal requirementsgoverning rail safety oversight. These changesrequire SDOT to assume new responsibilities inmanaging and planning streetcar safety; mostnotably, developing a Public TransportationAgency Safety Plan (PTASP). The new PTASPwill work in conjunction with a similar planfrom King County Metro and will be based on aSafety Management System (SMS) philosophy inaccordance with the new federal requirements.Under the new requirements, SDOT was requiredto certify that it has adopted a PTASP by July 20,2020. SDOT met this requirement in July 2020.4 SEATTLE DEPARTMENT OF TRANSPORTATIONSDOT continued work on spot improvementprojects to improve safety and reliabilitySDOT’s transit spot improvements programadvanced work on several spot improvementsto increase safety for bicyclists around streetcartracks and to reduce congestion and streetcartravel time and increase reliability. Notableprojects included delineation of the streetcar-onlylane on northbound Terry Avenue between Thomasand Mercer Streets, as well as signage, streetmarkings, and relocationof a bus zone along YeslerWay between Broadway and 14th Ave.
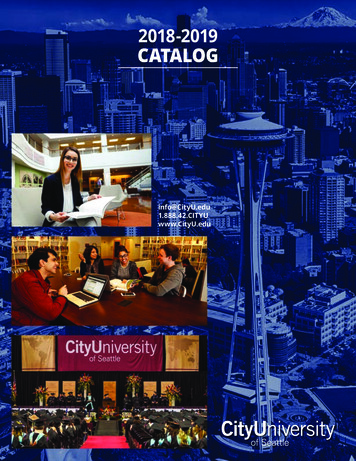
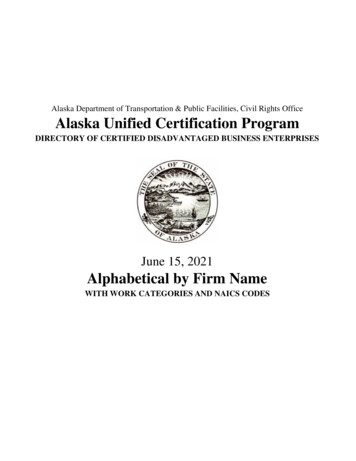
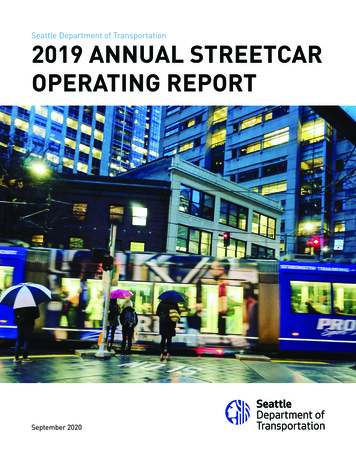
2. INTRODUCTION2.1. ORDINANCE 124946Ordinance 124946 requires the SeattleDepartment of Transportation (SDOT) to submit areport to the Chair of City Council’s Sustainabilityand Transportation Committee (now City Council’sTransportation and Utilities Committee) at leastbi-annually on the operations of all operatingstreetcar lines. This requirement has been inplace since December 2015.Ordinance 124946 states:“The report shall include both performance metricsand financial metrics; and will include data for the past5 years, estimates for the current year, and projectionsfor the next 5 years. Performance metrics shall includeridership, farebox recovery ratio, productivity (ridersper revenue hour), fare evasion, and reliability. Financialmetrics shall include costs, including operatingpayments to King County, SDOT direct costs andcontingency, and major maintenance expenditures;revenues, including farebox recovery, sponsorships anddonations, grants and intergovernmental revenues; andactual use of funds from the Consolidated (Residual)Cash Pool*1 for interim financing. Financial reportingshall identify variances from financial projectionsincluded in the Adopted Budget. The report shallinclude a narrative to describe any significant oroperational policy changes and explain any significantvariation from budgeted projections. SDOT mayadjust the performance and financial metrics with thewritten concurrence of the Chair of the TransportationCommittee, to reflect changes to reporting methodsfrom King County or other sources of data. Thereport shall be submitted in writing to the Chair of theTransportation Committee.”The Seattle Streetcar system consists of twoseparate, modern streetcar lines: the South LakeUnion Streetcar (SLU) and the First Hill Streetcar(FHS). A project to expand and unify the systemby connecting these two separate lines alongFirst Avenue and Stewart Street, the Center CityConnector, is currently paused.Figure 1 shows the South Lake Union and FirstHill Streetcar segment alignments along with theCenter City Connector.2.2. SOUTH LAKE UNION STREETCARThe South Lake Union (SLU) Streetcar wasapproved by the City Council in 2005 inresponse to efforts to develop the South LakeUnion neighborhood into a biotechnology andbiomedical research hub. The 56.4 million linewas funded nearly 50% by property owners alongthe alignment, via a capital Local ImprovementDistrict, and the remainder by federal, state, andlocal funds.The SLU line is 1.3 miles long and operatesthrough mixed traffic. The line is served by a fleetof four Inekon vehicles operating in mixed rightof way and powered exclusively by an overheadcontact system (OCS). SLU operates an average10- to 15-minute service frequency most hours ofthe day it operates, seven days a week.An interfund loan for streetcar operations is currentlysupported by the City’s Transportation Fund. Legislationfor the 2019-2020 Proposed Budget states that the loan issupported by the Move Seattle Levy Fund.12019 ANNUAL STREETCAR OPERATING REPORT 5
FIGURE 1 - SEATTLE STREETCAR SYSTEM MAPE GALER STE HIGHLAND STVolunteer ParkLake UnionMUSEUM OFHISTORY ANDINDUSTRYALOHA STEAVEVALLEY STLAKE UNIONPARKREPUBLICAN STE REPUBLICAN STBELLEVUE AVE EHARRISON STSTREETCARMAINTENANCEFACILITYE THOMAS STTHOMAS STCAPITOLHILL5STSTWARTNORASTSTEDARCHOLNISOADEME PIKE ST19TH AVE ESTBROADWAY EORMINEAVVEYARRTEH5TSESEATTLEUNIVERSITYE COLUMBIA STSWEDISHMEDICALCENTERE CHERRY EAVVEDAONISEAVDMA1ST & MADISONE JEFFERSON STBROADWAY & TERRACENRIOMACENTER CITYCONNECTORFIRSTHILLSTE TERRACE STSTSEATTLEMUNICIPALCOURTSEATTLECITY SEE ALDER STE SPRUCE STYESLER & BROADWAYRTES WASHINGTON STS5TH AVE SEAVEAV4TH AVE SE YESLER WAYYESLERTERRACEKobeTerraceParkEN3RD AVE SParkRBODTEXOccidentalParkNSOER City HallFFJE2NElliott BayFIRST HILLSTREETCARE FIR STSTCERASTSMITHTOWERPIONEERSQUARESTST KING COUNTY6TH AVE SESMJAPIER 50:WATER TAXISRDEALECHPIER 52PIONEER SQUARECOLMAN DOCK:WASHINGTON STATEFERRIES14TH & WASHINGTONCENTRAL DISTRICTS MAIN STNSIOENS2ND AVE ENAROYAHALLPIER 59:SEATTLEAQUARIUME MARION STBROADWAY & MARIONSTITYRSIVEUN1ST & UNCOMMERCIALCORERENPIKBOKAE SPRING STTESWestlakeParkPIKE PLACEMARKETASE UNION STPINWESTLAKECENTERMOORETHEATER2ND & STEWARTALTES14TH AVE EGINVIRWESTLAKE HUBMCGRAW SQUARES JACKSON STStreetcar StopOCCIDENTAL AVE S1ST AVE SNWAY SSKAProposed StreetcarALAStreetcarBLVDMAYNARD AVE SS DEARBORN STSS CHARLES ST90EVENTCENTEREDGAR MARTINEZ DR S6 SEATTLE DEPARTMENT OF TRANSPORTATION6TH AVE SSAFECO FIELDS ATLANTIC STYSWARTPOAIRLandmarkSTREETCARMAINTENANCEFACILITYS PLUMER STProposed Streetcar StopSound Transit Link Light Rail StationS LANE STSCENTURY LINKFIELDLEVERAATTS WELLER STINIESE12TH & JACKSONLITTLE SAIGONS KING STRAUWAJIMAYAVILLAGELEGEND7TH & JACKSONCHINATOWNCHINATOWNINTERNATIONAL DISTRICT12TH AVE SUNION 5TH & JACKSONSTATION JAPANTOWN10TH AVE SKINGSTREETSTATION/AMTRACK8TH AVE SS KING ST7TH AVE SOCCIDENTAL MALLS JACKSON STN20TH AVE E18TH AVE E16TH AVE E17TH AVE E13TH AVE E15TH AVE E11TH AVE E12TH AVE EE PINE STBROADWAY & PIKE-PINEIASTE OLIVE STYWAIVELEE HOWELL STCalAndersonParkNAGLE PLAVEWESTLAKE & 7THBELLTOWNBLANSTHL9TSEATTLECENTRALCOLLEGEHARVARD AVE ESTLLBEAVEAVEELBATTHHBROADWAY & DENNYCAPITOL HILLAVEHOWERYST7T6TEDENNYTRIANGLEAVEMELROSE AVE EHBELLEVUE AVE E8TE DENNY WAYSUMMITAVE EYALE JOHN STEODENNY WAYWESTLAKE &9TH-DENNYBOYLSTON AVE EPONTIUS AVE NMINOR AVE NTERRY AVE NBOREN AVE NFAIRVIEW AVE NSOUTHLAKE UNIONDenny ParkE HARRISON STEWAYTERRY &THOMASBELMONT AVE EWESTLAKE & THOMASLIV8TH AVE N9TH AVE NE MERCER STSOUTH LAKEUNIONSTREETCARWESTLAKE AVE NBROADMERCER STTERRY & MERCERWESTLAKE & MERCERDEXTER AVE NE ROY STYALE AVE NSTROY STAURORA AVE NE ALOHA STNTCENTERFOR WOODENBOATS14TH AVE EParkFAIRVIEW &CAMPUS DRIVEOLMBELake UnionLakeUnionParkVALLEY STE PROSPECT ST10TH AVE EFAIRVIEWAVENSEATTLE ASIANART MUSEUM
The SLU line started operations on December12, 2007. It conveniently connects thousandsof jobs in the South Lake Union neighborhoodto the downtown core and additional regionaltransit connections at the Westlake HUB. Thereare nine stops along the alignment leading torestaurants, retail, businesses and Lake Union’s12- acre waterfront park. The southern terminusat Westlake/McGraw Square is a block awayfrom Monorail and Link Light Rail stations atWestlake Center. SLU is served by an Operationsand Maintenance Facility (OMF) located at 318Fairview Ave N.2.3. FIRST HILL STREETCARThe First Hill Streetcar connects major medicalfacilities, Seattle Central College, SeattleUniversity, and mixed income communities to theKing Street mobility hub. The First Hill Streetcarline was funded by Sound Transit. Due to highconstruction and engineering risks, Sound Transitremoved the proposed First Hill station fromthe North Link preferred route in July 2005 andconstructed a streetcar connection instead.The First Hill Streetcar line is 2.5 miles long. Itoperates with six Inekon vehicles, provides anaverage 10- to 18-minute service frequency mosthours of the day it operates, seven days a week.FHS is served by an Operations and MaintenanceFacility (OMF) located at 848 7th Ave S. The linewas funded as part of the Sound Transit 2 masstransit expansion ballot measure approved byvoters in November 2008. It was approved by theSeattle City Council in December 2008. SoundTransit developed an interlocal agreement withthe City of Seattle for the City to design andconstruct the transit line. Construction began inlate April 2012.The line opened with a soft launch on January 23,2016, with two weeks of free rides until the grandopening on February 13, during the Lunar NewYear celebrations in Chinatown- InternationalDistrict.2.4. CENTER CITY CONNECTORThe Center City Connector (C3) project is anexpansion of the Seattle Streetcar system thatwill join the existing SLU and the FHS lines,creating new north-south connections fromStewart St. in Westlake to Jackson St. in PioneerSquare. The project is anticipated to be fundedthrough a combination of local and federal funds,including a Federal Transit Administration (FTA)Small Starts grant.SDOT has been advancing the C3 project since itsinclusion in the 2012 Seattle Transit Master Planand 2016 update.In March 2018, SDOT paused all work on the C3project pending an independent review of operatingand capital costs led by the City Budget Office. InJanuary 2019, Mayor Durkan announced that theresults of the third-party analyses showed that theoverall capital cost of the project had increasedsignificantly from the budget passed in 2017. InAugust 2019, City Council authorized 9 Million infunding to advance design and planning work torestart the C3 project. The Mayor also announcedthat she would work with community members,members of the City Council, transit partners,businesses, and stakeholders to move forwardon the project. In September 2019, Mayor Durkanproposed a new tax on Transportation NetworkCompany (TNC) trips, the proceeds of which willbe used to close the capital shortfall. City Councilapproved the new TNC tax in December 2019.SDOT continued working with the FTA to advancethe City’s Small Starts grant application for theproject. This process requires extensive oversightreview by FTA and has contributed to theextension of the timeline of the project.As of June 23, 2020, this project is on hold. Thedecision to put a pause on this project, along withmany others, is in response to the significantdecline of revenues for the City and our fundingpartners related to the COVID-19 crisis. For thepurposes of this report, future year projectionsinclude only SLU and FHS operations.2019 ANNUAL STREETCAR OPERATING REPORT 7
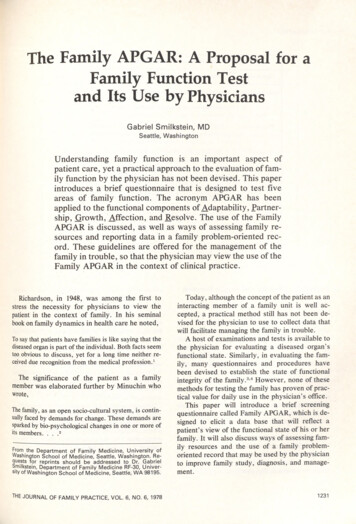
3. FINANCIAL METRICS3.1. OPERATIONS & MAINTENANCECOSTSOperations and maintenance costs for the SeattleStreetcar increased by a total of 7.5% in 2019.O&M costs for the FHS line increased by 8.6%and on SLU by 4.9%. In addition to budgeted costincreases, the larger increase on FHS reflectssome high cost spare parts purchases in 2019,such as pantographs, which connect the streetcarto overhead wire. Additional spare purchaseswere initiated in 2019, such as traction controland battery units, as well as equipment requiredfor upcoming scheduled maintenance overhauls.Detailed financial metrics, including historic andprojected operations and maintenance costs, canbe found in Table 2 and Table 3.3.2. REVENUEORCA revenue, the single largest source of farerevenue for the system, increased systemwidein 2019, by 18% ( 252,000). This increase wasdriven by increases on both the SLU and FHSlines of 10% and 24%, respectively. ORCA revenueper boarding in 2019 remained consistent with2018, averaging 1.53. This reflects the fact thatstreetcar has one of the highest transfer ratesunder the ORCA system, averaging 64% in 2019.This means that a high percentage of streetcartrips taken using the ORCA Passport productalso involve other ORCA modes of transit (e.g.,Metro bus, Link Light Rail). As ORCA Passportrevenue for a given trip is shared between themodes of travel involved according to a complexformula, this high transfer rate translates to alower revenue per boarding. This does suggest,however, that streetcar is being used frequently8 SEATTLE DEPARTMENT OF TRANSPORTATIONin conjunction with other transit modes as part ofthe larger transit network.Sponsorship revenue on the SLU line continued tobe popular in 2019, with revenue increasing 10%over 2018. Systemwide, however, sponsorshiprevenue declined significantly, driven by alack of sponsorship revenue on the FHS line.Sponsorship revenue comes from the sale ofexterior streetcar vehicle wraps, interior signage,and station stop shelter wraps.Metro and Sound Transit contributions to the SLUand FHS lines, respectively, continued to be thelargest sources of streetcar revenue in 2019. TheSound Transit contribution to FHS of 5.0 millionannually concludes in 2023, while the Metrocontribution to SLU of 1.55 Million annuallywill continue for another five years through 2024under the new Interlocal Agreement executed atthe end of 2019.Detailed financial metrics, including historic andprojected revenues, can be found in Table 1 andTable 23.3. INVESTMENT IN STREETCAROPERATIONSStreetcar revenues do not fully cover operationsand maintenance costs. As such, the City investsother transportation focused resources, such asCommercial Parking Tax and Street Use Fees,to maintain service levels. Table 1 shows theprojected funding investments required by eachstreetcar line.
TABLE 1 - PROJECTED STREETCAR BALANCES AND INVESTMENT PER ed Streetcar BalancesSLU 66,000)(2,196,000)(2,436,000)(4,236,000)FHS 12,726,000)(15,056,000)Total AdditionalInvestment NeededOperating Investment per riderSLU ProjectedInvestment per rider 1.53 2.90 3.47 3.91 4.37 4.84 8.42FHS ProjectedInvestment per rider 2.29 2.44 2.66 2.90 3.14 6.56 6.70 2.08 2.56 2.87 3.16 3.44 6.14 7.11Combined OperatingInvestment per rider*Reflects pre-COVID-19 activity. COVID-19 impact has not yet been estimated and is not included here.Nearly all public transit systems require somesubsidy in addition to fares to meet operatingexpenses. The extent to which fare revenuecovers operating expense is measured using thefare recovery ratio.In 2019, farebox recovery ratios for SLU andFHS were 20% and 12%, respectively, despiteincreases in fare revenue. By comparison,Portland Streetcar fare recovery is reported at14% for 2017 and 13% for 2018.2 Sound TransitLink Light Rail fare recovery rate for 2017 isreported at 42% for 20173 and 38.3% for 2018.4It should be noted that Link Light Rail employsa robust fare enforcement program, whileSeattle Streetcar does not have dedicated fareenforcement officers. King County Metro alsoemploys dedicated fare enforcement officers forSource: Portland Streetcar 2018 Annual Report, https://storage.googleapis.com/streetcar/files/FNL REV StreetcarAnnual-Report-2018 Digital.pdf3Source: Sound Transit December 2017 Service PerformanceReport, 017-service-performance-report.pdf4Source: Sound Transit December 2018 Service PerformanceReport, d Ride routes. King County Metro bus fareboxrecovery is reported at 27.3% for 2017.5 TacomaLink streetcar operates fare free until 2022.Metro Streetcar Operation Supervisors conductfare inspection surveys on the SLU and FHS linesfor approximately one hour per shift per day tocollect data on fare payment. The Supervisor usesa smartphone equipped with the King CountyORCA inspection application to scan ORCA cardsand visually inspects paper tickets. The StreetcarOperations Base Chief compiles the dailyreports generated by the Operations Supervisorsand includes the results in monthly streetcaroperations reports to SDOT. Based on this limitedinformation, the rate of non-payment for SLU in2019 was 7.1%, down from 8.5% in 2018. The rateof non-payment for FHS was 20.2% in 2019, downslightly from 20.5% in 2018.2Source: King County Metro, annual.aspx#metro-bus-fareboxrecovery52019 ANNUAL STREETCAR OPERATING REPORT 9
Given the minimal time allocated to this datacollection activity, the number of surveyedpassengers relative to ridership is small. In2018, less than 1% of riders were surveyed onFHS, and only 1.3% were surveyed on SLU. MetroSupervisors are not authorized to issue citationsfor non-payment and do not collect data on thereasons for non-payment.10 SEATTLE DEPARTMENT OF TRANSPORTATIONAs a possible future activity, SDOT may consideradditional data collection and surveying on thetwo streetcar lines to more fully understand farepayment behaviors and circumstances which mayprevent riders from proper fare payment.
2019 ANNUAL STREETCAR OPERATING REPORT 11Surplus/(Deficit)14 150,000 (1,794,654) (1,261,005) 150,000 - - 59,569 709,780 769,349 127,354 127,354 - - 81,443 654,963 736,406 5,000,000 5,919,349 1,146,077 6,567,926 7,714,003 7,714,0032017Historical (1,839,937) 152,631 152,631 - 258,185 65,199 780,878 846,077 5,000,000 6,256,893 759,109 7,337,722 8,096,831 8,096,8312018 (2,482,512) 58,500 58,500 258,064 258,064 63,197 984,664 1,047,861 5,000,000 6,364,425 1,260,030 7,586,907 8,846,937 Operating tionFaresORCAPay Stations& PassesFTA FundingGrants –5307/5309CapitalImprovementOtherSponsorship318 FairviewLeaseAmazonContributionSurplus/(Deficit) 579,991 512,986 67,005 - (1,478,194) - (1,477,758) 166,865 514,900 348,035 521,188 418,036 103,152 2,725,742 368,531 1,616,079 -2014 3,094,273 3,094,273 244,910 244,910 - 90,311 279,496 189,185 855,820 756,504 99,316 2,683,116 174,868 1,380,226 -2013 2,857,984 2,857,984 (107,473) 156,606 570,028 324,082 89,340 6,110 551,688 545,578 551,276 465,698 85,578 2,798,008 332,457 3,022,992 1,350,0002015 3,130,465 3,130,465 (232,569) 214,000 603,958 300,618 89,340 - 54,442 54,442 736,833 595,117 141,716 (3,820,000) 20,000 20,000 100,000 100,000 70,000 860,000 930,000 5,000,000 6,050,000 1,340,000 8,530,000 9,870,000 9,870,0002021 (4,290,000) 20,000 20,000 100,000 100,000 70,000 860,000 930,000 5,000,000 6,050,000 1,380,000 8,960,000 10,340,000 10,340,0002022 (317,882) 221,000 648,032 337,692 89,340 - 194,057 194,057 759,148 658,355 100,793 3,022,833 346,286 3,051,237 1,450,000 (4,780,000) 20,000 20,000 100,000 100,000 70,000 860,000 930,000 5,000,000 6,050,000 1,420,000 9,410,000 10,830,000 10,830,0002023 (10,290,000) 20,000 20,000 100,000 100,000 70,000 860,000 930,000 - 1,050,000 1,460,000 9,880,000 11,340,000 11,340,0002024Projections *2025 (10,820,000) 20,000 20,000 100,000 100,000 70,000 860,000 930,000 - 1,050,000 1,500,000 10,370,000 11,870,000 11,870,0002026 (11,390,000) 20,000 20,000 100,000 100,000 70,000 860,000 930,000 - 1,050,000 1,550,000 10,890,000 12,440,000 12,440,0002027 (11,980,000) 20,000 20,000 100,000 100,000 70,000 860,000 930,000 - 1,050,000 1,600,000 11,430,000 13,030,000 13,030,000 237,000 492,500 255,500 - - 172,042 172,042 912,635 805,704 106,931 3,625,795 585,470 3,127,177 1,550,000Adopted2019 4,211,265 4,211,265 (782,468) (1,084,088) 229,000 548,820 192,500 127,320 - 52,249 52,249 728,677 624,312 104,365 3,154,660457,554.58 2,829,746 1,500,0002018 3,612,215 3,612,215 237,000 437,000 200,000 - - 172,042 172,042 730,067 625,702 104,365 3,753,769 603,034 2,889,109 1,550,000Adopted2020 4,356,803 4,356,803 237,000 437,000 200,000 - - 90,000 90,000 720,000 630,000 90,000 3,940,000 620,000 2,797,000 1,550,0002021 4,560,000 4,560,000 237,000 437,000 200,000 - - 90,000 90,000 720,000 630,000 90,000 4,140,000 640,000 2,797,000 1,550,0002022 4,780,000 4,780,000 237,000 437,000 200,000 - - 90,000 90,000 720,000 630,000 90,000 4,350,000 660,000 2,797,000 1,550,000 254,000 454,000 200,000 - - 90,000 90,000 720,000 630,000 90,000 4,570,000 680,000 2,814,000 1,550,0002024 5,250,000 5,250,000 254,000 454,000 200,000 - - 90,000 90,000 720,000 630,000 90,000 4,800,000 700,000 1,264,000 -2025 5,500,000 5,500,000 200,000 200,000 - - 90,000 90,000 720,000 630,000 90,000 5,040,000 721,000 1,010,000 -2026 5,761,000 5,761,000 200,000 200,000 - - 90,000 90,000 720,000 630,000 90,000 5,292,000 742,630 1,010,000 -2027 6,034,630 6,034,630 (789,082) (1,467,694) (1,763,000) (1,263,833) (2,213,000) (2,436,000) (4,236,000) (4,751,000) (5,024,630) 237,000 576,043 211,723 127,320 97,573 97,573 775,379 688,146 87,233 3,410,686 377,391 2,998,995 1,550,000Actual2019 3,788,077 3,788,077Projections *2023 5,010,000 5,010,000 (3,395,201) - - 100,000 100,000 65,199 860,179 925,378 5,000,000 6,025,378 1,297,831 8,122,748 9,420,579 9,420,5792020AdoptedTABLE 3 - SOUTH LAKE UNION STREETCAR FINANCIALSHistorical20162017 3,027,802 3,369,119 3,027,802 3,369,119 2,852,740 175,062 2,795,233 1,400,000 - - - - 59,398 970,065 1,029,463 5,000,000 6,029,463 1,000,086 7,794,924 8,795,010 8,795,0102019Actual (2,765,547)*Reflects pre-COVID-19 Activity. Impacts of COVID-19 have not been estimated and are not included here.SponsorshipOtherGrants – 5307/5309131211FTA FundingPay Stations & Passes10ORCAFares79Sound Transit Contribution68 5,863,760Revenues5 5,000,000 1,030,245City4 6,094,519 7,124,764Metro/KCMOperating & Maintenance2 7,124,7643Costs12016TABLE 2 - FIRST HILL STREETCAR FINANCIALS
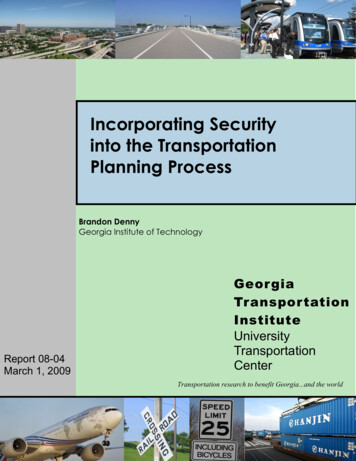
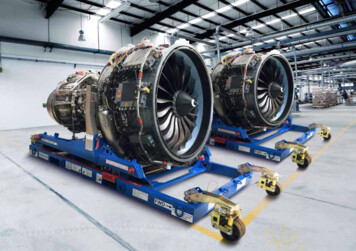
4. PERFORMANCE METRICS4.1. RIDERSHIPRidership on the Seattle Streetcar system grewsignificantly in 2019 due to major increases on theFHS line.Ridership on FHS line (as reported by Metro tothe National Transit Database) increased by 17%from 2018 to 2019. Ridership on the FHS totaledapproximately 1,350,000 riders, an increase ofapproximately 190,000 over 2018. This continues atrend of robust ridership growth on the FHS sinceit opened in 2016.Ridership on the South Lake Union linedecreased by approximately 2% in 2019, witha total of approximately 503,000 riders. Thistotal represents a decrease of approximately10,000 riders from 2018. It should be notedthat bus service through the South Lake Unionneighborhood began in 2016 and is among thehigher ridership routes in the Metro system,providing frequent connection into South LakeUnion. Installation of transit priority alongWestlake Ave. benefitting streetcar servicealso benefitted parallel bus routes such asthe RapidRide C and Route 40. In addition toincreasing bus options, increased TNC activityand employer shuttle service provide competingtransportation options as well as increasedcongestion, which negatively impacts streetcarspeed and reliability, and may be factorscontributing to SLU ridership declines.Overall, these totals added up to a combinedsystem-wide ridership of 1,856,000 riders, anincrease of 11%, or approximately 182,000 riders,over 2018.FIGURE 2 - SEATTLE STREETCAR RIDERSHIP (NTD REPORTED) 49840,04912 SEATTLE DEPARTMENT OF 042019503,3741,352,470
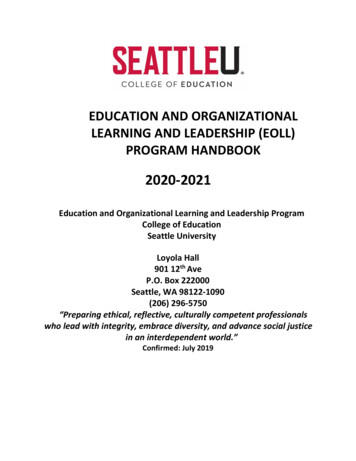
4.2. RELIABILITYReliability for the FHS line, as measured by OnTime Performance (OTP), dipped slightly in 2019from 88.43% to 87.25%, while OTP on the SLU linedeclined from 39.30% to 31.69%Reliability is measured based on the arrival timeof a given streetcar at designated points along theroute between 7:00am and 7:00pm relative to thescheduled arrival time. A streetcar is “on-time” ifit arrives within a window five minutes prior to orlater than the scheduled time at the designatedtime point. Metro reports on-time performanceto SDOT
Seattle City Council in December 2008. Sound Transit developed an interlocal agreement with the City of Seattle for the City to design and construct the transit line. Construction began in late April 2012. The line opened with a soft launch on January 23, 2016, with two weeks of free rid