Transcription
The Economistvisual styleguideVersion 1.2 // Updated 4 May 2017mattmclean@economist.com
2Table of contentsOverview3 what’s changed?Chart typesChart styling4 Chart sizes13 Bar/column, side by side21 Double-scale charts5 Typefaces14 Bar/column, stacked22 Blob-heads6 Print15 Line, side by side23 Timelines7 Web16 Line, stacked25 Miscellaneous styling8 Leader block /World this Week17 ThermometerChart elements9 Espresso10 Panel chartsColour11 Print palette12 Web palette18 Scatter19 Table20 Pie / Doughnut26 Resources
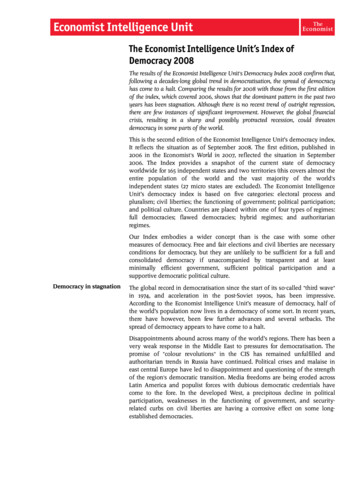
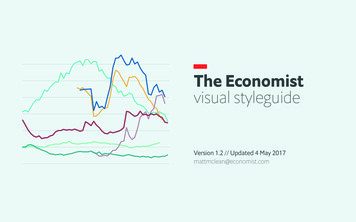
3overviewWhat’s changedWeb charts24pt spacer between panelsOLD DESIGNNEW DESIGNrotated tagThe real dealNew typeface“World” real interest rateAverage ten-year inflation-indexed bond yield, %Drivers of the change in interest ratesG7 countries, excluding Italy1980-2015, percentage points0Growth–*5Marker for panels3SpreadsRelative price of capital 0–1985909520000510161Average ten-year inflation-indexed bond yield, %G7 countries, excluding Italy5InequalityGlobal savings glutPublic investmentUnexplained*New colour paletteDemographics1White background“World” real interest rate142The real dealDrivers of the change in interest rates1980-2015, percentage points04Growth3Demographics-12321405Sources: “Measuring the ‘world’ real interest rate”, by M. King and D. Low, NBER working paper, Feb 2014; “Secular drivers*The Economist estimateof the global real interest rate” by L. Rachel and T. Smith, Bank of England working paper, Dec 2015; The Economist-1198590952000051016Sources: “Measuring the ‘world’ real interest rate”, by M. King and D. Low,NBER working paper, Feb 2014; “Secular drivers of the global real interest rate”by L. Rachel and T. Smith, Bank of England working paper, Dec 2015; The EconomistNo margins-2SpreadsRelative price of capitalInequalityGlobal savings glutPublic investmentUnexplained-3-4-5*The Economist estimateSource text 75% black
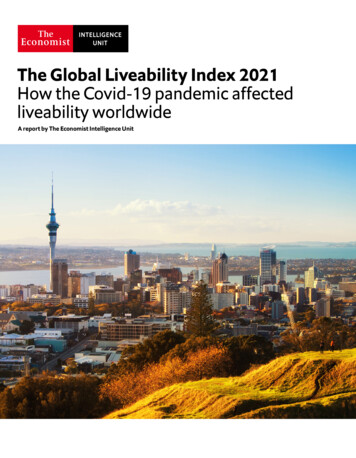
4elementsChart sizesprint width (pts)web equivalent (px)160pts / 290px332pts / 595px117pts / 290pxSTANDARD PRINTLEADER /WTW1 COLUMNfixed height83.5pts / 207px2 COLUMN504pts245pts3 COLUMNFREE EXCHANGESPECIAL REPORT / TQ / ESSAY117pts1/2COLUMN160pts / 290px2/3COLUMN245pts332pts / 595px1 COLUMN2 1/2 COLUMN
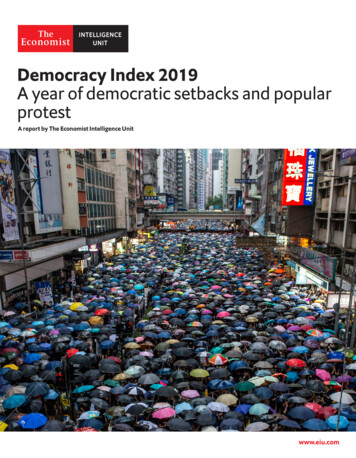
5elementsTypefacesUSE FORChart headlines.Oversize numbers and labels.Use rarely.Use rarely - prominentlabelling onlyEcon Sans UVWXYZ1234567890!@ % &()?Econ Sans Cnd UVWXYZ1234567890!@ % &()?Top-level chart labelsPanel headingscoloured textSub titlestandard chart PQRSTUVWXYZ1234567890!@ % &()?Econ Sans Cnd STUVWXYZ1234567890!@ % UVWXYZ1234567890!@ % &()?Econ Sans Cnd RSTUVWXYZ1234567890!@ % &()?Axis labelssource UVWXYZ1234567890!@ % &()?Econ Sans Cnd TUVWXYZ1234567890!@ % &()?Footnote symbolsorder of VWXYZ1234567890!@ % RSTUVWXYZ1234567890!@ % &()?45678* † ‡ § ** †† ‡‡ §§
6elementsACTUAL SIZEChart dimensionsStandard printDIMENSIONS AND TYPE SIZES160ptsWhere Tokyo leadsTen-year government-bond yields, %Period beginning:January 1989 ( Japan)6 15January 1999 (US)8176411215015101310Years since startSource: Thomson Reuters10656Econ sans bold 9.5/11ptEcon sans cnd regular 8/9.5Econ sans cnd medium 7.5/9cnd light 7.5/9cnd light 7.5/9cnd light 7pt61654With sub-subtitle2Less cash, less credit0India, bank credit to the commercial sector% increase on a year earlier3010251020101515axis label cnd reg 7/7.5Source: cnd light 6.5pt 75k10502000 0204 060810 121416Source: Thomson ReutersWhere possible, put units and dateinformation on a second line atsmaller font sizeEcon sans bold 9.5/11ptEcon sans cnd regular 8/9.5light 7.5/910TICKMARKS0.5pt thickness5 3 2height0.4pt thickness137 1pt
7elementsChart dimensionsStandard webACTUAL SIZENational anthem monopoliesUnited StatesEast GermanyNumber of “medal sweeps” by countryWeb charts are built at standard printwidths and then exported at 179.22%Soviet UnionOther1210BUILT ATAPPEARS s: International Olympic Committee; Sports Reference; The Economist096200004081216*Unified team of ex-Soviet republics332pts15DIMENSIONS AND TYPE SIZES17115National anthem monopoliesUnited StatesEast GermanyNumber of “medal sweeps” by countrySoviet 8Sources: International Olympic Committee; Sports Reference; The Economist9296200004081216*Unified team of ex-Soviet republics
8elementsChart dimensionsleader block /world this weekACTUAL SIZE117ptsUS consumer prices% increase on a year earlier11301213146123Fed target 22011leader charts are exportedfor the web at 247.86%DIMENSIONS AND TYPE SIZES159Econ sans bold 8ptEcon sans cnd reg 7ptlight 6ptmedium 6pt110583.5pts(Leader blockfixed height)0201112131415Leader blocks should be simplified as much as possible, with minimal grid lines and tick-mark labellingEmphasis should be on showing a clear overall message, rather than identifying values for every data point.Property taxesReturn on assetsChinese industrial enterprises*, %Private-owned105State-owned 0199920051015*7-month moving averageAs % of total market value, 2014AnnualNew YorkRenewable energyTransaction0.8 0.2India2004London0.4ArgentinaNew investment*, bn0.45.1China201410.1045.21478.9*Includes estimates for undisclosed deals2.19.1GDP, % increaseon year earlier20112015*Budget deficitas % of GDP-2.9-5.6 0Deaths from terrorismUnited StatesW. Europe200100020112015**forecastAPPEARS AT117pts290px83.5410BUILT AT2005 1016*051016**To August 31st208
9elementsChart dimensionsespressoACTUAL SIZE160ptsDIMENSIONS AND TYPE SIZES6LA (CHART AS LEAD IMAGE)15Fixed depth, blank spacer at bottom of chart109.5106Econ sans cnd bold 8ptEcon sans cnd reg 8ptcnd light 7.5pt8CONTENT120ptUS retail salesExcluding motor vehicles and parts,% change on a year earlier4084-40-4-8-82007 08091011121314152007 08Source: US Department of Commerce509101112131415Source: US Department of CommerceLEAVEBLANK40pt160ptsDA (CHART IN ARTICLE BODY)No fixed depth - same type sizes as standard chartEcon sans bold 9.5/11ptEcon sans cnd regular 8/9.53United StatesBelow the horizon2Ten-year government-bond yields,%3GermanyUnited States2Germany11Japan0Japan0-120141516-1Source: Thomson Reuters2014Source: Thomson Reuters1516OVERALLDEPTH160pt
10elementsChart dimensionspanel chartsACTUAL SIZELANDSCAPERacyUnited StatesDonald Trump’s media dominanceand polling surgeTV mentions*, % of totalPolling average, %1005080406030402020100Support for Trump v racial resentmentand authoritarianism†,Republican primary votersVoter support, %60AuthoritarianismRacial resentment2000J JASONDJF2015MA MLOWEST2016Sources: GDELT; RCP; YouGov40Degree of authoritarianismLevel of resentmentHIGHEST*National news mentions of Trump compared with all Republican candidates †Poll Jul 30th-Aug 6th 2016DIMENSIONS AND TYPE SIZESPORTRAIT332ptsRacyUnited States6Donald Trump’s media dominanceand polling surgeTV mentions*, % of totalPolling average, %100804060304020201000J JASO2015NDJFMAuthoritarianism151040Racial resentment200Sources: GDELT;RCP; YouGov10815Voter support, %60Degree of authoritarianismLevel of resentment11A M2016Support for Trump v racial resentmentand authoritarianism†,Republican primary votersLOWEST1750HIGHEST*National news mentions of Trump comparedwith all Republican candidates†Poll Jul 30th-Aug 6th 201624RacyUnited States10x1ptDonald Trump’s media dominanceand polling surgeTV mentions*, % of totalPolling average, %100Support for Trump v racial resentmentand authoritarianism†,Republican primary votersVoter support, %6050804060304020201000J JASON2015Sources: GDELT; RCP; YouGovDJFM2016A MAuthoritarianism40Racial resentment200LOWESTDegree of authoritarianismLevel of resentmentHIGHEST*National news mentions of Trump compared with all Republican candidates †Poll Jul 30th-Aug 6th 2016
11colourChart palettePRINTSECONDARYMAINECON REDRED1RED TEXTBLUE1BLUE2BLUE2 TEXTC0M 100Y 100K0C 10M 70Y 50K0C 12M 80Y 60K0C 90M 50Y 15K5C 67M0Y 18K0C 82M0Y 18K8C 12M 30Y 70K0C0M 75Y 35K 45C 27M 42Y 25K 10C 85M0Y 30K 20C 53M0Y 26K0SUPPORTING Use for multi-category charts where high contrast is neededBACKGROUNDBRIGHTPRINT BKGD HIGHLIGHTNUMBER BOXC 7.5M0Y0K5C 22.5M0Y0K 15C 40M 70Y 30K6DARKC0M 68Y 73K0C6M 40Y 100K0C 33M 13Y 95K2C 85M 10Y0K 58C 80M 25Y 50K 50C 38M 30Y 43K 26NEUTRALGRID LINESGREY BOXGREY TEXTBLACK PALETTEC 10M0Y0K 25C 30M0Y0K 50C 20M0Y0K 80C0M0Y0K 25C0M0Y0K 50C0M0Y0K 75C0M0Y0K 100C 15M0Y0K 10
12colourChart paletteWEBMAINECON 8D99BLACKEQUAL LIGHTNESS COLOUR CB7C6CF758D99TEXT3F5661
13chart types1 trace with highlightBar / columnSide-by-side2 traces2 traces with sub-categoriesDefenders of democracySaludDoctors’ consultations per personSelected countries, 200902468Middle itainDenmarkSweden0GDP, % increase on previous yearForecasts made hange in worldwide capital spending*, %2014-17 forecastSeptember123Euro area uth AfricaSource: OECDJune0Low income20Another dotcom boomAutumn fallRespondents saying that honest elections heldregularly with a choice of at least two politicalparties are very important, 2007, %PolandSource: IMFIndiaRussiaSource: Pew Global Attitudes SurveyEthiopia’s GDP, % change on a year earlierThe mighty jungleBritain, annualised rate of returnon investment*, %1412EquitiesRural property108COLOUR ORDER12345All propertyForestry206154102506200406Source: IMF081012-60 -40 -200204060InternetSoftwareTech hardwareIT servicesHealth careTotalLeisureChemicalsOil, gas and fuelsMetals and miningPropertyEnergy equipmentSource: Goldman SachsEgyptAfrican lion1 trace with /- axis*In dollar termsDifferentiate positive/negative values by colouronly where there is ameaningful differencei.e. imports / exportsThe money drainNet private capital inflows/outflows, bn100014 15**Estimate20 years10 years505 yearsSources: MSCI; JP Morgan*To 20140-50-100COLOUROVERIDESWhere categories are chronological,use light-to-dark scaleGrowth in AsiaDon’t fence me inGDP forecasts, % change on a year 608Source: Central Bank of Russia11**To June 30th12Exports58White British4Other White0MixedChina04China, as % of GDPMetropolitan areasOther large citiesInner LondonOuter London98 2000 02China-United States trade in goods2001-116-1501994 96Trader woesBritain, % change in segregation index*2016-20*2If categories form meaningful groups,use colour to reinforce neiSource: OECDUnited States, as % of GDP1995Caribbean*Annual averageSource: Universityof Manchester200005Sources: Census Bureau; IMF* % that needs to move tocreate an even distribution1016**Jan-Nov annualised
14chart typesBar / columnStackedNo one’s a winnerThe Fed says no to nuptialsMobile operators’ US market shareJuly 2011, %0AT&TSprint NextelT-MobileVerizonPodemos69PSOE9030.4Overall Monthly revenue 79.8mOil & gasPP 123All mobilesGlobal internet-advertising spending, bnIslamic State’s finances*, January 2015, m350176 required for majorityOtherGetting sociableLooting the LevantSpanish general election 2015, Seats os 4010.0 31.411.1 16.8ERC 9DiL 8EAJ-PNV 6Others 5Smartphones44.19.630.512.9Paid searchDisplayClassifiedOnline videoFORECAST150Deir al-Zor governorate Monthly revenue 8.7m0246810010Sources: Ministry of the Interior; El País8.050Monthly spending 5.8mSource: comScoreFor stacked bars with few categories or labelling issues, considerremoving tick marks and labelling each segment iaIslamic policeSocial servicesSources: IHS0200810121416 17Source: ZenithOptimedia*EstimatesMore in than outUnited States, merchandise-trade deficit% of GDPChinaRest of world0-1-2COLOUR ORDER12345-36COLOUROVERIDES-4How do you feel about Donald Trump asthe 2016 Republican nominee for president?*Intra-European* migrants living elsewhere2014, % of total by destination alyBritainSource: European Commission-5Trump’s troopsMovers and shakers*Including EFTAYou may need to swap in othercolours for charts with more than4 categoriesUse grey for ‘other’ /‘dont know’ etcEnthusiasticDissatisfiedNot sureSatisfiedUpset0White menno collegeWhite womenno collegeWhite mencollege educatedNon-white mencollege educatedWhite womencollege educatedNon-white menno collegeNon-white womencollege educatedNon-white womenno collegeSources: YouGov;CCES; The Economist% of total voters201220 40 60 80 100222416317647*5,773 registered voters surveyedJune 4th to July 9th 2016If categories form meaningful groups,use colour to reinforce that-6199095200005Sources: US Census Bureau;US Bureau of Economic Analysis1016**January-September
15chart typesLinesSide-by-sidePenumbralTransports of delightWhere Tokyo leadsUS shadow housing inventory*Units, m2.0Period beginningJanuary 1989 ( Japan)Coming down everywhereLondon’s population and journeysTen-year government-bond yields, %Suicides per 100,000 population2001 100January 1999 (US)1.58Bus0200607Source: CoreLogic08091011*Foreclosed and delinquenthomes not yet on the market140Tube40.52510120PopulationCar01132001 03Years since startSource: Thomson es: Transport for London; ONS; The Economist30Russia20JapanSouth KoreaUS100Britain8015196070408010090200013Sources: ONS; EurostatStandard colour order1 line2 lines3 lines4 linesCOLOUR ORDER123456HIGH CONTRASTALTERNATIVESExodusChristians, as % of ESaudiArabia01910702010 25*Available yearsSource: “Ongoing Exodus: Tracking theEmigration of Christians from the MiddleEast” by T. Johnson and G. Zurlo, 2015*Forecast5 lines6 lines
16chart typesLinesStackedForeign hoardsThe big shiftDeveloping-country currency reserves trn6Otherdevelopingcountries42Tax havens’ share of US overseascorporate profits, %NetherlandsBermuda & other 4030China20020020406081010* 11*Source: IMF*Forecast01982909520000510 13Source: “The Hidden Wealth of Nations”,by Gabriel Zucman, University of Chicago Press, 2015COLOUR OVERIDESCOLOUR ORDER12345612345In limboEmerging middle classHouseholds in temporary homesEngland, ’000Private rentalLA/HA*Working population by economic class, emerging and developing countries*, 2011 at PPP†, bn3.0Private leased by LA/HA*HostelBed & breakfastDeveloped middleclass and above over 131008060 5.01 to 13 3.11 to 502002 04Source: DCLG060810121.5Near poor2019982.0Developing middle class40Alternative colour scheme for usewhere categories are chronologicalor where primary colour schemedoesn’t work2.51.0Moderately poor 1.90 to 3.1015*Local authoritiesand housing associations0.5Extremely poorless than 1.9001991Source: ILO952000051015‡ 16‡*Excluding most Western developed countries †Purchasing-power parity ‡Estimate
17chart typesThermometerchartsStandard colour order3 lines2 linesThe horrible scienceUse of specific “adjective” per million wordsin student reviews on RateMyProfessors.com*onetwoCOLOUR ORDER12345100200300400two“Horrible”0The horrible scienceUse of specific “adjective” per million wordsin student reviews on RateMyProfessors.com*onethree1002003004006 linestwothreefour0100“Horrible”The horrible scienceUse of specific “adjective” per million wordsin student reviews on RateMyProfessors.com*one200300400twothreefourfive er istoryCommunicationMathematicsEconomicsComputer istoryCommunicationMathematicsEconomicsComputer istoryCommunicationMathematicsEconomicsComputer istoryCommunicationSource: Ben Schmidt, Northeastern UniversitySource: Ben Schmidt, Northeastern UniversitySource: Ben Schmidt, Northeastern UniversitySource: Ben Schmidt, Northeastern Universitydot terminals6The horrible scienceUse of specific “adjective” per million wordsin student reviews on RateMyProfessors.com*one0“Horrible”4 linesThe horrible scienceUse of specific “adjective” per million wordsin student reviews on 200300MathematicsEconomicsComputer istoryCommunicationSource: Ben Schmidt, Northeastern UniversityUse as alternative whenlines are unclear400300400Ilex will plot up to 6 colours butany more than 4 categories isprobably too many and youshould have a rethink
chart types4 categoriesThe best disinfectantStandard dot4px width50% opacityuse where general trendis more important thanindividual pointhighlight dot4px width100% opacityuse to label outliers /important data points2345House 024EmploymentSources: Freddie Mac;US Bureau of Labour Statistics68trend lines1px strokedashed 3px, 1px20Vitality and the voteUnited States, health metrics against swing to Donald TrumpBy countyChange in Republican marginover Democrats, 2012-16, % giblepopulation20406080100Corruption-perceptions index score, 2014100 least corrupt0Sources: Transparency International;Open Knowledge Foundation-5*At least100,000 populationSame weight/colourfor x and y ticksuse black for zerobaseline only-25-5020WORSE HEALTH304050Index of county health metrics*Sources: Atlas of US Presidential Elections; Census Bureau;IPUMS, University of Minnesota; Institute for Health Metricsand Evaluation; The Economist60BETTER HEALTH70*Weighted index of obesity, diabetes,heavy drinking, physical exercise andlife expectancy, 2010-12Where colour categories become difficult to distinguish,consider highlighting the most significant part of the storyConnected scatter64005Category dot0.3px stroke50% opacity filluse for bubble chartsto differential coloursCOLOUR ORDER1Q1 1990 - Q1 2007Q1 2012 - Q1 2016Open-dataindex score, latest100 most open100Britain Denmark80US60Corruption and open dataUnited States, housing and employmentMetro areas*, average annual change, %MORE REPUBLICANDivergentLESS REPUBLICANScatter plotStandard scatterBubble chartRight nationHealth spending and life expectancy at birthOECD countries2013*2003Life expectancy,years84FranceJapan2013 average 80.578BritainBy county82GermanyChileVitality and the voteUnited States, health metrics against swing to Donald TrumpUnited States76Change in Republican margin overDemocrats, 2012-16, % points50Jefferson, OHMORE REPUBLICANChart elementssub title should summarisechart, save specific unitsfor axis labelsVotingeligiblepopulationKnox, OH25Midwest74Turkey2013average 3,4530Source: OECD07212347056Health expenditures per personat purchasing-power parity, current prices, ’000To avoid obscuring the connecting linesand labels, axis lines can be broken789*Or latestLESS REPUBLICAN18-25-5020WORSE HEALTH304050Index of county health metrics*Sources: Atlas of US Presidential Elections; Census Bureau;IPUMS, University of Minnesota; Institute for Health Metricsand Evaluation; The Economist60BETTER HEALTH70*Weighted index of obesity, diabetes,heavy drinking, physical exercise andlife expectancy, 2010-12On larger / complicated scatters, use explanatorylabels to make the correlation clear
19chart typesTablesChart elementsStandard tableWith colour highlightDivided by a dozenGreatest hitsheadline econ sans cnd medium 7.5/9body econ sans cnd light 7.5/9paragraph space 4ptCompanydetail text 75kAirbnbRents out placesto stay for local hosts0.5px 100k0.3px 50kPolicy choices in our political proximity modelLargest Y Combinator-funded startupsValue* bnDate ofjoining 25.52009DropboxFile-sharing andstorage in the cloud 10.0StripeSoftware for sellingfrom within apps 5.0ZenefitsOnline HR andpayroll services 4.5InstacartGrocery collectionand delivery service 2.02012DockerPlatform to managedistribution of software 1.12010Sources: CB Insights;CrunchBase20102013New stimulus measuresSocialBusiness tax cutsWhich comes closest to your position on abortion?Infrastructure spending, stateand local government aidWould you support/oppose a constitutionalamendment allowing states to ban gay marriage?2007Obama’s jobs bill bn70140Unemployment insurance and training62Should gun-control laws be more or less strictthan they are now?Payroll-tax cutEconomicPaid for byDo you support/oppose raising the federalminimum wage to 15 per hour?Limiting deductions forupper-income earnersWhat should be done to reduce the federalbudget deficit?Treating carried interest as ordinary income18Limiting oil and gas company tax benefits40Do you support/oppose a single-payerhealth-care system?Removing corporate-jet tax breaksTotal447405Total*Should our taxes provide free college tuition?Source: White HouseForeign policy1753467*Figures may not sumdue to roundingDo you think the US government should be doingmore or less in its fight against terrorism?Do you support/oppose sending ground combattroops to fight IS in Iraq and Syria?*Latest funding roundDo you favour/oppose building a wall along theborder between the United States and Mexico?Use 75k textto differentiateexplanatory textWould you say NAFTA has had a positive/negativeeffect on the US economy?Is the government doing enough to combatclimate change?Use alternating row coloursto help with reading3pt internal paddingWhich comes closest to your position on abortion?Table with integrated chartsWhat to expectAsylum processes, selected countries, 2014Accepted Minimum wait before%permitted to workApplications*Country Decisions madeMainly from%Germany 173,070Syria 23Serbia / Kosovo 14Eritrea 842Syria 40Stateless 10Eritrea 877Serbia / Kosovo 51Afghanistan 21Syria 169Eritrea 13Pakistan 11Syria 839Mexico 12China 11El Salvador 830†China 19‡India 13‡Pakistan 10‡19†97,415Sweden75,09040,015Hungary 1,765†Australia 8,96013,198†Sources: UNHCR; government statistics;The EconomistState benefitsper month3 months 374ImmediatelyWithout restrictions 2269 months 86MaximumWorking only in areception centre12 months 217Only jobs where gov’t sees ashortage (medics, engineers)6 monthsNilIn practice, 92% ofapplicants wait longerMost applicants cannotwork as they are in detention 275*From UNHCR 2014 report†From UNHCR Statistical Database ‡2012-13 figuresWhere table data will benefitfrom visualising , use smalllabelled bar charts etc.Use colour highlightwith inverted text topull out key details
20chart typesStandard colour orderPie / doughnut123456COLOUR ORDER123456The scramble in AfricaNaan biggerTata’s workforce in Britain, September 2011’000Jaguar LandRover 19.0Tata Steel19.4OtherOthers0.6Taj (hotels)0.4Tata Chemicals 0.5Source: TataTotal45.4Goods trade with Africa, 2013, bnForeign direct investment in Africa, 2012, bnChina* 156.4Rest of world453.8United States 72.1Rest of world38.1Britain7.5United States3.7France 61.6TataConsultancyServices 4.9TGB (drinks) 0.7Total 1.02trnBrazil25.3Japan 25.3Sources: UNCTAD; IMFIndia 57.0Spain 48.1Italy 40.9Germany 40.4Britain 34.4Total 59.3bnItaly3.6China2.5France2.1India1.8*Including Macau and Hong KongWhere linking lines get too crowded,key the labels with small colour blockNOTE: Use with caution.Should probably be abandonedin favour of stacked barif over 4 categories
21chart stylingDouble-scalecharts3 lines on left-hand axis1 line on each axisOut of steamGolden triangleBritain, railwaysNational rail track’000 kmAXIS 112text5040403030202010100019557080902000Total trilateral trade trn1.25Mexico1.00Canada600.75400.50United States200.250019942000051014Venezuela, % change on a year earlierConsumer prices, 00-2015-8002004 06Sources: Thomson Reuters; IMFSource: Department for Transport081012Sources: IMF; Reuters1416**Preliminary estimateAlways choose the axiscolour order that willvisually associate thelabels best with thecorresponding lineDouble scales can be good at showing correlations and are economical with space.But they can also be confusing/misleading.Here are some things to avoid when considering a double scaleAvoid breaking thescales without goodreasonQuantifying QEAXIS 212806050COLOUR ORDER10070Privatisation begins60Chavismo in actionNAFTA countries’ exportsto each other, % of totalPassenger kilometresbn70Use Econ Sans CndRegular, instead oflight, for colouredy-axis labelsline and columnEuro against thedollar, per What lies beneathTen-year governmentbond yields, 2015Source: Thomson Reuters2002 04060810Avoid mixing disparatemeasures to force visualcorrelationThe Zuma yearsBig oil companies’ enterprisefree cash flow, bn1202Euro area2014If you are plotting aboveand below a zero linemake the zero lines alignOil priceBrent, per barrel1801214Source: BCG16South AfricaRand per , inverted scale6SACCI BusinessConfidence Index,2015 100120911012100159018802008 09 10 11 12 13 14 15 16Sources: Thomson Reuters; SACCIBroken scale distorts datamisaligned baselinesIndex value inverted scaleIf you cannot conform to the above rules try splitting the chart into panels or indexing the variables
22chart stylingBlob headsBubbleNumber blockWhere bubbles are large enoughfit numbers insideTo avoid awkward alignment, ifmost numbers won’t fit, put themoutside bubble and align text rightThe Big Mac indexJanuary 2016January 20176.4Norway5.8Sweden5.3Brazil5.1United States†5.1Euro area‡4.1Britain3.8Japan3.3Fillc22.5 k15100% multiply-10 -50510 15 bnDomesticForeignOctober 44NamibiaSouth apan62Spain18United India**2.5Source: GBTAMexico2.3Russia2.2BRVM*Source: World Federationof Exchanges2.3Market cap, bn11.6*West Africanregional exchange*At market exchange rates( Jan 11th 2017) †Average of four cities‡Weighted average of member countries§Average of five cities **Maharaja MacArrow placementEcon Sans Cnd reg 7.5/9.5ptBox: c22.5 k15 100% multiply2 line% change on a year earlierTurkeyText blocks1 lineCan be usedwith column orthermometer charts20 40SwitzerlandSources:McDonald’s;The EconomistA secondary datavariable added asarea-sized bubblesor number boxesNumber of companieslisted on stock exchangesBusiness travel spending, 2014Big Mac price*, -80 -60 -40 -20 0Starting smallUp in the airLocal currency under (-) / over ( ) valuationagainst the dollar, %If number range or positive / negativevalues rule out bubbles, revert toequal-sized number blocksECB announces QEECB announcesQE beginningECB announces QE12pt height / 6pt horizontal padding23pt height / 6pt horizontal paddingnumbersEcon Sans Cnd reg 7pt6.4Horizontally or vertically centredECB announces QEECB announces QEMinimum 6pt in from box edgeif necessary
23chart stylingWhere colour is being usedto categorise data, use greyfor timeline labelsTimelinesNon-data timelinesThe PhilippinesSelected eventsFerdinandMarcoselected1965Marcos oustedBenigno Aquino Jr.assassinated onreturn from US exile75New constitution“PeoplePower”revolutionMarcos imposesmartial law7080Duterte firstelected mayorof Davao85Marcos90CorazonAquinoCoup attemptsPRESIDENTSData timeline95RamosWife of Benigno JrRe-electedAsianfinancialcrisisstartsJoseph Estrada resignsduring impeachmentproceedingsCorazon AquinodiesEstradaMs Arroyoconvicted ofarrestedcorruption20000510US/EU oil sanctionsOil production, m bpd64Iranian revolution.Shah overthrownIran signsNon-proliferationTreatyIran/Iraq warObama offers to “extend a hand” to IranSon of Corazon& Benigno JrUSS Vincennes shootsdown Iranian civil airliner0Duterte President Elect1965707580859095200For timelines tied to adataset, break the y-axislines to avoid chart areabecoming too crowdedIS takesMosul 100USinvadesIraq02000051015Supreme leadersRuhollah Khomeini Ali KhameneiReza Shah PahlaviUse thin alternating-colour bars to mark out timeperiods. Key repeated events, like coup attempts,to avoid duplicating text labels300US invades Afghanistan1516BenignoAquino IIIGDP, bn2005 pricesIran branded partof “axis of evil”2Estrada GloriaMacapagalArroyoSource: The EconomistMore than an oil giantIran* † KhameneiSources: World Bank;Thomson ni*Banisadr †Ali RajaiI wanna be adoredPresidential electionParliamentary electionApproval rating of Vladimir Putin and the Russian government, % polledPutin is:PMCausation of a caliphateCivilian death toll, ‘000:IraqAmerican-led invasion of Iraq.Saddam Hussein toppled.Assad accused of helpingforeign fighters enter IraqEgypt bombs IS affiliate in LibyaSyriaZarqawi killed inAmerican bombingHaider al-Abadi replaces Maliki. American-led coalitionstarts bombing IS in Iraq, and later in Syria“Great recession”Financi
FREE EXCHANGE 245pts 1 COLUMN 245pts 2 COLUMN 332pts / 595px 160pts / 290px 332pts / 595px 2 1/2 COLUMN 3 COLUMN 504pts print width (pts) web equivalent (px) . Sources: International Olympic Committee; Sports Reference; The Economist *Unified team of ex-Soviet republics Number of “meda