Transcription
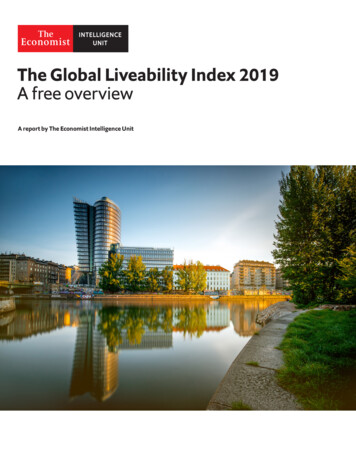
The Global Liveability Index 2018A free overviewA report by The Economist Intelligence Unit
The world leader in global business intelligenceThe Economist Intelligence Unit (The EIU) is the research and analysis division of The Economist Group, the sister companyto The Economist newspaper. Created in 1946, we have over 70 years’ experience in helping businesses, financial firms andgovernments to understand how the world is changing and how that creates opportunities to be seized and risks to be managed.Given that many of the issues facing the world have an international (if not global) dimension, The EIU is ideally positioned to becommentator, interpreter and forecaster on the phenomenon of globalisation as it gathers pace and impact.EIU subscription servicesThe world’s leading organisations rely on our subscription services for data, analysis and forecasts to keep them informed aboutwhat is happening around the world. We specialise in: C ountry Analysis: Access to regular, detailed country-specific economic and political forecasts, as well as assessments ofthe business and regulatory environments in different markets. R isk Analysis: Our risk services identify actual and potential threats around the world and help our clients understand theimplications for their organisations. I ndustry Analysis: Five year forecasts, analysis of key themes and news analysis for six key industries in 60 majoreconomies. These forecasts are based on the latest data and in-depth analysis of industry trends.EIU ConsultingEIU Consulting is a bespoke service designed to provide solutions specific to our customers’ needs. We specialise in these keysectors: EIU Consumer: We help consumer-facing companies to enter new markets as well as deliver greater success in currentmarkets. We work globally, supporting senior management with strategic initiatives, M&A due diligence, demand forecastingand other issues of fundamental importance to their corporations. Find out more at eiu.com/consumer H ealthcare: Together with our two specialised consultancies, Bazian and Clearstate, The EIU helps healthcare organisationsbuild and maintain successful and sustainable businesses across the healthcare ecosystem. Find out more at: eiu.com/healthcare P ublic Policy: Trusted by the sector’s most influential stakeholders, our global public policy practice provides evidencebased research for policy-makers and stakeholders seeking clear and measurable outcomes. Find out more at: eiu.com/publicpolicyThe Economist Corporate NetworkThe Economist Corporate Network (ECN) is The Economist Group’s advisory service for organisational leaders seeking to betterunderstand the economic and business environments of global markets. Delivering independent, thought-provoking content,ECN provides clients with the knowledge, insight, and interaction that support better-informed strategies and decisions.The Network is part of The Economist Intelligence Unit and is led by experts with in-depth understanding of the geographies andmarkets they oversee. The Network’s membership-based operations cover Asia-Pacific, the Middle East, and Africa. Through adistinctive blend of interactive conferences, specially designed events, C-suite discussions, member briefings, and high-calibreresearch, The Economist Corporate Network delivers a range of macro (global, regional, national, and territorial) as well asindustry-focused analysis on prevailing conditions and forecast trends.
THE GLOBAL LIVEABILITY INDEX 2018A FREE OVERVIEWContents1The findings of the latest liveability survey 2After years of destabilisation, a return to relative global stability 2Civil war and terrorism in the worst performing cities have been globally destabilising 5The top and bottom ten cities 5About The Economist Intelligence Unit’s liveability survey 7How the rating works 7The suggested liveability scale 7How the rating is calculated 7 The Economist Intelligence Unit Limited 2018
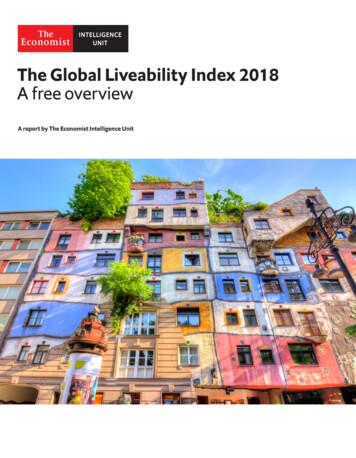
THE GLOBAL LIVEABILITY INDEX 2018A FREE OVERVIEWThe findings of the latest liveability surveyAfter years of destabilisation, a return to relative globalstabilityFor the first time in this survey’s history, Austria’s capital, Vienna, ranks as the most liveable of the 140cities surveyed by The Economist Intelligence Unit. A long-running contender to the title, Vienna hassucceeded in displacing Melbourne from the top spot, ending a record seven consecutive years atthe head of the survey for the Australian city. Although both Melbourne and Vienna have registeredimprovements in liveability over the last six months, increases in Vienna’s ratings, particularly inthe stability category, have been enough for the city to overtake Melbourne. The two cities are nowseparated by 0.7 of a percentage point, with Vienna scoring a near-ideal 99.1 out of 100 and Melbournescoring 98.4.Two other Australian cities feature in the top-ranked places: Sydney (5th) and Adelaide (10th), whileonly one other European city made the top ten. This is Copenhagen in Denmark, in 9th place, after itsscore increased by 3.3 percentage points since the last survey cycle. The rest of the top-ranked cities aresplit between Japan (Osaka in 3rd place and Tokyo in joint 7th, alongside Toronto) and Canada (Calgaryin 4th, and Vancouver and Toronto in 6th and 7th respectively). Osaka stands out especially, havingclimbed six positions, to third place, over the past six months, closing the gap with Melbourne. It is nowseparated from the former top-ranked city by a mere 0.7 of a percentage point. Osaka’s improvements inscores for quality and availability of public transportation, as well as a consistent decline in crime rates,have contributed to higher ratings in the infrastructure and stability categories respectively.Upwards movement in the top ranked cities is a reflection of improvements seen in stability andsafety across most regions in the past year. Whereas in the past, cities in Europe have been affected bythe spreading perceived threat of terrorism in the region, which caused heightened security measures,the past six months have seen a return to normalcy. Yet, during this period, 116 cities of the 140 surveyedhave experienced changes in their ranking position. This rises to 128 cities when looking at changes overthe past year.It must be noted that ranking movements do not necessarily arise from a change in liveability in thecities themselves, but reflect how cities compare with one another. Although four cities have fallen fromthe top ten over the past year—Auckland (from 8th to 12th), Perth (from 7th to 14th), Helsinki (from 9thto 16th) and Hamburg (from 10th to 18th)—none of these have seen a fall in their overall scores duringthis period. New Zealand’s Auckland has in fact registered a minor improvement. Changes in liveabilityelsewhere can therefore have a significant impact on the rankings of individual cities.Of the 140 surveyed cities, 49% registered negative changes in their overall liveability rank in the pastsix months and 34% experienced positive movements (the rest did not record any change). Yet, despitethe total number of negative movements outweighing the positive ones, the rankings show that overallliveability across all cities surveyed increased by 0.7% in the past six months and 0.9% in the past year.Improvements were recorded across all five categories measured—infrastructure, stability, education,healthcare, and culture and environment—but especially in stability, which increased by 2.5% overall.2 The Economist Intelligence Unit Limited 2018
THE GLOBAL LIVEABILITY INDEX 2018A FREE OVERVIEWThis trend reflects positive developments in this category, despite threats of terrorism and unrestthat cities around the world continue to grapple with. Only ten cities have registered a decline in theirliveability ratings over the past six months, largely reflecting an impact on cultural and environmentalindicators.The prolonged period of relative stability has resulted in the stabilisation of terrorism threat scoresin several cities, especially in Western Europe. The only cities that have seen a fall in their stabilityindicators over the past six months are Abu Dhabi (71st) and Dubai (69th) in the United Arab Emirates(UAE), Colombo (130th) in Sri Lanka and Warsaw (65th) in Poland. In Abu Dhabi and Dubai, the threatof military conflict has increased owing to the UAE’s recent interventions extending its military reachin Yemen and Somalia. The UAE’s deployment of armed forces in Yemen, as well as political hostilitywith Iran, continue to pose a threat in the country and the region. Sri Lanka’s declaration of a temporarynationwide state of emergency in March, following clashes between Sinhalese Buddhist and TamilMuslim communities, impacted Colombo’s civil unrest score. The threat of civil unrest also increasedin Warsaw as an estimated 60,000 people joined a nationalist march on the occasion of Poland’sIndependence Day in November 2017. Nevertheless, these changes have caused a decline in the overallstability rating only in Colombo’s case. Warsaw, for instance, has experienced a decline in the threat ofterrorism to counteract the fall in the civil unrest score, while Abu Dhabi and Dubai saw improvementsin their crime and civil unrest ratings.The impact of improving stability is most apparent when a five-year view of the global averagescores is taken. Overall, the global average liveability score has increased by 0.15%, to 75.7%, over thepast five years, while the average stability rating has increased by 1.3%. Although the threat of terrorismhas indeed caused a decline in liveability over a longer period—the global average liveability score hasdecreased by 0.4% in the past decade—an improvement in scores over the past five years suggests agradual return to relative stability.During this period, 103 of the 140 cities surveyed have seen some change in overall liveability scores.Of these, 60 have seen improvements in liveability. Four cities in particular—Abidjan in Côte d’Ivoire,Hanoi in Vietnam, Belgrade in Serbia and Tehran in Iran—have seen increases of 5 percentage points ormore. Over the past twelve months Kiev has also seen a significant improvement in liveability, reflectinga pick-up in economic growth and relative political stability despite the Donbas conflict.Although the cities ranked among the most liveable in the world remain largely unchanged, there hasbeen pronounced movement within the top tier of liveability. Of the 66 cities with scores of 80 or more,which are considered as the top tier, 40 have seen a change in score in the past twelve months. Changesin overall scores have been positive for all cities except Houston, which saw a decline in its infrastructurerating. An improvement in stability has been the underlying factor affecting movements in the mostliveable cities, with the top tier registering an overall increase of 3.4% in its average stability score. Ofthe top-ranked cities, Paris in France and Manchester in the UK recorded the biggest improvementsover the past 12 months, both in overall scores and stability ratings. Although they have been subject tohigh-profile terrorist attacks in recent years, which have shaken stability and led to cumbersome securitymeasures, both cities have shown resilience in the face of adversity. Nevertheless, with such high scoresalready in place, the impact of these improvements has not been enough to significantly affect liveabilityin any of the top-tier cities. In fact although, 19 percentage points separate Vienna in first place fromNouméa in New Caledonia in 66th place, all cities in this tier can lay claim to being on an equal footing interms of presenting few, if any, challenges to residents’ lifestyles.3 The Economist Intelligence Unit Limited 2018
THE GLOBAL LIVEABILITY INDEX 2018A FREE OVERVIEWNonetheless, there does appear to be a correlation between the types of cities that sit at the verytop of the ranking. Those that score best tend to be mid-sized cities in wealthier countries. Severalcities in the top ten also have relatively low population density. These can foster a range of recreationalactivities without leading to high crime levels or overburdened infrastructure. Six of the top ten scoringcities are in Australia and Canada, which have, respectively, population densities of 3.2 and 4 peopleper square kilometre. These densities compare with a global (land) average of 58 and a US average of35.6, according to the latest World Bank statistics, from 2017. Austria and Japan buck this trend, withrespective densities of 106.7 and 347.8 people per square kilometre. However, Vienna’s city-properpopulation of 1.9m and Osaka’s population of 2.7m are relatively small compared with metropolises suchas New York, London and Paris.It may be argued that violent crime is on an upward trend in the top tier of cities, but theseobservations are not always correct. Although crime rates are perceived as rising in Australia andEurope, cities in these regions continue to boast lower violent and petty crime rates than the rest of theworld. Some of the lowest murder rates in the world were recorded in Austria and Japan. The murderrate in Austria was just 0.61 per 100,000 people in 2017, and in Japan it was 0.72 per 100,000 people. Thiscompares with a murder rate of 3 per 100,000 people in New Delhi in 2016 and an estimated homiciderate of 104 per 100,000 people in Caracas—according to the Venezuelan Observatory of Violence—in2017.Global business centres tend to be victims of their own success. The “big city buzz” that they enjoycan overstretch infrastructure and cause higher crime rates. New York (57th), London (48th) and Paris(19th) are all prestigious hubs with a wealth of recreational activities, but all suffer from higher levels ofcrime, congestion and public transport problems than are deemed comfortable. The question is howmuch wages, the cost of living and personal taste for a location can offset liveability factors. Althoughmany global centres fare less well in the ranking than mid-sized cities, for example, they still sit withinthe highest tier of liveability and should therefore be considered broadly comparable, especially whencontrasted with the worst-scoring locations.Five biggest improvers (last five years)CityCountryRank (out of 140)Overall Rating(100 ideal)five year movement %AbidjanCote Serbia8272.25TehranIran12850.85Ho Chi Minh CityVietnam11657.14.4Five biggest decliners (last five years)4CityCountryRank (out of 140)Overall Rating(100 ideal)five year movement %KievUkraine11856.6-12.6San JuanPuerto uela12651.3-5.1AsuncionParaguay10264.3-4.5 The Economist Intelligence Unit Limited 2018
THE GLOBAL LIVEABILITY INDEX 2018A FREE OVERVIEWCivil war and terrorism in the worst performing cities havebeen globally destabilisingOf the poorer-scoring cities, eleven occupy the very bottom tier of liveability, where ratings fall below50% and most aspects of living are severely restricted. Damascus has seen a stabilisation in its dramaticdecline in liveability but remains ranked at the bottom of the 140 cities surveyed, with a liveability scorethat is 7.3% lower than the second lowest ranking city in the survey, Dhaka in Bangladesh.The relatively small number of cities in the bottom tier of liveability partly reflects the intendedscope of the ranking—the survey is designed to address a range of cities or business centres thatpeople might want to live in or visit. For example, the survey does not include locations such as Kabulin Afghanistan or Baghdad in Iraq. Although few would argue that Damascus in Syria and Tripoli inLibya are likely to attract visitors at present, despite them registering recent improvements, theirinclusion in the survey reflects cities that were deemed relatively stable before the 2011 Arab Spring.With the exception of crisis-hit cities, the low number of cities in the bottom tier also reflects a degreeof convergence, where levels of liveability are generally expected to improve in developing economiesover time. This long-term trend has been upset by the heightened, widespread reach of terrorism overthe past five years.The rankings of cities like Damascus, Karachi and Tripoli suggest that conflict is responsible formany of the lowest scores. This is not only because stability indicators have the highest single scoresbut also because factors defining stability can spread to have an adverse effect on other categories.For example, conflict will not just cause disruption in its own right, it will also damage infrastructure,overburden hospitals and undermine the availability of goods, services and recreational activities.Unavailability of adequate infrastructure is also responsible for many of the lowest scores. This isparticularly visible in the ranks of cities like Dhaka (Bangladesh, 139th), Harare (Zimbabwe, 135th),Douala (Cameroon, 133rd) and Dakar (Senegal, 131st). Nevertheless, the impact of stability indicators,especially those related to crime, cannot be understated for some of these cities. The Middle East,Africa and Asia account for the ten lowest-scoring cities in the survey where violence, whether throughcrime, civil insurgency, terrorism or war, has played a strong role.The top and bottom ten citiesBelow is a ranking of the top and bottom cities surveyed, accompanied by the liveability rating forevery city. The liveability score is the combination of all the factors surveyed across the five maincategories. Scores are also given for each category. The full ranking report can be purchased 5 The Economist Intelligence Unit Limited 2018
THE GLOBAL LIVEABILITY INDEX 2018A FREE OVERVIEWThe ten most liveable citiesCountryCityRankOverall Rating(100 ideal)StabilityHealthcareCulture 0.096.4The ten least liveable citiesCountryCityRankOverall Rating(100 ideal)StabilityHealthcareCulture bweHarare13542.640.020.858.666.735.7PNGPort 1.726.8SyriaDamascus14030.720.029.240.533.332.16 The Economist Intelligence Unit Limited 2018
THE GLOBAL LIVEABILITY INDEX 2018A FREE OVERVIEWAbout The Economist Intelligence Unit’sliveability surveyHow the rating worksThe concept of liveability is simple: it assesses which locations around the world provide the best or theworst living conditions. Assessing liveability has a broad range of uses, from benchmarking perceptionsof development levels to assigning a hardship allowance as part of expatriate relocation packages.The Economist Intelligence Unit’s liveability rating quantifies the challenges that might be presented toan individual’s lifestyle in any given location, and allows for direct comparison between locations.Every city is assigned a rating of relative comfort for over 30 qualitative and quantitative factorsacross five broad categories: stability, healthcare, culture and environment, education, andinfrastructure. Each factor in a city is rated as acceptable, tolerable, uncomfortable, undesirable orintolerable. For quali tative indicators, a rating is awarded based on the judgment of in-house analystsand in-city contributors. For quantitative indicators, a rating is calcul ated based on the relativeperformance of a number of external data points.The scores are then compiled and weighted to provide a score of 1–100, where 1 is consideredintolerable and 100 is considered ideal. The liveability rating is provided both as an overall score and as ascore for each category. To provide points of reference, the score is also given for each category relativeto New York and an overall position in the ranking of 140 cities is provided.The suggested liveability scaleCompanies pay a premium (usually a percentage of a salary) to employees who move to cities whereliving conditions are particularly difficult and there is excessive physical hardship or a notably unhealthyenvironment.We have given a suggested allowance to correspond with the rating. However, the actual level of theallowance is often a matter of company policy. It is not uncommon, for example, for companies to payhigher allowances—perhaps up to double our suggested level.Rating DescriptionSuggested allowance (%)80-100There are few, if any, challenges to living standards070-80Day–to–day living is fine, in general, but some aspects of life may entail problems 560-70Negative factors have an impact on day-to-day living1050-60Liveability is substantially constrained1550 or less Most aspects of living are severely restricted20How the rating is calculatedThe liveability score is reached through category weights, which are equally divided into relevantsubcategories to ensure that the score covers as many indicators as possible. Indicators are scored asacceptable, tolerable, uncomfortable, undesirable or intolerable. These are then weighted to produce arating, where 100 means that liveability in a city is ideal and 1 means that it is intolerable.7 The Economist Intelligence Unit Limited 2018
THE GLOBAL LIVEABILITY INDEX 2018A FREE OVERVIEWFor qualitative variables, an “EIU rating” is awarded based on the judgment of in‑house expertcountry analysts and a field correspondent based in each city. For quantitative variables, a rating iscalculated based on the relative performance of a location using external data sources.Category 1: Stability (weight: 25% of total)IndicatorSourcePrevalence of petty crimeEIU ratingPrevalence of violent crimeEIU ratingThreat of terrorEIU ratingThreat of military conflictEIU ratingThreat of civil unrest/conflictEIU ratingCategory 2: Healthcare (weight: 20% of total)IndicatorSourceAvailability of private healthcareEIU ratingQuality of private healthcareEIU ratingAvailability of public healthcareEIU ratingQuality of public healthcareEIU ratingAvailability of over-the-counter drugsEIU ratingGeneral healthcare indicatorsAdapted from World BankCategory 3: Culture & Environment (weight: 25% of total)IndicatorSourceHumidity/temperature ratingAdapted from average weather conditionsDiscomfort of climate to travellersEIU ratingLevel of corruptionAdapted from Transparency InternationalSocial or religious restrictionsEIU ratingLevel of censorshipEIU ratingSporting availabilityEIU field rating of 3 sport indicatorsCultural availabilityEIU field rating of 4 cultural indicatorsFood & drinkEIU field rating of 4 cultural indicatorsConsumer goods & servicesEIU rating of product availabilityCategory 4: Education (weight: 10% of total)8IndicatorSourceAvailability of private educationEIU ratingQuality of private educationEIU ratingPublic education indicatorsAdapted from World Bank The Economist Intelligence Unit Limited 2018
THE GLOBAL LIVEABILITY INDEX 2018A FREE OVERVIEWCategory 5: Infrastructure (weight: 20% of total)9IndicatorSourceQuality of road networkEIU ratingQuality of public transportEIU ratingQuality of international linksEIU ratingAvailability of good quality housingEIU ratingQuality of energy provisionEIU ratingQuality of water provisionEIU ratingQuality of telecommunicationsEIU rating The Economist Intelligence Unit Limited 2018
Liveability products available to purchase from The EIUThe Liveability SurveyLiveability Survey provides a full report of The EIU’s liveability ratings for 140 cities around the world. Thisincludes a one-page overview for each of the 140 cities covered as well as The EIU’s ratings for each city onthe full set of over 30 qualitative and quantitative factors. In this ranking: Each of the 30 factors in each city is rated as acceptable, tolerable, uncomfortable, undesirable orintolerable. The categories are compiled and weighted to provide an overall rating of 1–100, where 1 is consideredintolerable and 100 is considered ideal. The liveability ranking considers that any city with a rating of 80 or more will have few, if any,challenges to living standards. Any city with a score of less than 50 will see most aspects of livingseverely restricted.Purchase the Liveability Survey.Liveability Ranking and OverviewThis report provides a complete overview of The EIU’s liveability ratings for 140 cities around the world.This includes: A summary of findings and a description of the methodology used. Tables listing the ranking position, overall liveability score and average scores for all cities across eachof the five categories: stability, healthcare, culture and environment, education and infrastructure.Purchase the Liveability Ranking and Overview.Liveability MatrixThe Liveability Matrix is an interactive Excel workbook that ranks all 140 cities on over 30 qualitative andquantitative factors across the five categories.Purchase the Liveability Matrix.Related ReportsWorldwide Cost of LivingThe Worldwide Cost of Living Survey contains a ranking of 133 cities on their relative expensiveness, basedon a survey which compares more than 400 individual prices across 160 products and services. In additionto the ranking table, the report looks at the key trends affecting the cost of living in different cities acrossthe world.Find out more at: eiu.com/wcol10 The Economist Intelligence Unit Limited 2018
Copyright 2018 The Economist Intelligence Unit Limited. Allrights reserved. Neither this publication nor any partof it may be reproduced, stored in a retrieval system, ortransmitted in any form or by any means, electronic,mechanical, photocopying, recording or otherwise,without the prior permission of The EconomistIntelligence Unit Limited.While every effort has been taken to verify theaccuracy of this information, The EconomistIntelligence Unit Ltd. cannot accept anyresponsibility or liability for reliance by any personon this report or any of the information, opinionsor conclusions set out in this report.Cover image - Mistervlad/Shutterstock
LONDON20 Cabot SquareLondonE14 4QWUnited KingdomTel: 44 (0) 20 7576 8181Email: london@eiu.comNEW YORK750 Third Avenue5th FloorNew York, NY 10017United StatesTel: 1 212 698 9717Email: americas@eiu.comHONG KONG1301 Cityplaza Four12 Taikoo Wan RoadTaikoo ShingHong KongTel: 852 2802 7288Email: asia@eiu.com
The Economist Intelligence Unit (The EIU) is the research and analysis division of The Economist Group, the sister company to The Economist newspaper. Created in 1946, we h ave over 70 year