Transcription
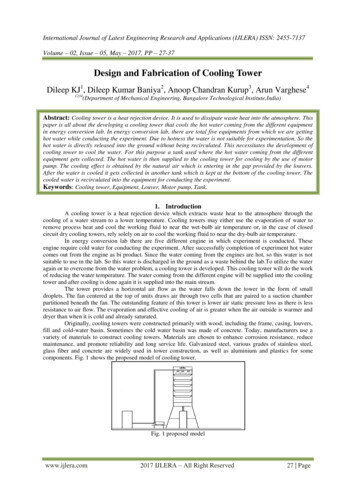
Effective Thermal Design Of Cooling TowersA step-by-step approach to cooling-tower design, with an example calculation to make itclearJonny Goyal Air Liquide Engineering and Construction, Lurgi IndiaVarious misconceptions arise when it comes to the thermal design of cooling towers. Sometimes relatedparameters, such as range, approach, effectiveness, liquid-to-gas ratio ( L/G), wet-bulb temperature,cooling water temperature, relative humidity, number of transfer units (NTU) and other terms create aconfusion for the designer in effectively sizing, selecting and evaluating a particular cooling tower. Thisleads to inadequate design.The objective of this article is to present a stepwise understanding of how to calculate the NTU for acooling tower, and thus to understand the basis of thermal design of counter-flow cooling towers foroptimizing cost and performance.DefinitionsFirst, let’s look at some of the basic terms and briefly describe their significance and role in cooling towerdesign and performance.Dry-bulb temperature. Dry-bulb temperature (tdb) — usually referred to as the air temperature — is theproperty of air that is most commonly used. When people refer to the temperature of the air, they arenormally referring to its dry-bulb temperature. The dry-bulb temperature is an indicator of heat contentand is shown along the bottom axis of a psychometric chart. The vertical lines extending upward from thisaxis are constant-temperature lines.Wet-bulb temperature. Wet-bulb temperature (twb) is the reading when the bulb of a thermometer iscovered with a wet cloth, and the instrument is whirled around in a sling. The wet-bulb temperature is thelowest temperature that can be reached by evaporation of water only.Relative humidity (RH). RH is the ratio of the partial pressure of water vapor in air over the saturationvapor pressure at a given temperature. When the relative humidity is 100%, the air is saturated andtherefore, water will not evaporate further. Therefore, when the RH is 100% the wet-bulb temperature isthe same as the dry-bulb temperature, because the water cannot evaporate any more.Range. The range is the difference in temperature of inlet hot water (t2) and outlet cold water (t1), t2 – t1. Ahigh cooling-tower range means that the cooling tower has been able to reduce the water temperatureeffectively.Approach. The approach is the difference in temperature of outlet cold water and ambient wet-bulbtemperature, t1 – tw. The lower the approach, the better the cooling tower performance. Although bothrange and approach should be monitored, the approach is a better indicator of cooling towerperformance.Cooling tower capability. The capability of the cooling tower is a measure of how close the tower canbring the hot water temperature to the wet-bulb temperature of the entering air. A larger cooling tower(that is, more air or more fill) will produce a closer approach (colder outlet water) for a given heat load,flowrate and entering air condition. The lower the wet-bulb temperature, which indicates either cool air,
low humidity or a combination of the two, the lower the cooling tower can cool the water. Capability testsare conducted per the ATC-105 Code of the Cooling Tower Institute (CTI; Houston; www.cti.org).The thermal performance of the cooling tower is thus affected by the entering wet-bulb temperature. Theentering air dry-bulb temperature has an insignificant effect on thermal performance.Effectiveness. A cooling towers effectiveness is quantified by the ratio of the actual range to the idealrange, that is, the difference between cooling water inlet temperature and ambient wet-bulb temperature.It is defined in terms of percentage.Nomenclaturet2 Hot water temperature, Ct1 Cold water temperature, Ctwb Wet-bulb temperature, Ctdb Dry-bulb temperature, Ctd Dew point temperature, Cha Enthalpy of moist air, kJ/kgh1 Enthalpy of inlet air, kJ/kgh2 Enthalpy of exit air, kJ/kgh’ Enthalpy of fin, kJ/kgF Flowrate, m3/hL Mass flowrate of liquid, lb/hG Mass flowrate of gas, lb/hQ Heat load, kcal/hZ Altitude above sea level, mp Barometric pressure, kPapws Saturation pressure of water vapor, kPapw Partial pressure of water vapor, kPav Specific volume, m3/kg
W Humidity ratio, kg water/kg airWs Humidity ratio at saturation air, kg water/kg moist air Relative humidity (RH), %C Constant related to cooling tower designm Slope of tower characteristic curve(1)Liquid-to-gas ratio (L/G). The L/G ratio of a cooling tower is the ratio of the liquid (water) mass flowrate(L) to gas (air) mass flowrate (G). Cooling towers have certain design values, but seasonal variationsrequire adjustment and tuning of water and air flowrates to get the best cooling tower effectiveness.Number of transfer units (NTU). Also called the tower coefficient, the NTU is a numerical value thatresults from theoretical calculations based on a set of performance characteristics. The value of NTU isalso representative of the degree of difficulty for the cooling process. The NTU corresponding to a set ofhypothetical conditions is called the required coefficient and is an evaluation of the problem. The samecalculations applied to a set of test conditions is called the available coefficient of the tower involved. Theavailable coefficient is not a constant but varies with operating conditions. The operating characteristic ofa cooling tower is developed from an empirical correlation that shows how the available coefficient varieswith operating conditions.Cooling capacity. The cooling capacity of a tower is the heat rejected [kcal/h or TR (refrigeration tons; 1TR 12,000 Btu/h 3,025.9 kcal/h)], and is determined by the product of mass flowrate of water, timesthe specific heat times the temperature difference.Theory — the Merkel equationIn a cooling tower operating in counter current flow, there are two basic principles involved for removingheat by the cooling water:1.sensible heat transfer due to a difference in temperature levels2. latent heat equivalent of the mass transfer resulting from the evaporation of a portion of the circulatingwater
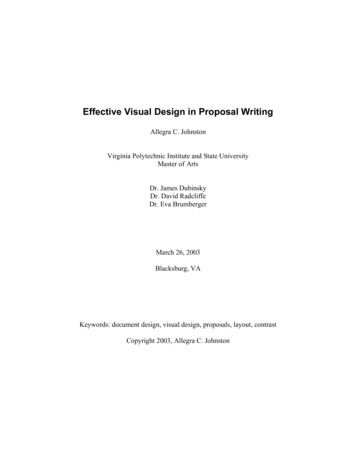
Figure 1. The Merkel equation is derived by consideringa falling water droplet surrounded by saturated airMerkel developed the basic equation based on the above principles. The Merkel model is universallyaccepted for designing and rating of counter-flow cooling towers. The model is based on a drop of waterfalling through an upstream flow of unsaturated air at a wet-bulb temperature of twb withenthalpy hA (Figure 1), in a counter-flow cooling tower. The drop of water is assumed to be surrounded bya film of saturated air at the water temperature WTwith saturation enthalpy hW. As the drop travelsdownward, heat and mass transfer takes place from the interface air film to the upstream air, therebycooling the water from hot temperature to a cold temperature.The main assumptions of Merkel theory are the following:1. The saturated air film is at the temperature of the bulk water.2. The saturated air film offers no resistance to heat transfer.3. The vapor content of the air is proportional to the partial pressure of the water vapor.4. The heat transferred from the air to the film by convection is proportional to the heat transferred fromthe film to the ambient air by evaporation.5. The specific heat of the air-water vapor mixture and the heat of vaporization are constant.6. The loss of water by evaporation is neglected.7. The force driving heat transfer is the differential enthalpy between the saturated and bulk air.
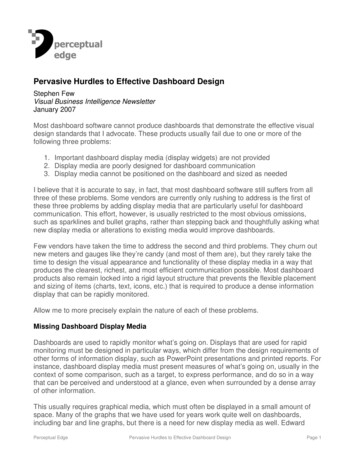
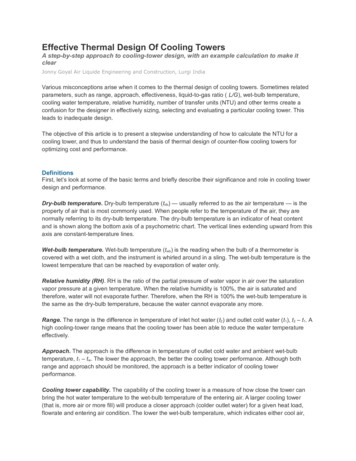
Figure 2. This plot, known as the driving force diagram, shows the enthalpy versustemperature for water and airFigure 3. Solving the Merkel equation (Equation 2), is usually done graphically,where the integral is equal to the area under the curveThis cooling process can best be explained on a psychometric chart, which plots enthalpy versustemperature. The process is illustrated in the so-called driving-force diagram shown in Figure 2. The airfilm is represented by the water operating line on the saturation curve. The main air is represented by theair operating line, the slope of which is the ratio of liquid (water) to air (L/G). The cooling characteristic, adegree of difficulty to cooling is represented by the Merkel equation:(2)Where:
K overall enthalpy transfer coefficient, lb/h-ft2a Surface area per unit tower volume, ft2/ft3V Effective tower volume, ft3L Water mass flowrate, lb/hEquation 2 basically says that at any point in the tower, heat and water vapor are transferred into the airdue (approximately) to the difference in the enthalpy of the air at the surface of the water and the mainstream of the air. Thus, the driving force at any point is the vertical distance between the two operatinglines. And therefore, the performance demanded from the cooling tower is the inverse of this difference.The solution of the Merkel equation can be represented by the performance demand diagram shownin Figure 3. The KaV/L value is equal to the area under the curve, and represents the sum of NTUsdefined for a cooling tower range.An increase in the entering twb moves the air operating line towards the right and upward to establishequilibrium. Both the cold water temperature (CWT) and hot water temperature (HWT) increases, whilethe approach decreases. The curvature of the saturation line is such that the approach decreases at aprogressively slower rate as the twb increases. An increase in the heat load increases the cooling rangesand increases the length of the air operating line. To maintain equilibrium, the line shifts to the rightincreasing theHWT, CWT, and approach. The increase causes the hot water temperature to increaseconsiderably faster than does the cold water temperature. In both these cases, the KaV/L should remainconstant. However, a change in L/G will change the KaV/L value.Cooling tower designOn the basis of the above discussion, it is clear that there are five parameters that, in combination, dictateand define the performance of a cooling tower, namely:1. Hot water temperature, HWT2. Cold water temperature, CWT3. Wet bulb temperature, t wb4. Water mass flowrate, L5. Air mass flowrate, GThe first four parameters are determined by the user of the cooling tower. It is the fifth quantity, G, that isselected by the designer of the cooling tower. Once these five quantities are available, the towercharacteristic ( KaV/L), can be calculated through the Merkel equation.The first step in designing a cooling tower is the generation of a demand curve. In this curve,the KaV/Lvalues are plotted against varying L/G ratios. The next step is to superimpose fill-characteristic
curves and demand curves. The Cooling Technology Institute has tested a variety of fill configurations andgenerated fill characteristic curves for each type; CTI’s Technical Paper TP88 05 can be referred to in thisregard.Cooling tower design is basically an iterative process. The factors that effect the selection ofdesign L/G and consequently the fill height are: cell dimensions, water loading, air velocities acrossvarious cooling tower sections and pressure drops, and fan selection.The classical method of thermal rating of cooling towers is to estimate the ratio of liquid to gas first andthen find the proper tower volume by the means of trial and error using the tower performance curve.The L/G is the most important factor in designing the cooling tower and related to the construction andoperating cost of cooling tower.Finally we can summarize the importance of the L/G ratio with the following points.A high L/G ratio means: More water to less air Air is more saturated — driving force is reduced More residence time of water needed Less cooling in given time Increase in required fan power Decrease in height of tower Low evaporation loss (under same water flowrate)An example makes it clearAs an example, let us design a cooling tower with the following data:Capacity ( F): 3,000 m3/hWet bulb temperature (twb): 29 C Relative humidity ( ) 92%Cooling water inlet (t2): 43 CCooling water outlet (t1): 33 C Altitude ( Z): 10 mStep I. This step involves heat load calculations as follows:1. Range (t2 – t1) 43 – 33 10 C
2. Approach (t1 – twb) 33 – 29 4 C3. Heat load, Q mCp(t2 – t1) 998.13 x F x Range 998.13 x 3,000 x 10 29,943,900 kcal/hStep II.This step involves total psychometric calculations as follows:1. Barometric pressure (p) at the given altitude (Z) is calculated by using the following equation:(3)For an altitute of 10 m, this becomesp 101.2 kPa2. Assume a dry bulb temperature of say, tdb 32 C3. Calculate water vapor saturation pressure (pws) at the assumed tdb for the temperature range of 0 to200 C using the equation:(4)Where:C 1 –5.8002206 x 10³C 2 1.3914993 x 100C 3 – 4.8640239 x 10⁻²C 4 4.1764768 x 10⁻⁵C 5 –1.4452093 x 10⁻⁸C 6 6.5459673 x 100and T represents the dry bulb temperature in Kelvin. This results in the value:pws 4.7585 kPa4. The partial pressure of water (pw) at given relative humidity is found using the following equation:(5)
pw 4.3779 kPa5. The partial pressure (pws) is again calculated using Equation 4. This time T represents the wet bulbtemperature in Kelvin, which calculates to:pws 4.0083 kPa6. Using pws calculated in Step 5 we recalculate twb using the Carrier equation:(6)which gives the result:t wb 37.7 C7. This step is an iterative process, whereby the assumed value of tdb in Step 2 is varied in such a waythat the calculated twb in Step 6 equals the actual (real) twb.8. After a number of iterations, the calculated t db value converges to 30.12 C.Step III.This step involves the calculation of the inlet air enthalpy (h1) as follows:1. The humidity ratio (W) for dry air is calculated using the following equation:(7)W 0.02515 kg water/kg dry air2. The specific volume (v) for dry air is calculated using the following equation:(8)v 0.89511 m3/kg, dry air3. Calculate the enthalpy o
and define the performance of a cooling tower, namely: 1. Hot water temperature, HWT 2. Cold water temperature, CWT 3. Wet bulb temperature, t wb 4. Water mass flowrate, L 5. Air mass flowrate, G The first four parameters are determined by the user of the cooling tower. It is the fifth quantity, G, that is selected by the designer of the cooling tower. Once these five quantities are available, the towerFile Size: 255KBPage Count: 14