Transcription
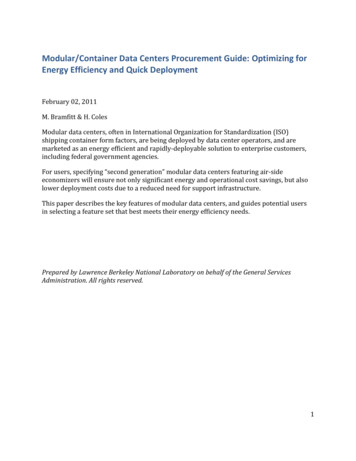
Cooling Data Centers with Cooling TowersJonathan B. Maxwell and Gary Epstein, Energy & Resource SolutionsABSTRACTThousands of data centers and server farms have been installed in the last 10 years.Continued growth is certain. Each data center requires a reliable cooling system to prevent thecomputers from overheating. From an energy use perspective, evaporative heat rejection usingcooling towers seems well-suited for data center cooling, yet design engineers often specify drycondensers instead, even for large cooling plants.The paper presents an example application from California’s Silicon Valley, where acustomer upgraded from an air-cooled to a water-cooled HVAC system for their new data center.The customer’s electricity usage budget for data-center cooling dropped by half. They realized a50 percent internal rate of return and a 9 million present value. There were barriers toimplementing the upgrade, however, few of which were technical or economic.This paper examines the barriers and describes how they were overcome. The lessonslearned lead to unconventional energy-efficiency program policy recommendations regardingmaintenance of objectivity in program administration and regarding standardized incentives.Specifically, the authors recommend encourage allowing advocacy when operating utilityprograms, rather then just objective arbitration, and recommend reconsidering prescriptiveincentives for large high efficiency air-cooled packaged air conditioners. The recommendationsapply to data center cooling in particular but also to the topic of large industrial upgradesgenerally.BackgroundAn energy study was performed at an office building leased by a computer hardwaredesign firm in California’s Silicon Valley. The building was less than 6 years old andopportunities discovered were unremarkable. In the course of the study, the tenant noted thatthey recently had secured a new long-term lease to an adjacent building and were converting it toa large data center. Build-out and design engineering were underway. The heat load was forecastto be continuous, large, and intense—ultimately reaching 1,440 tons and over 160 W/sq. ft. Planscalled for the immediate installation of two 500-ton air-cooled chillers and two more 500-tonchillers over the next 4 years as the data center load increased. Once at design capacity, annualenergy costs were expected to reach 1.2 million per year, or 40 per square foot.Savings PotentialPreliminary analysis indicated that installing a high-efficiency (0.50 kW/ton) watercooled centrifugal chiller with a cooling tower and VFDs controlling the tower fans andcompressors instead of the two-stage air-cooled screw chiller systems would reduce electric costsby half. Table 1 shows the basic system efficiency calculations and figure 1 illustrates the fulland part-load savings potential graphically. 2007 ACEEE Summer Study on Energy Efficiency in Industry2-102
Table 1. Chiller System Efficiency Calculations, Per Ton BasisAnnual Energy Cost Savings Per TonTrane RTAC 500-ton Air-Cooled Chiller xxLoad: 50%0.7200.0880.0080.816 14.7 EER8,7607,148 0.076 54375%0.8750.0880.0060.968 12.4 EER8,7608,481 0.076 645100%1.1580.0880.0041.250 9.6 EER8,76010,949 0.076 832kW/ton multiple 2-stage screw chillerskW/ton condenser fanskW/ton external controlskW/ton to remove heat from evaporatorhr/yrkWh/ton/yr/kWh/ton/yrTrane CVHF 500-ton Water-Cooled Chiller x x Load: 50%0.3400.0080.0630.0200.0110.442 27.1 EER8,7603,875 0.076 295 24946%75%0.4200.0060.0420.0130.0250.506 23.7 EER8,7604,433 0.076 337 30848%100%0.501 kW/ton VSD chiller0.004 kW/ton controls0.031 kW/ton CS condenser water pump0.010 kW/ton CS tower water filter pump, vent fan0.045 kW/ton VSD tower fan & sump pump0.592 kW/ton to remove heat from evaporator 20.3 EER8,760 hr/yr5,182 kWh/ton/yr 0.076 /kWh 394 /ton/yr 43853%/ton Annual water-cooled energy savings ifall hrs at noted loadNotes(1)Economizers are not required in data centers per Title 24 Exception 4 to Section 144.e.1.Incorporation of water side economizer operation to the central plant would increase savings and, if alarger tower is purchased, cost. If air-side economizers were added for in the air-cooled option, savingswould be reduced.(2)SVP CB-1 at 90% load factor, including taxes and 12 kV discount.(3)The water-cooled system would have water treatment maintenance costs that the air-cooled systemwould not.(4)The air-cooled packaged system would have 8x as many compressors, condensers, fans, and motors tomaintain.(5)No credit or penalty has been taken for differing equipment life. 2007 ACEEE Summer Study on Energy Efficiency in Industry2-103
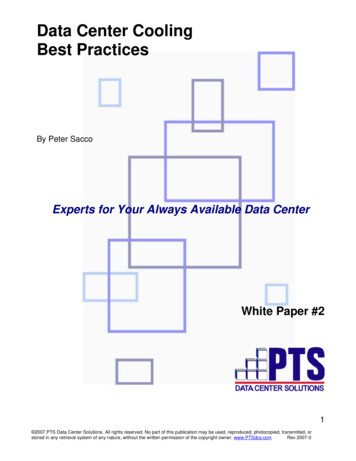
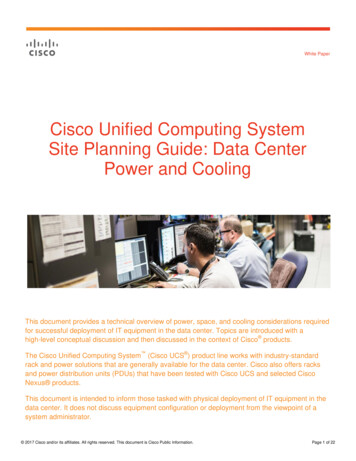
Figure 1. Chiller System Efficiency CurvesWater Chiller System Energy Efficiency RatioAs a Function of Load30.0EER (Btu/hr/W)25.020.015.010.0Water-cooled VFD centrifugal and tower5.0Packaged air-cooled screw (Trane RTAC 500)0.020%40%60%80%100%120%Percent Full CapacityTower water evaporation added 61/yr./ton to the water-cooled option operating costs.The data center designers forecast a first year load of 360 tons with gradual increases untilreaching a total load of 1,440 tons. Four 500-ton chillers would allow 100 percent redundancy.Table 2 shows the projected load increase, savings potential, and assumed chiller configuration.Table 2. Total Annual Load and SavingsYear12345 Load Range(Tons)240—480480—960960960—14401440Avg. Load(Tons)36072096012001440AnnualSavings 127,000 270,000 421,000 480,000 631,000Load Configuration50%, 75%, 100% of one chiller100% of one chiller, 50% of another100% of two chillers100% of two chillers, 50% of another100% of three chillersBackup Capacity0%-50% of one chiller plus an additional chiller0%-100% of one chiller plus an additional chillerone chiller0%-100% of one chiller plus an additional chillerone chillerThe price premium was considerable, over 500/ton after deducting the avoided costs ofthe air-cooled plant not purchased. The price included a new 200,000 building shell to housethe plant. Even so, the financial benefits were impressive.Figure 2 shows the forecast cash flows and valuation for the customer. Similar chartsbased on financing instead of capital funding were also provided that demonstrated immediatepositive cash flow. In summary, the project offered a 48 percent rate of return, a 9 millionpresent value over 20 years, and a simple payback time of between 1.6 and 2.8 years for whatwould eventually grow to 950 kW and 8.3 million kWh/yr. of savings. 2007 ACEEE Summer Study on Energy Efficiency in Industry2-104
Figure 2. Investment and ReturnNet Cash Flow for Upgrading to Water-Cooled Central Plant 3,500,000Net Energy /Water Savings DuringYr 3,000,000Savings (Cost) Realized During YearNet Capital Cost at End of Year 2,500,000Cumulative Net Savings (Cost) 2,000,000Discounted Cumulative Net Savings(Cost) 1,500,000 1,000,000 500,000 0012345678( 500,000)( 1,000,000)YearBy most standards the upgrade to a water-cooled plant made financial sense. Thecustomer’s design engineering firm agreed the proposal was technically feasible andeconomically sound, but it almost wasn’t executed and it certainly hadn’t been planned initially.The next section addresses the barriers to implementing this project.Barriers to ImplementationThe common energy efficiency project barriers of payback time, capital availability, andlack of time were minor obstacles for this project but not major impediments. Technicalcompetence was not a barrier at all. In fact, the major reasons this customer did not originallyplan to build a water-cooled system may surprise some readers. They were as follows:yyyyParking lot spaceEarthquake threatLong lead timesSavings awarenessParking lot space. The data center roof could have supported the planned air-cooled boxcarunits but would have required cost-prohibitive modifications to bear the alternative chillers,tower, and auxiliary equipment load. This meant that a new central plant would need to be placedin the parking lot, which would eliminate about a dozen parking spots. The site met the city ofSanta Clara’s minimum municipal standard for parking lot spaces per square foot of commercial 2007 ACEEE Summer Study on Energy Efficiency in Industry2-105
office space with the existing surface, but did not have spaces to spare. The prospect ofeliminating parking spaces constituted a barrier to the project.Earthquake threat. The customer is an international firm with offices in Asia and customersaround the world that depend on the data center 24 hours a day, 7 days a week. They wanted tobe able to continue data center operation through a major seismic event. To that end the facilitywas installing large capacity uninterruptible power supplies, battery backup, backup generators,and feeds from two different branches of the utility distribution system. Furthermore, since thelocal utility, Silicon Valley Power, had proved resilient during the 1989 Loma Prieta earthquake,site selectors considered the facility to be well protected from electric utility loss.Telecommunications wiring was equally redundant, and the facility was not designed to bedependent on gas or water. Thus, as long as the building could structurally withstand anearthquake, operations would not be affected during an event. Adding a cooling tower with itsneed for water to function at most times appeared to immediately add a point of vulnerability.This was a barrier.Long lead times. In the recent past the engineering design firm had experienced long lead timesfor centrifugal chillers, particularly the high efficiency versions. The project could not bear therisk of long chiller lead times.Savings awareness. While the customer understood generally that packaged air-cooled systemswere less efficient, until they were presented with the savings analysis, they did not realize themagnitude of future cash flow that was at stake.Other barriers for similar projects. The design firm cited lead time, first cost, and long-termbusiness uncertainty as the three most prominent reasons that air-cooled data-center cooling isfound throughout California. The fact that tenants often lease rather than own their buildings isalso a likely contributing factor.Overcoming the BarriersIn a conventional utility audit program the consulting service ends with the audit report.In an incentive processing or performance contracting program the utility service starts uponreceipt of a developed project application and focuses on reviewing claimed savings. Thisopportunity required active involvement from conceptualization through to the beginning ofimplementation. In particular it required involvement of the nature that makes some energyefficiency program managers and evaluators uneasy—advocacy.Fortunately for the customer, Silicon Valley Power has a flexible contract with theirprogram service provider that allows provision of facilitation services and other roles that acontractor with a limited scope cannot offer.Before attacking the barriers the program lead engineer and facilitator met with thecustomer’s design engineer at his office to discuss the reasonableness of the savings analysis andthe practicality of the proposed new approach. He responded favorably and encouraged thecustomer to pursue the matter, with cautions regarding the schedule and certain increased redesign costs. This endorsement was critical to project success. 2007 ACEEE Summer Study on Energy Efficiency in Industry2-106
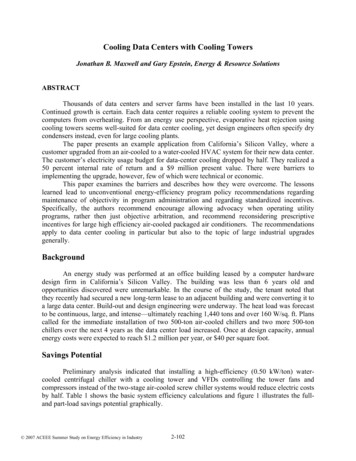
Next, with the blessing of the customer, the facilitation leader met with the city of SantaClara’s buildings and codes department to inquire about a possible variance on the parkingruling. Officials were most cooperative. The rationale for asking for a variance was bothpractical (the data center would not have anywhere near the occupant density as an office, andthe building was unlikely to revert from a data center to an office in the near future) andaltruistic. The city had made a major push to support sustainability practices across the full rangeof provided municipal services. The request for a variance that would save so much energy—andwas made with the support of the municipal electric utility—fell on receptive ears and ultimatelywas approved.Regarding water supply, the engineers identified three different potential backup watersources: a well, a connection to an alternate water main, and a temporary line running from theadjacent building (which was on the other distribution main) in the event primary makeup waterwas lost. We believe that the demonstrated and implicit support of the power utility facilitatedthe decision-making process for all parties.Finally, the engineers talked with Trane and discovered that due to the then-currenteconomic slowdown lead times had dropped considerably – to 10 weeks – which made lead timea non-issue.Armed with these solutions and the powerful economic message, the customer facilitiesmanager and the utility-sponsored engineer met with the chief financial officer to present thebusiness case for a major capital increase in the build-out cost. The change was approvedvirtually immediately. The entire process lasted less than 6 weeks.The design firm immediately overhauled the chilled water plant design documents andinformed the project architect of the need for a new building to be built in the parking lot. Theresulting plant is shown in figure 3.Figure 3. New Central Cooling Plant 2007 ACEEE Summer Study on Energy Efficiency in Industry2-107
Program Design Ramifications and RecommendationsEnergy efficiency program models driving utility and government offerings have evolvedover the last 25 years but tend to have at least one common theme: commitment to objectivitywithout advocacy or direct project facilitation. While admirably defensible and undoubtedly ofgreat comfort to program evaluators and legal departments, such focus may not be the best wayto garner the savings from the biggest industrial projects—the fattest fruit on the tree. Projectsthat cost and save m
EER (Btu/hr/W) Water-cooled VFD centrifugal and tower Packaged air-cooled screw (Trane RTAC 500) Tower water evaporation added 61/yr./ton to the water-cooled option operating costs. The data center designers forecast a first year load of 360 tons with gradual increases until reaching a total load of 1,440 tons. Four 500-ton chillers would allow 100 percent redundancy. Table 2 shows the .