Transcription
CTC WorkshopCaltrans Project CostDevelopment Processby Mike Keever and Tim SobelmanDecember 5, 2018
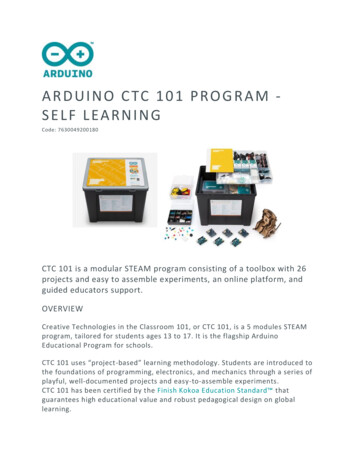
Phases of Project DevelopmentCapital Outlay Support (COS)ProgramPS&E (Design)PIDProgramming& EDCompleteDEFINITIONSTransportation Asset Management PlanProject Initiation DocumentProject Approval and Environmental DocumentPlans, Specifications and EstimateReady to List for AdvertisingEnd ConstructionRight of WayProgrammingTAMPPIDPA&EDPS&ERTLCOS CloseoutBegin ConstructionNeed &PriorityIdentifiedPlanningDesign Complete, RTL andRight of Way CertificationTAMPEndProject
Risk and Uncertainty During Project Phases20% Known80% UnknownRisk and UncertaintyHigh80% Known20% leteProject InitiationDocumentProgrammedLowProject LifecycleModified version of Project Management Institute, A Guide to the Project Management Body of Knowledge, (PMBOK Guide) – Fifth Edition,Project Management Institute Inc., 2013 Page 40 Figure 2-9
Phases of Project reliminary Engineering (15 )Construction (85 )Closeout Complete80% Known20% UnknownConstruction Complete20% Known80% UnknownDesign CompleteRight of WayPA&EDCompleteRisk and UncertaintyHighProgramming& AllocationPIDCOS CloseoutAllocationPS&E (Design)ProgrammedNeed &PriorityIdentifiedCapital Outlay Support (COS)Program
What is a costestimate?
Cost Estimate Definition1.2.3.Forecasting the expense of building aprojectAn approximate prediction of howmuch money is needed to complete aprojectThe art of assigning value combinedwith the science of making use oftechniques to predict the cost ofactivities and assets.
Risk RegisterProject Management Forum
How CaltransDevelops CostEstimates
Bid Summaries/Raw Data
Bid Summaries/Raw Data
Probabilistic Cost Estimateusing Monte Carlo simulationCertainty dRange of ValuesSensitivityAnalysis
CCARTLPA&EDPIDCost Estimating Uncertainty
The Challenge of aDynamic BiddingEnvironment
Construction Costs can be Volatile andDifficult to Predict2018?2006
What’sNext?Construction Cost ar2014201620182020
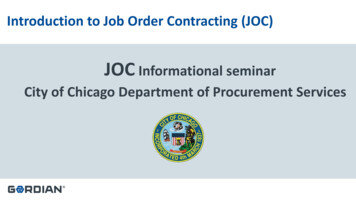
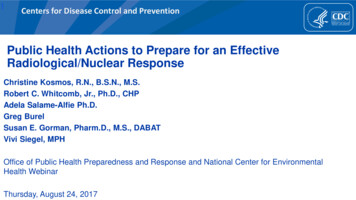
More Bidders Equals Lower CostsLow Bidder Above or Below Estimatevs. Number of BiddersAverage Number of Bidders perProject20%Average Percentage Low Bidder was Above orBelow Engineer’s EstimateAverage Number of Bidders per Project9.08.07.06.05.04.03.02.01.00.02007 2008 2009 2010 2011 2012 2013 2014 2015 2016 2017YearAverageNumber ofBidders perProject is 5.810%0%-10%-20%Low Bidequals-30%-40%-50%-60%-70%0246810121416Number of Bidders per Project(Projects Bid Opened from July 2004 to December 2017)18
What Can Happenin 6 Months?
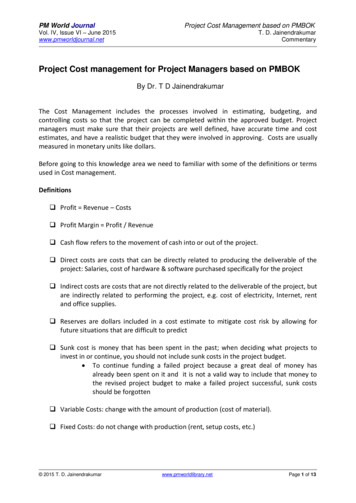
100 Oil Becomes 50 OilMay 10, 2018CNBC: “Oil prices risk spiking to 100 next year, Bank of Americaanalysts say.”October 3, 2018Reuters: “Oil traders have piled into wagers that U.S. crude oilcould surge to 100 a barrel by next year.”November 29, 2018CNN: “US crude fell below 50 a barrel Thursday .”
Crude Oil PricesMacrotrends
The Results
Data set is 476 projectsawarded in the FY 17/18FY
PROJECT COST RISK MANAGEMENTProject Change Management HierarchyCTCWatch ListCaltrans HQ - ProjectChange ManagementCaltrans District - ProjectChange Management
PROJECT COST RISK MANAGEMENTCaltrans Identifies Changes: during allproject phases through: Studies – Environmental, Engineering Surveys Geotechnical Analysis Field Reviews Coordination with Local Partners andthe public Permit NegotiationsCaltrans District - ProjectChange ManagementCaltrans Manages Changes through: Project Development Teams District Status Meetings Executive Review Task Management Qualitative and Quantitative RiskManagement
PROJECT COST RISK MANAGEMENTWatch ListCaltrans HQ – ProjectChange ManagementDistricts Coordinate with Headquartersto Identify, Evaluate, Manage andMitigate Change: Quarterly Status Meetings HQ Functional Coordinators HQ Executive MeetingsConsiderations Amendments- Cost or Schedule Split or Combine Projects Time Extensions Greater than 20% Allocations Supplemental Fund Requests
PROJECT COST RISK MANAGEMENTBefore project changes ( 20 percent orSupplemental allocations) are presentedto the Commission for action:CTC Caltrans - Office of CTC LiaisonCoordinationPre-meetings with CTC Staff
PROJECT COST RISK MANAGEMENTCTCWatch ListCaltrans HQ - ProjectChange ManagementCaltrans District - ProjectChange ManagementApprovals Supplemental Funding Greater Than 20% AllocationDecisions Amendments Splits/Combines Accelerate/Delay Time ExtensionsActions Alternatives Scope Changes Staff Redirection Brokering
Supplemental and “Greater than 20%” AllocationsGreater than 20%(Tab 68-69)Supplemental to Award(Tab 70-76)Supplemental toComplete Construction(Tab 78)Greater than 20% - Initial AllocationSupplemental - Secondary AllocationSupplemental toConstruction Closeout(Tab 77)
Five-Year Greater Than 120% vs AwardedFYs 13/14 to 17/180.60%1.60%
Five-Year Supplementals to Award vs AwardedFYs 13/14 to 17/18 1%2.60%
Five-Year Supplementals to Complete Construction vsConstruction Contracts Completed-FYs 13/14-17/180.63%1.40%
PROJECT COST RISK MANAGEMENTCTCWatch List95-99% ofProjectsCaltrans HQ - ProjectChange ManagementCaltrans District - ProjectChange ManagementSupplemental Funding andGreater Than 20%Allocation Requests
What We areDoing to Improve
Cost Estimating Improvement Initiative Improved Estimating Tools Identification of Best Practices Quantification of Risk Training Business Intelligence Economist
Construction Cost Escalation Study Research and assess Caltrans’ construction cost escalationpractices and existing forecast methodology Generate risk-adjusted forecasts for the CaliforniaHighway Construction Cost index (CHCCI) Develop regional factors to account for different pricedynamics across the State37
3rd4th2020/1st2nd% of 1987 BasePrice Trends Forecast700QUARTERLYPRICE TRENDS AND FORECASTFOR HIGHWAY CONSTRUCTION550500450Structural Concrete(Iowa)50th percentile forecast80 percent confidenceinterval25020015010050Year/Quarter38
Delivery Results
FY 17-18 4th QuarterProject Delivery Performance MeasuresProject Costs at End of Construction1ExpendedBudgetSavings%AnnualGoal (%)On TargetCosts for 29Completed STIPProjects 1.37 B 1.59 B 218 M86% 100% Costs for 388CompletedSHOPP Projects 2.11 B 2.34 B 228 M90% 100% Measure1 Constructioncosts are calculated 6 months after the end of construction
Questions?
CTC WorkshopBidding Environmentby Rachel FalsettiDecember 5, 2018
Bidding EnvironmentAverage Number of BiddersAverage Number of Bidders per Fiscal Year16/1717/1818/19
Bidding EnvironmentLow Bid vs. Engineer's EstimatePercentage of Low Bid Above/Below Engineer's %-20%Fiscal Year16/1717/1818/19
Bidding EnvironmentConstruction Cost ar2014201620182020
More Bidders Equals LowerCostsAverage Number of Bidders per ProjectLow Bidder Above or Below Estimatevs. Number of Bidders9.0Average Percentage Low Bidder was Aboveor Below Engineer’s EstimateAverage Number of Bidders per Project8.07.06.05.04.03.020%AverageNumber ofBidders perProject is 5.810%0%-10%-20%Low Bidequals-30%-40%2.0-50%1.0-60%0.02007 2008 2009 2010 2011 2012 2013 2014 2015 2016 2017-70%Number of Bidders per Project(Projects Bid Opened from July 2004 to December 2017)05101520Year46
Bidding EnvironmentNUMBER OF CONTRACTS AWARDED TOBIDDERS8 New Bidders Awarded14 of 659 Contracts170 Previous Bidders Awarded645 of 659 ContractsApril 2017 – November 2018
Bidding EnvironmentBids Received for Advertised Projects43 bidders submittedmore 50% of the bids 1852 Projects advertised 9575 bids submitted501 bidders submittedless than 50% of the bidsJanuary 2015 - November 2018
Awarded Projects (17/18) 698 Projects Awarded 89%less than 10m 78%less that 5m 38% less that 1m
Factors Potentially InfluencingConstruction Costs General inflation Market conditions Materialshortage Labor costs Highway construction spending Unforeseen events Insufficient bid competition
Questions?
CTC WorkshopResource Agency Influence onProject Deliveryby Jeff Wiley and Phil StolarskiDecember 5, 2018
Environmental LawsFish and Game CodeSection 4(f)CA Coastal ActResource Conservation andRecovery Act
Agencies and RequirementsNumber ofLawsIncreasing Project Delivery Requirements(Pre- 1940 to Present)20010002554708191102108To 1970To 1980To 1990To 2000To 2010To 2015To Present Environmental Laws, Regulations and Orders
Environmental DocumentsSHOPP Projects Categorical Exemptions – Over 90% Initial Studies/Negative Declarations – Almost 9% Environmental Impact Reports – 0.5%STIP Projects Categorical Exemptions – 33% Initial Studies/Negative Declarations – 41% Environmental Impact Reports – 26%
Environmental Costs Support Capital expenses Right-of-way
Costs Related to Permits57
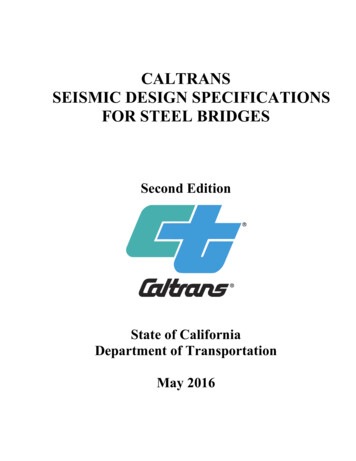
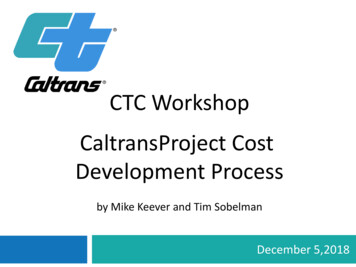
Costs for Project with Permitting FeesProjects With Mitigation or Permitting Fees that achieved CCA within the14/15, 15/16 or 16/17 FYAvg. Mitigation Max Mitigation andPermit Costand PermittingNumber Avg. Total Env Cost(% of Total Cost)CostSHOPP222 167,606 41,80113.38%STIP72 908,442 463,0809.92%Data set 745 SHOPP and 166 STIPProjects that achieved ConstructionCompletion in FYs 14/15, 15/16, or 16/17
SHOPP: Environmental Cost vs Total CostEnvironmental Cost vs Total CostSHOPP with Mitigation or Permit FeesMitigation andPermit Fees0.35%RemainingProject Costs98.60%Env. SupportCosts1.05%Data set 222 SHOPP Projects that achieved ConstructionCompletion in FYs 14/15, 15/16, or 16/17, and had specificpermitting or mitigation expenditures
STIP: Environmental vs Total CostEnvironmental Cost vs Total CostSTIP with Mitigation or Permit FeesMitigation andPermit Fees0.68%RemainingProject Costs98.67%Env. SupportCosts0.65%Data set 72 STIP Projects that achieved ConstructionCompletion in FYs 14/15, 15/16, or 16/17, and hadspecific permitting or mitigation expenditures
Efficiencies NEPA Assignment Advance Mitigation Program AB 1282 – Transportation Permitting Task Force
NEPA Assignment Reduces reviews Time-savings for projects Requires waiver of immunity
Advance MitigationAcceleratetransportationproject cationwith stakeholdersEnsure theProgramaccount isself-sustainingAdvance Mitigation ProjectsPurchase or Create Mitigation
AB 1282Establishes the Transportation Permitting Task ForceStatutory Goals: Early engagement Reasonable deadlines Greater certainty of permit approval requirements
Questions?
CTC WorkshopEngaging the Industryby Janice Salias and Ramon HopkinsDecember 5, 2018
Caltrans’ Small Business ProgramSmallBusiness(SB)Disabled ssEnterprise(DBE)17.6% Overall Goal25% Overall Goal3% Overall GoalState-FundedContracts andProcurementsState-FundedContracts andProcurementsFHWA-AssistedContracts andProcurementsCalifornia Code ofRegulationsCalifornia Code ofRegulationsCode of FederalRegulations
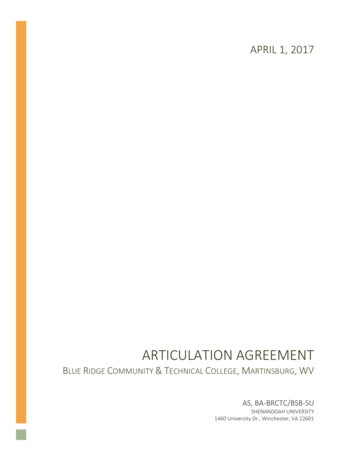
Caltrans’ SB, DVBE, and DBE ParticipationSB Participation - 25% GoalDVBE Participation –3% GoalDBE ParticipationOverall GoalDBE Dollars% atCommitment% 47,149,004 3.83% 275,730,54912.40%12.5%15/16 519,879,000 46.05% 57,190,818 5.07% 314,950,43013.15%12.5%16/17 408,919,922 28.86% 46,800,099 3.30% 264,592,75912.08%12.5%17/18 509,017,424 28.51% 87,857,147 4.92% 359,506,55414.88%12.5%18/19 95,056,771 28.40% 11,010,7271st Qtr 24,980,875(1st month of FY)16.98%17.6%FYSB Dollars%14/15 349,378,944 28.4%DVBE Dollars%3.3%
OBEO’s Training and Outreach to Support Business Training, technical assistance, and advocacy services Training to help prepare small businesses to competefor Caltrans’ contracting and procurementopportunities Certification workshops Prime contractor training Subcontractor training “Doing Business with Caltrans: Getting Started”
OBEO’s Training and Outreach Objectives Organize and participate in outreach events Promote awareness of Caltrans’ contracting andprocurement opportunities Pre-bid meetings/pre-proposal conferences Business matchmaking events Procurement fair Develop comprehensive Senate Bill 1 and Senate Bill103 outreach plans
District Efforts to Increase Participation District Small Business Liaisons (DSBLs) Develop partnerships with local and regionalentities Market Caltrans’ contracting and procurementopportunitiesOne District is testing a Contractor Boot Camp Provide assistance in Certification Bidding Marketing/Building Relationships Contractor Compliance
Industry Involvement Statewide Small Business Council Standing committees Ad hoc committees DBE Participation Committee Task groups Meetings with Industry Organizations Caltrans internal stakeholders
OBEO Certifies Disadvantaged BusinessEnterprises (DBE) Currently no backlog in processing new applications Increase the pool of certified DBEs DBE Certification Workshops to be held throughoutthe state and specific workshops with small businessorganizations
OBEO Provides Supportive Services toDisadvantaged Business Enterprises (DBE/SS) DBE program is guided by USDOT regulations(49 CFR Part 26) The first in the nation pay-for-performancemodel with established metrics the consultant isexpected to achieve
DBE/SS Totals to DateProgram launched in August of 2018: 130 certified DBEs enrolled into the BusinessDevelopment Program (BDP) 7 firms have graduated from the BDP 18 bids for contracts have been submitted 2 contracts have been reported as awarded
DBE/SS Program Providers Northern Region - Humboldt State UniversitySponsored Programs Foundation(Districts 1, 2, 3, and 4) Central Region - CSU Fresno Foundation(Districts 5, 6, 9, and 10) Southern Region - MiraCosta Community CollegeDistrict (Districts 7, 8, 11, and 12)
On-The-Job TrainingSupportive Services (OJT/SS) Provides training to increase the participation ofwomen, minorities, and other disadvantagedindividuals in skilled crafts on federal-aid highwayconstruction contractsCurrent OJT/SS contracts include: Field Ironworkers Apprenticeship Program Including a nationwide women-only boot camp South Bay Workforce Investment Board – SouthernCalifornia - Pre-Apprentice training Ladders of Opportunity – Pre-Apprenticeshiptraining
National Summer TransportationInstitute (NSTI) A career awareness initiative designed to introducedisadvantaged secondary school students to allmodes of transportation-related careers Provides academic enhancement activities Encourages students to pursue transportation-relatedcourses of study at the college/university level
Increasing Construction Costs Changing Market Conditions Labor Shortage Industry Engagement
Changing Market Conditions Increased Demand Local Roads and Private Development Market Volatility Tariffs Oil Price Fluctuations Foreign Economies
Completed Initiatives 12 Month Look Ahead Materials on Hand Aggregate Resource Policy Statement Increase use of Recycled Material
Completed Initiatives Hot Mix Asphalt Formula Approval Collaborative Payment Policy DBE Certification Process Review Newly Certified DBE Reporting DBE Supportive Services
Ongoing Initiatives Designated Storage Areas Automated Technology Renewable Diesel Pilot Small Business “Bootcamp”
Labor Shortage Need for additional labor Competition with other States Increase Salary
Attracting New Workforce Caltrans Hiring Centers Recruitment Industry Helmets to Hardhats Community College Outreach Apprentice Programs
Questions?
Number Avg. Total Env Cost Avg. Mitigation and Permitting Cost Max Mitigation and Permit Cost (% of Total Cost) SHOPP STIP 222 72 167,606 908,442 41,801 463,080 13.38% 9.92% Data set 745 SHOPP and 166 STIP Projects that achieved Const