Transcription
2020South DakotaMotor VehicleTraffic CrashSummaryPrepared ByDepartment of Public SafetyOffice of Highway Safety/Accident RecordsKristi NoemGovernor
TABLE OF CONTENTSI.INTRODUCTION1South Dakota Statistical Summary. . 2II.HISTORICAL TRENDS3Motor Vehicle Crashes . 3Alcohol Involvement . 6Restraint Usage . 10Cycle and Pedestrian Crashes . 13Holiday Counts . 16Severity of Injuries . 18Sex of Drivers . 20III.MOTOR VEHICLE CRASH PROFILE21Introduction . 21First Harmful Event. 26Manner of Collision. 27Highway System . 28County Summary . 32City Summary . 34Roadway Surface Conditions . 35Crashes by Time of Day, Month, and Day of Week . 36Drivers . 39Contributing Circumstances . 44Motorcycles . 46Pedestrians . 49Bicycles . 51IV.IMPORTANT EVENTS AND DATES52V.GLOSSARY OF TERMS53
LIST OF 203-213-223-233-24Fatality Rate Comparison . 3South Dakota Yearly Comparison of Motor Vehicle TrafficFatalities, Injuries, Crashes, Miles Traveled, andRegistered Motor Vehicles . 4Alcohol Involved Crashes as Percent of All Crashes . 6Persons Killed in Alcohol Involved Crashes by Age. . 6Crash and Arrest Activity . 8Safety Restraint Usage Killed Occupants . 10Safety Restraint Usage Injured Occupants . 10Killed & Injured Motor Vehicle Occupants by Ejection Status . 10Fatalities and Injuries to Motor Vehicle OccupantsUnder Five Years of Age . 12Safety Restraint Usage Under 5 Years of Age . 12Motorcycle Crashes . 13Pedestrian Fatalities and Injuries . 15Bicycle Fatalities and Injuries . 15Crashes during Holidays . 16-17Fatalities and Injuries of Total Persons . 18Fatalities and Injuries of Total Drivers . 18Fatalities and Injuries of Total Passengers . 19Fatalities and Injuries of Total Bicycle Drivers . 19Fatalities and Injuries of Total Pedestrians . 19Sex of Drivers . 20Fatalities and Severity of Injuries of Drivers, Passengers,Pedestrians, and Bicyclists . 21Fatalities and Injuries by Mode of Transportation . 22Vehicle Types Involved in Crashes . 24Fatalities and Injuries by Age Group . 25First Harmful Event . 26Manner of Collision for Crashes Involving a Collision BetweenTwo or More Motor Vehicles . 27Crashes by Type of Highway . 28Reported Traffic Crashes - South Dakota Counties. 30Reported Alcohol Traffic Crashes - South Dakota Counties . 31Counties Having More Than Two Percent of the Rural Fatal andInjury Crashes . 32Traffic Crashes - South Dakota Cities Population 2500 and Over. 34Roadway Surface Conditions . 35Crashes by Time of Day . 36Crashes by Month . 37Crashes by Day of Week . 37Age of Drivers in Crashes . 39Age of Drinking Drivers in Crashes . 40Licensed Drivers and Fatal and Injury Crash-Involved Drivers by Age . 41Motor Vehicle Driver Contributing Circumstances . 45Motorcyclists by Age Group . 46Helmet Use by Motorcycle Drivers in Crashes . 48Age of Pedestrians in Traffic Crashes . 49Alcohol Involvement by Pedestrians . 50Rural vs. City Pedestrian Crashes . 50Age of Bicycle Drivers in Traffic Crashes . 51
LIST OF FIGURES2-1Fatality Rate Comparison . 32-2Traffic Fatalities - Alcohol Related vs. Non-Alcohol Related . 72-3Traffic Injuries - Alcohol Related vs. Non-Alcohol Related . 72-4Fatal and Injury Crashes and DWIs. 92-5Fatal Crashes. . 92-6Safety Equipment Usage Killed Occupants . 112-7Safety Equipment Usage Injured Occupants . 113-1Fatalities by Travel Mode . 233-2Injuries by Travel Mode . 233-3Traffic Crashes by Highway System Type. 293-4Fatal Traffic Crashes by Highway System Type . 293-5Rural Fatal and Injury Crashes/Vehicle Miles Traveled . 333-6Crashes by Time of Day . 383-7Crashes by Month . 383-8Crashes by Day of Week. 383-9Drivers by Age Group - Fatal and Injury Crash-Involved Drivers. 423-10 Young Drivers - Fatal and Injury Crash-Involved Drivers . 433-11 Motorcyclists - Crash-Involved Motorcycle and Moped Drivers . 47
I. INTRODUCTIONThe Motor Vehicle Traffic Crash Summary is divided into two main sections, Historical Trendsand 2020 Motor Vehicle Traffic Crash Profile. The Historical Trend section providesinformation on alcohol involvement in motor vehicle crashes, severity of injury by record typeand sex of drivers involved in crashes. This section also provides data on restraint usage andcrash trends. The 2020 Traffic Crash Profile section details the crash picture for 2020 as wellas a glossary of terms.The South Dakota Crash Data System conforms to standards established by the ModelMinimum Uniform Crash Criteria (MMUCC) guidelines. The purpose of MMUCC is to providea standardized data set for describing crashes of motor vehicles that generates the necessaryinformation to improve highway safety.By utilizing MMUCC, the highway safety community is making an explicit statement thatcomparable data from all states are crucial to our ability to identify problems and makeimprovements.Information collected from crash reports is merged into a central computerized crashdatabase. This data provides the basic information necessary for developing effective highwayand traffic safety programs. The crash data is used by local, state and federal agencies to: Identify highway and traffic safety problem areas.Initiate and evaluate the effectiveness of laws and policies intended to reducedeaths, injuries, injury severity and costs.Assess the relationship between vehicle and highway characteristics, crashpropensity, and injury severity to support either the development ofcountermeasures or their evaluation.The majority of the information in this book is compiled by the Office of Accident Records withinthe Department of Public Safety. Current state law requires an accident report to be filed foreach motor vehicle traffic accident resulting in the death or injury of a person, or propertydamage to an apparent extent of one thousand dollars or more to any one person'sproperty or two thousand dollars accumulated damage per accident.Law enforcement agencies provide the accident reports to the Office of Accident Records.These individual reports are available to the public for a search fee of four dollars. Copies ofaccident reports are available online at www.SafeSD.gov for a fee of ten dollars. This fee iscomprised of a 6 convenience fee and a 4 fee as required by SD Law §§32-34-13.1 for acopy of an accident report.FOR FURTHER INFORMATION:Office of Accident Records118 West Capitol AvenuePierre SD 57501-2000Phone:605.773.4156E-mail: arinfo@state.sd.usWebpage: http://safesd.gov/yearly-crash-data.htmlNOTE! Data Extracted on 06/11/2021. This report reflects a one day picture of CY2020 data collected, any data received afterthis date would not be included in this report.1
SOUTH DAKOTA TRAFFIC STATISTICAL SUMMARY2019-2020201920,391202017,599 128 MILLION 115 MILLIONNUMBER OF MOTOR VEHICLE TRAFFIC CRASH INJURIES -------4,8724,462 NUMBER OF MOTOR VEHICLE TRAFFIC CRASH FATALITIES----102141 FATALITY RATE PER 100,000,000 MILES OF TRAVEL ---------------1.031.45 PERCENT OF DRIVERS IN FATAL CRASHES WHO HAD BEEN DRINKING .20.6%24.7% NUMBER KILLED IN ALCOHOL-RELATED CRASHES ----------------2851 NUMBER INJURED IN ALCOHOL-RELATED CRASHES --------------552645 NUMBER OF PEDESTRIANS KILLED ---------------------------------------814 NUMBER OF MOTORCYCLISTS KILLED ----------------------------------1427 NUMBER OF BICYCLISTS KILLED -------------------------------------------10 PERCENT OF LICENSED DRIVERS UNDER 25 -------------------------14.9%14.7% PERCENT OF CRASH-INVOLVED SPEEDING DRIVERS UNDER 25 .43.9%40.8% PERCENT OF CRASH-INVOLVED DRINKING DRIVERS UNDER 25 .24.4%28.1% NUMBER OF OCCUPANTS KILLED IN MOTOR VEHICLES ---------7796322905190003 416 MILLION 473 MILLION NUMBER OF REPORTED MOTOR VEHICLE TRAFFIC CRASHES AMOUNT OF MOTOR VEHICLE TRAFFIC CRASH PROPERTY DAMAGE. (EXCLUDES MOPED, MOTORCYCLE, ATV & SNOWMOBILE OCCUPANTS) NUMBER OF OCCUPANTS KILLED IN MOTOR VEHICLES WHO WEREWEARING A SAFETY RESTRAINT -----------------------------------------(EXCLUDES MOPED, MOTORCYCLE, ATV & SNOWMOBILE OCCUPANTS) NUMBER OF UNRESTRAINED OCCUPANTS UNDER 5 YEARS OF AGEIN MOTOR VEHICLE CRASHES WHO WERE KILLED -----------WHO WERE INJURED ----------(EXCLUDES MOPED, MOTORCYCLE, ATV & SNOWMOBILE OCCUPANTS) NUMBER OF UNRESTRAINED OCCUPANTS UNDER 5 YEARS OF AGEWITH CHILD RESTRAINT NOT USED PROPERLY WHO WERE KILLEDWHO WERE INJURED(EXCLUDES MOPED, MOTORCYCLE, ATV & SNOWMOBILE OCCUPANTS) ECONOMIC LOSS FROM MOTOR VEHICLE TRAFFIC CRASHESSource: SD Department of Public Safety – Office of Accident Records2
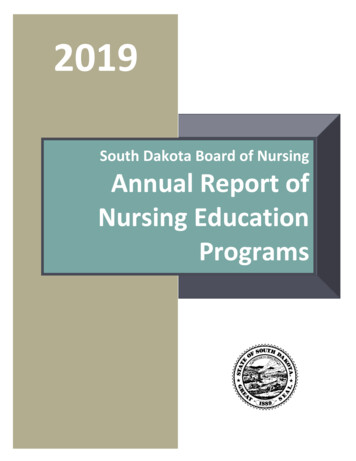
II. HISTORICAL TRENDSMotor Vehicle CrashesThe preliminary death rates per 100 million vehicle miles traveled from 2010-2019 for SouthDakota, states surrounding South Dakota and the nation are shown in TABLE 2-1.FIGURE 2-1 compares South Dakota with the national rate and two comparable rural states,North Dakota and Wyoming.TABLE 2-1FATALITY RATE COMPARISON2010-2019StateSouth DakotaIowaMinnesotaMontanaNebraskaNorth 1Note: Death Rate is the number of traffic fatalities per 100 million vehicle miles traveled.Source: National Highway Traffic Safety Administration (NHTSA) – Fatality Analysis Reporting System (FARS)3
TABLE 2-2 provides a yearly comparison of South Dakota's motor vehicle traffic crashes from 1991through 2020. Any comparison of motor vehicle crashes must be made with caution due to thechanges in the definition of a reportable crash. For example, in the late 1970's the definition of afatality caused by a motor vehicle crash was changed from the death occurring up to one year afterthe crash to death occurring within 30 days after the crash. Using vehicle miles of travel, the 2020death rate increased to 1.45, a 41.2% increase from the 2019 death rate of 1.03. The 4,462 peopleinjured in crashes are a 8.4% decrease from the 4,872 in 2019 (see TABLE 2-2).TABLE 2-2SOUTH DAKOTA YEARLY COMPARISONOF MOTOR VEHICLE TRAFFIC FATALITIES, INJURIES,CRASHES, MILES TRAVELED, & REGISTERED MOTOR 6,65314,151Miles3Traveled ,9099,703RegisteredMotorVehicles5 1,1891,197FOOTNOTES1Number of deaths per 100 million vehicle miles traveled.2July 1, 1978 the PDO threshold was increased to 400 accumulated property damage.July 1, 1986 the PDO threshold definition changed to 500 damage to any one person's property or 1000 accumulatedproperty damage per crash.July 1, 2000 the PDO threshold definition changed to 1,000 damage to any one person's property or 2,000 accumulatedproperty damage per crash.4
3Miles traveled from years 1980 through 1991 have been revised to agree with the Highway Performance Monitoring System's(HPMS) miles traveled. The revised travel was provided by Data Inventory of the SD Department of Transportation.4Number of crashes per 100 million vehicle miles traveled.5Based on statutory changes primarily impacting SDCL 32-5-2.7 in 2008, a vehicle plate can be effective on morethan one vehicle per year due to vehicle replacement. Thus, the registration count may be lower than past yearsdata based on previous plate registration staying with the vehicle.Source: SD Department of Public Safety – Office of Accident RecordsSD Department of Transportation – Inventory ManagementSD Department of Revenue – Titles and Registration5
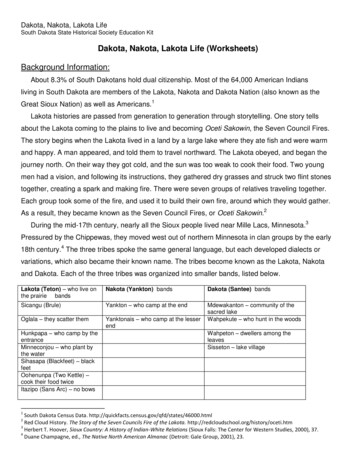
Alcohol InvolvementWhen comparing records dating back to 1979, 29.7% alcohol involved fatal crashes for 2011 is the lowest.Of the 141 traffic fatalities during 2020, 51 or 36.2% were alcohol related (see Table 2-3).Alcohol statistics dating back to the 1970's show 2019 to have the lowest number of alcohol related fatalitiesfor any one-year period (28). The highest number is 138 for the year of 1973.TABLE 2-3ALCOHOL INVOLVED CRASHES AS PERCENT OF ALL CRASHES2014-2020201420152016201720182019Total 032)(1001)(1057)20206.3%(1115)Fatal 5)30.7%(27)37.1%(49)Injury 2%(404)11.3%(414)13.8%(456)PDO )11.3%(552)14.5%(645)NOTE: Alcohol involvement for Fatal Crashes is based upon a positive BAC result and /or indication of alcohol use by at least onedriver, pedestrian or bicycle driver as reported by the investigating officer. For Injury and Property Damage Crashes – It is based uponindication of alcohol use by at least one driver, pedestrian or bicycle driver as reported by the investigating officer.TABLE 2-3APERSONS KILLED IN ALCOHOL INVOLVED CRASHES BY AGE2014-2020AGE20142015201620172018201920200 - 56 - 1213 - 192021 - 2930 - 3940 - 4950 - 5960 & OLDERUnknown/Not 9542851Source: SD Department of Public Safety: Office of Accident Records6
7
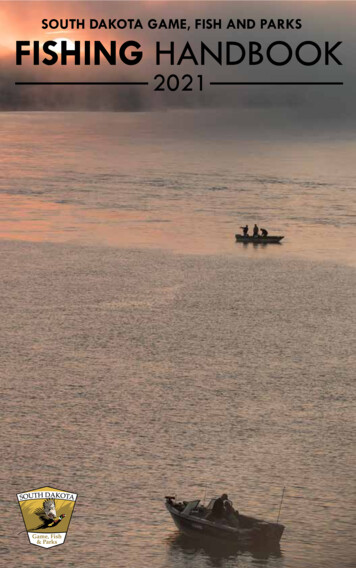
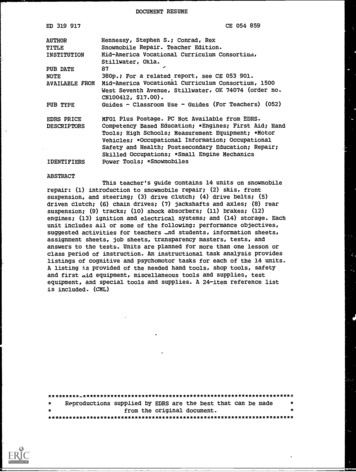
The following crash and arrest data is presented to monitor changes in alcohol-related fataland injury crashes and to compare changes with non-alcohol related crash experiences (seeTABLE 2-4). Alcohol-related fatal and injury crashes increased by 14.5% while non-alcoholrelated fatal and injury crashes decreased by 10.7% from the 2019 totals.The number of DWI arrests decreased by 2.4% from 2019.TABLE 2-4CRASH AND ARREST ACTIVITY2010- TAL 37844481417447564566456527614983FATAL & INJURY 424493,2734413,2975052,943DWI 10,61910,28910,040DWI 448,0577,4357,423Note: [1] – Based on South Dakota Courts - The State of the Judiciary and Fiscal Year 2020 Annual Report of theS. D. Unified Judicial System - Based on Fiscal Year statistics.DWI Convictions are guilty pleas, plus suspended impositions, plus convictions at trial.FIGURE 2-4 presents the annual counts of DWI arrests, alcohol related fatal and injury crashes,and non-alcohol related fatal and injury crashes from 2010 through 2020.FIGURE 2-5 presents the alcohol related and non-alcohol related fatal crash experience for theyears of 2010 through 2020.There were 49 alcohol related fatal crashes during 2020, which compares to 27 in 2019. Theprevious three-year average was 39 for the years of 2017-2019.There were 505 alcohol related fatal and injury crashes during 2020, which compares to 441 in2019. The previous three-year average was 467 or an 8.1 percent increase in 2020.Non-alcohol related fatal and injury crashes in 2020 decreased (10.7%) when compared to 2019and decreased 12.7 percent from the previous three-year average (2017-2019).There were 10,040 DWI arrests in fiscal year 2020. This level has gone down 4.1% from theprevious three-year average (2017-2019). There were 7,423 DWI convictions in fiscal year 2020.This level has gone down 3.3% from the previous 3-year average (2017-2019).8
9
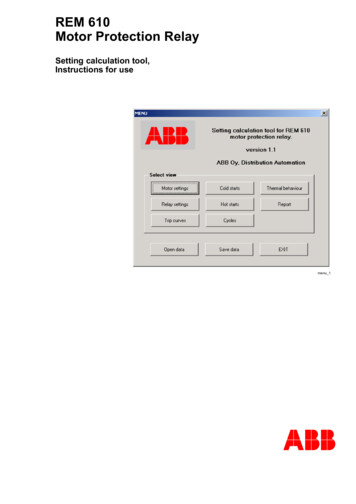
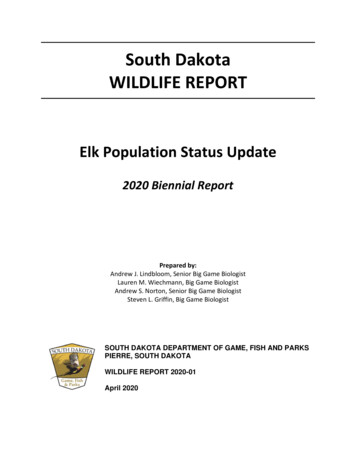
Safety Restraint Usage, Ejection and Child InjuriesFront seat occupants have been required to be fastened by a safety belt system since 1995. The use of safetyequipment is reported for all motor vehicle drivers and only those passengers that are injured. Sixty occupantswere killed while not wearing any safety restraint, while twenty-nine occupants killed were wearing a lap belt,shoulder harness or both. (See TABLE 2-5)Forty-four (45.8%) of the 96 killed occupants were either partially or totally ejected from the vehicle.(See TABLE 2-5B)TABLE 2-5 SAFETY RESTRAINT USAGE – KILLED OCCUPANTS201520162017201820192020No Safety Equipment605867Lap Belt Only1214110310046010280077796Shoulder Harness Only110Lap Belt & Shoulder Harness261822Child Restraint Used Properly001Child Restraint Not Properly Used000Other, Not Stated or Unknown7410611028216TOTAL958310199TABLE 2-5A SAFETY RESTRAINT USAGE – INJURED 294500Other, Not Stated or ,6734,4974,6514,4224,2863,797No Safety EquipmentLap Belt OnlyShoulder Harness OnlyLap Belt & Shoulder HarnessChild Restraint Used ProperlyChild Restraint Not Properly UsedNOTE: Motor vehicle drivers and passengers are considered occupants.Drivers & Passengers of motorcycles, moped, ATVs and snowmobiles are not counted in the above table 2-5 & 2-5ATABLE 2-5B KILLED & INJURED MOTOR VEHICLE OCCUPANTS BY EJECTION STATUS(Excludes Motorcycle, Mopeds, ATVs and 3124,2012014155118491709260123,666159518Partial Ejection37964Total Ejection3436314126Unknown Ejection1010152638016172713Not 4,6514,4224,2863,797Not EjectedSource: SD Department of Public Safety: Office of Accident Records10
11
The Child Passenger Restraint System (SDCL 32-37) law took effect on July 1, 1984 - since that timethere have been 76 deaths to occupants of this age group. Of these deaths only 10 were reported tohave been restrained by a child safety restraint properly used, six were restrained by a lap beltonly. No deaths have been reported where a lap and shoulder harness was used to restrain the child.There was one reported fatal injury to a motor vehicle occupant from birth through four years of ageduring 2020, which compares to zero fatalities during 2019 (see TABLE 2-6).There were 25 children (birth through 4 years old) injured in 2020, which compares to 46 for 2019.Sixteen of the 25 injured children were restrained by either a lap belt and shoulder harness or a childsafety restraint used properly (see TABLE 2-6A).TABLE 2-6FATALITIES & INJURIES TO MOTOR VEHICLE OCCUPANTSUNDER 5 YEARS OF TALINJURIES8366757555486353664625NOTE: Table includes passengers of Motor Vehicles not normally equipped with safety restraints.TABLE 2-6AFATALITIES & INJURIES TO MOTOR VEHICLE OCCUPANTS UNDER 5 YEARS OLDBY SAFETY EQUIPMENT USAGE - 2020Fatalities1000000No Safety Equipment UsedLap Belt OnlyShoulder Harness OnlyLap Belt & Shoulder HarnessChild Restraint Used ProperlyChild Restraint Not Used ProperlyOther, Not Stated or UnknownTOTAL1Source: SD Department of Public Safety - Office of Accident Records12Injuries6006103025
Cycle and Pedestrian CrashesThe following tables provide a yearly comparison of South Dakota's motorcycle, pedestrian,and bicycle crashes, injuries, and fatalities. During the past 10 years, the average number ofmotorcycle-involved crashes is 471 and 20 deaths per year. Licensed motorcyclists increased0.3 percent during 2020 while fatalities increased to 27 (see Table 2-7).Moped crashes are included with motorcycle crashes. There were no moped fatalities during2020. Over the years there have been five moped fatalities and the number of injuries is small.See pages 46-51 for additional motorcycle, pedestrian, and bicycle crash information.TABLE 2-7MOTORCYCLE CRASHES2000 - le istsFatalities 3631432127445Source: SD Department of Public Safety – Office of Accident RecordsSD Department of Public Safety – Driver Licensing ProgramSD Department of Revenue – Division of Motor 91,579
THIS PAGE INTENTIONALLY LEFT BLANK14
TABLE 2-8PEDESTRIAN FATALITIES AND INJURIES2000 - : SD Department of Public Safety – Office of Accident RecordsTABLE 2-9BICYCLE FATALITIES AND INJURIES2000 - 110398105881108777907369807441Source: SD Department of Public Safety – Office of Accident Records15
Holiday CountsTABLE 2-10 provides a yearly comparison of South Dakota motor vehicle crash experience duringmajor holiday observances. These counts are nationally observed and frequently requested.TABLE 2-10CRASHES DURING HOLIDAYS2011- 2394439MEMORIAL DAY2011201220132014201520162017201820192020FOURTH OF JULY2011201220132014201520162017201820192020LABOR DAY201120122013201420152016201720182019202016
HolidayTotalHoursTotalCrashesF
The preliminary death rates per 100 million vehicle miles traveled from 2010-2019 for South Dakota, states surrounding South Dakota and the nation are shown in TABLE 2-1. FIGURE 2-1 compares South Dakot