Transcription
Datalab SeminarIntroduction to D3.jsInteractive Data Visualization in the Web BrowserDr. Philipp AckermannSample Code: ab/CGdemosZürcher Fachhochschule 2016 InIT/ZHAWVisual Computing LabData Visualization Converting raw data to a form that is viewable andunderstandable to humans– Transform the symbolic to the geometric– Make the obvious and the hidden/abstract observable Interactive exploration– Drill-down– Dynamic mapping Gaining insight by interactive exploration anddynamic simulation– Amplify cognition (by creating a mental image)– Visual thinking (high bandwidth, pattern recognition, .)Zürcher Fachhochschule2
Data VisualizationA picture is worth more than a thousand words(An ancient Chinese proverb)Tell me and I will forget Show me and I may remember Involve me and I will understand.(Another ancient Chinese proverb)à Interactive information visualization is a great toolfor fostering involvement and understandingZürcher Fachhochschule3Data Visualization Information Visualization– Abstract representation– Discrete data Scientific Visualization– Artefacts with well-defined 2D/3D representation in reality– Continuous data (e.g., computational fluid dynamics, weather models)Zürcher Fachhochschule4
InfoVis and Big Data / Open Data More and more data produced More and more open data– opendata.ch http://opendata.ch Importance of visualizing this data Narrative information visualization Data-driven journalism– The New York -from-the-new-york-times-data-visualizations/– The � Neue Zürcher Zeitunghttp://nzz.ch/dataZürcher Fachhochschule5D3.js A JavaScript library for creating data visualization– Transformation of data into interactive visualizations– A kind of clever "jQuery for SVG“– Developed by Mike Bostock(while @ Standford, now @ New York Times) Based on standard Web technology–––––HTMLCSSJSSVGDOMZürcher FachhochschuleHypertext Markup LanguageCascading Style SheetsJavaScriptScalable Vector GraphicsThe Document Object Model6
D3.js Features Solves the fundamental problem of data visualisation– Creates SVG (or HTML) DOM elements– Manipulates the DOM with data– Supports differential data update Fast, simple and efficientSupport for animations and transitionsA lot of existing chart/graph layoutsModularity– Extensions with functions and plugins Active community supportZürcher Fachhochschule7Data in d3.js Data are arrays––––Array of numbersArray of objectsArray of arrays (matrix)Use JavaScript‘s built-in array methodsarray.{filter,map,sort, } JSON– Embed JSON data– Loading JSON data Loading Comma-Separated Values (CSV) Loading XML data using XMLHttpRequestZürcher Fachhochschule8
Selection & Manipulation Selectors to simplify DOM access– Similar to jQuery (but not the same) d3.selectAll(“div“) Compared to jQuery: (“div“)– Result is an arrayd3.selectAll("circle"); Method chaining– Shorter (and more readable) coded3.selectAll("circle").attr("cx", 20).attr("cy", 15).attr("r", 5).style("fill", "red");Zürcher Fachhochschule9Data Binding Select elements and join with data– Pairs a data object and a visual elementvar myData{x: 2.0,{x: 3.0,{x: 5.0,{x: 8.0,{x: 9.0,]; [y: 9.4},y: 8.1},y: 8.4},y: 8.7},y: ppend("circle").attr("cx", x).attr("cy", y).attr("r", 5).style("fill", "red"); Generation of visual elements.enter().append() Set properties using functions of data– Attributes (and styles) control position and appearanceZürcher Fachhochschule10
Data Binding Join cycle: enter, update & exit– Keeps track of new and old objects– Lets you animate differences between new & old data– Keeps existing layout stable enter()– Generate new visual element update()enterupdateexit– Update values of existing elements exit()– Remove visual element– Can be done with transitionDataVisualsZürcher Fachhochschule11Scales Scales are functions that map from an input domainto an output range– Input is data-driven– Output range controls visual properties Scale types––––––Ordinal scaleLinear scaleLog scalePower scaleTime rangeColor categoriesZürcher Fachhochschulevar x d3.scale.ordinal().domain(["A", "B", "C", "D"]).rangePoints([0, 720]);x("B"); // 24012
Scales Linear scale samplesvar s d3.scale.linear().domain([0, 1]).range([-10, 10])s(0) // -10s(0.5) // 0 var cs d3.scale.linear().domain([0, 1]).range(['white', 'red'])cs(0) // '#ffffff'cs(1) // '#ff0000‘var data [31, 22, 50, 36, 80, 42];var x d3.scale.linear().domain([20, d3.max(data)]).range([0, 120]);Zürcher Fachhochschule13Axes Labeling of scales– Create an axis for a given scalevar xAxis d3.svg.axis().scale(x).orient(“right");– Add the axis by creating a g group element svg.append("g").attr("class", “x axis").call(xAxis);– Customize axis appearance via CSS and by Ticks.axis path, .axis line {fill: none;stroke: #000;shape-rendering: crispEdges;}Zürcher Fachhochschulevar axis d3.svg.axis().tickSize(10,0);14
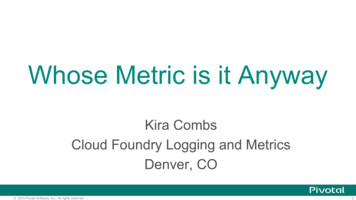
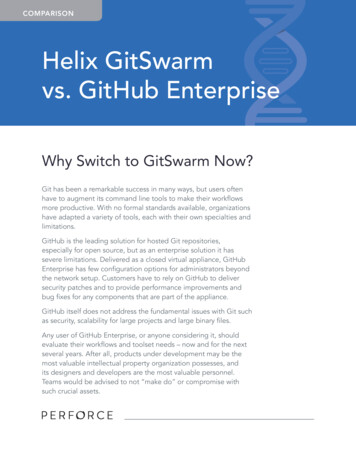
Let‘s Make a Bar Chart By generatingHTML div elements./Demos/d3js/A01 Bar htmlDIVs.html By generatingSVG rect elementsand axes./Demos/d3js/A02 Bar chart.htmlZürcher Fachhochschule15Layouts Layouts do transform data to visual elements– They do not draw, they make the data uplift by generating,positioning, and sizing visual elements Predefined ionPieStackTreeTreemapWorld cloud. See r Fachhochschule16
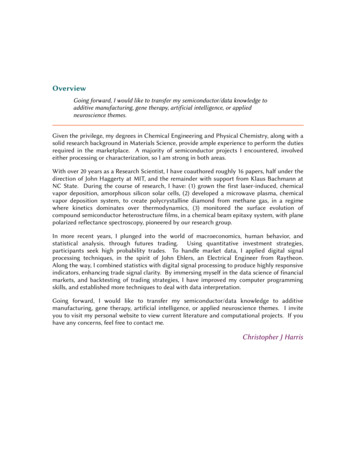
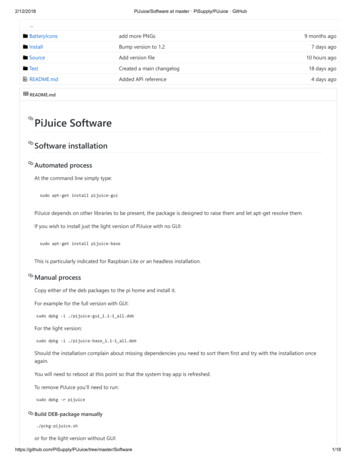
Let‘s Make a Pie Chart By using a d3.js pie layout– d3.csv Load and parse data– d3.scale.ordinal Color encoding– d3.svg.arc Generate arc elements– d3.layout.pie Compute arc angles from data./Demos/d3js/A03 Pie chart.htmlZürcher Fachhochschule17Transitions and Interactions Make your charts change smoothly– Data changes become animated– Smooth movements– Fade-in / fade-out Add event handlers to generated SVG elements–––––On over à TooltipsOn click à Follow URL linkOn dblclick à Drill-downOn drag à Move / rearrange.Zürcher Fachhochschule18
Let‘s Visualize a Network Graph Using directional force layout– Dynamic network layout Nodes as circles Links as curved arrows– Event handlers Click Dblclick Drag– Transition Node resizing./Demos/d3js/A04 Network graph.htmlZürcher Fachhochschule19Geographical Maps GeoJSON– Maps geographic data to SVG polygon elements TopoJSON– Borders are stitched together from segments called arcs– Arcs are shared by borders à compact data Many different geo projections in d3.geo.js availableZürcher Fachhochschule20
Let‘s Create a Swiss Map By using d3.topojson.js./Demos/d3js/A05 Swiss map.htmlZürcher Fachhochschule21Example: Visualize content from DB Cron job: PHP script to daily save value in DB PHP script to provide DB records as JSON HTML/D3.js code for data graphicsZürcher Fachhochschule22
Example: Visualize content from DB PHP script to provide DB records as JSON ?phpinclude once('dbconfi.php'); db mysqli connect( dbServer, dbUser, dbPW, dbName); query "SELECT * FROM imgstats WHERE 1"; sqlResult mysqli query( db, query); result array(); cnt mysqli num rows( sqlResult);while ( row sqlResult- fetch assoc()) { result[] row;}header('Content-type: application/json; charset utf-8');echo json encode( result);mysqli close( db);Zürcher Fachhochschule23Example: Visualize content from DB HTML/D3.js code to get data via JSON h1 Amount of files on Metason server /h2 script src "http://d3js.org/d3.v3.min.js" charset "utf-8" script script .var parseDate d3.time.format("%Y-%m-%d").parse;var x d3.time.scale().range([0, width]);var y d3.scale.linear().range([height, 0]);.d3.json("getstats.php", function (error, data) {data.forEach(function (d) {d.day parseDate(d.day);d.portraitfiles d.portraitfiles;});x.domain(d3.extent(data, function (d) {return d.day;}));y.domain([0, d3.max(data, function (d) {return d.portraitfiles;})]);. /script Zürcher Fachhochschule24
Student Project: eHealth Info Vis Interactive Web Graphics– Access to Open Data of public health information– Web-based information visualization based on D3.js– http://www.visualcomputinglab.ch/healthvisZürcher FachhochschuleInformation Visualization Example Combinemultiple &linked views Temporalfiltering &animation /India Arie.htmlZürcher Fachhochschule26
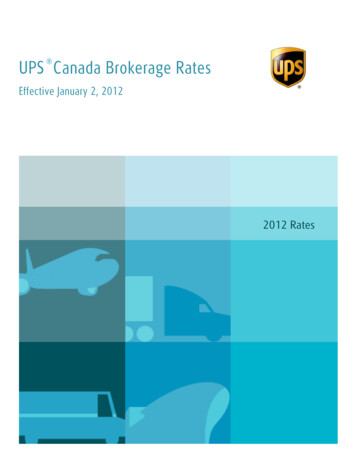
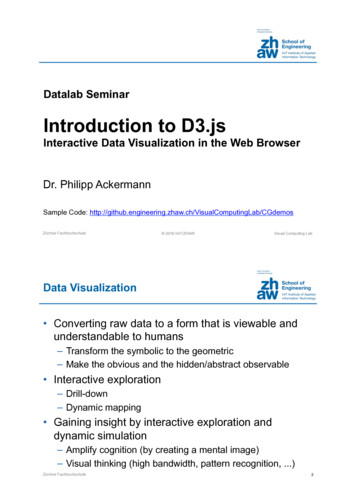
A Typical d3.js Application Data Flow– Import of raw data Optional: Data pre processingraw datainteractivefilteringselection– Data filteringanimatedselectionfiltered data By user interaction By animation (timer)prep– Visual mapping Preperation for visualization– Chart-specific data arrays– Calculate scales and axes Several parallel charts– Main chart– Side chartsZürcher Fachhochschulechart data 1mainchartchart data 2chartchartdatadata22sidecharts27Information Visualization Samples Try out great samples of Info Vis based on 4-17/how-americans-die.htmlwww.cs.umd.edu/ .com/mbostock/d3/wiki/GalleryZürcher Fachhochschule28
Dive Deeper Learning by doing––––Checkout d3.js Web site www.d3js.orgUse existing tutorials https://github.com/mbostock/d3/wiki/TutorialsTake small stepsLearn from examples Study d3.js visualization samples– https://github.com/mbostock/d3/wiki/Gallery– http://bl.ocks.org/mbostock– .Zürcher Fachhochschule29Types of Data Visualizationß Continuum àData GraphicsInformation VisualizationNarrative VisualizationStatistics Information Architecture StorytellingStatic Presentation Interaction AnimationZürcher Fachhochschule30
Visual Data Mining Visual Data Mining– Use of visual tools for data exploration Interactive exploration– Interplay of human and machine intelligence– Interaction LoopMachine processingVisual pattern recognition– Best of both worlds Machine speed Human perception & interpretationZürcher Fachhochschule31Recommended ReadingPDF: http://portal.acm.org/ft gateway.cfm?id 1805128&type pdfHTML: http://queue.acm.org/detail.cfm?id 1805128Zürcher Fachhochschule32
Recommended ReadingZürcher Fachhochschule33
Data Visualization Information Visualization – Abstract representation – Discrete data Scientific Visualization – Artefacts with well-defined 2D/3D representation in reality – Continuous data