Transcription
Introduction to GIS
Víctor OlayaIntroduction to GISForeword by Gretchen Peterson
Introduction to GISText: Copyright 2018 Víctor OlayaForeword: Copyright 2018 Gretchen PetersonCover Image: The Art Journal The Industry of All Nations Illustrated Catalogue(London, England: Bradbury and Evans, 1851)Last update: June 13, 2018This book is distributed under a Creative Commons Attribution license.
ForewordI first met Victor when we were working at the same company. During that time I learned a few interesting thingsabout him. Like how he works at such a rapid pace that ifyou blink you might find that he’s written a new plugin forQGIS or even that he’s written a book like this one. Asidefrom these great qualities, the thing I most remember abouthim is that he helped direct me to the last packet of hotchocolate in the office kitchen, after a day full of meetingswhen I needed it the most. It’s helpful things like thatwhich make a difference to people. And in this book youwill find so many helpful things, akin to that hot chocolatebut for Geographic Information Systems (GIS), organizedin a thoughtful manner which will help you get throughthat sometimes-long GIS slog.This book is an excellent reference text regarding thehistory and basics of GIS. It includes clear examples ofconcepts illustrating choices the geospatial professionalmust make in design and layout and how those choicesaffect a map product. The reader can literally see howdecisions about line, color, shape, and other qualities willrender a map that is the most useful and the most aesthetic.It also includes important information about the variousv
ways in which GIS data is obtained, how it is stored, and agreat overview of GIS software.The book begins with the history of GIS and proceedsinto sections that discuss and define such topics as spatialanalysis, data visualization, web mapping and data sources,among many others. I envision the book being used as ateaching tool, both in a formal setting and for self-learners.Additionally, for more experienced geospatial professionals, this book can be used in the initial ideation phase ofcreating a map, reminding us of the elements we need toconsider and prioritize to meet the objectives for a particular map or analysis. It is really a digital pocket guide toGIS.Victor is generously making his book available to all,free, for users. Knowing the hours of work that go into anybook, I appreciate his attitude of community and contribution to the field of GIS. Learning and continually revisitingthe fundamentals is paramount for success in our field. Sopour yourself a good cup of hot chocolate and get started.Gretchen PetersonCo-author of QGIS Map Design
PrologueWhen in 2005 I started writing my book “Sistemas de Información Geográfica”, I did it for two reasons: first, becauseno books on GIS theory had been published in Spanishsince the early 90’s; second, because there were no freebooks about GIS, except those related to free GIS software,which included little theoretical content.It took me five years to write the book, which ended upbeing a complete reference book with almost a thousandpages. Knowing that its size and its level of detail could beintimidating, and that many people would prefer a shorterversion, in 2015, I wrote “Introducción a los SIG”. Thebook you are reading now is the English translation of thatshorter work.Unlike what happens in Spanish, there are many goodbooks on GIS theory written in English, and new editionsare published constantly to update them with the latestchanges in the field of GIS. However, no free book (that is,no book that can be freely copied, printed and distributed)on this topic had been published yet.I believe this book will be of great use for current GISusers and for anyone wanting to start in this fascinatingfield of GIS. If you have any suggestions or comments, youcan contact me at: volayaf@gmail.com.vii
Introduction to GIS
What is GIS?Most of the information that we use nowadays is georeferenced. That is, it is information to which a geographicalposition can be assigned, and it is thus information thathas some ancillary information related to its location.A Geographical Information System (GIS) is a toolto work with georeferenced information. In particular aGIS is a system that allows the following operations: Reading, editing storing, and, generally speaking, managing spatial data. Analyzing those data. This includes everything fromsimple queries to complex models, which can be performed using the spatial component of the data (thelocation of each value or element), the thematic component of the data (the value or element itself), or both. Generating documents such as maps, reports, plots, etc.GIS is a step beyond traditional maps. A map represents a rendering of a set of spatial data, and while thisrendering has great importance within GIS, it is but one ofits many components. GIS includes not only data and theirrendering, but also all the operations that can be performedon them which are part of the system, also.1
GIS is a flexible and versatile tool and most disciplinestoday use GIS in one way or another. One of the mainreasons for this is the integrative nature of GIS. The following are some of the main contexts in which GIS playsthis integrative role. GIS as a tool to integrate information. A commonlink between most disciplines is that they study something which can be located. This allows for combiningand getting results from a joint analysis. In this context,GIS provides the framework on which information fromdifferent disciplines can be added and we can work withit. GIS as a tool to integrate technologies. A large partof the technologies that have appeared in the last severalyears (and most likely those that will appear in the nearfuture) are based on using spatial information and areconnected to some extent to GIS to extend their capabilities and their reach. Due to its central position in thisgroup of technologies, GIS plays an important role inlinking them and allowing them to communicate aroundits own functionalities. GIS as a tool to integrate technologies. GIS functionalities cover a broad range of users, most of whom wouldnot have such a well-defined framework if it were notfor GIS itself. Consequently, there is better coordinationamong them. GIS as a tool to integrate theoretical areas. We canunderstand GIS as the sum of two disciplines: geographyand computer science. However, a more detailed analysis reveals that GIS incorporates elements from manydifferent scientific fields, such as those related to technology and data management (computer science, databasedesign, digital image analysis), those that study the Earthfrom a physical point of view (geology, oceanography,2
ecology) or from a social and human one (anthropology,geography, sociology), those that study human behaviorand understanding (psychology), or those that have themselves traditionally integrated knowledge from differentfields, such as the already mentioned geography.The term geomatics, derived from geography and informatics, frequently refers to the array of scientific areasrelated to GIS.Therefore, we see that GIS integrates technology, informatics, people and geographical information, of whichthe main purpose is to capture, analyze, store, edit andvisualize georeferenced data.From a different point of view, a GIS can be consideredas composed of five main elements: Data. Data is needed for the rest of the components tomake sense and be able to serve a given purpose. Geographical information, the core of GIS, lives in the data,and a detailed knowledge of the data that we use, itsquality, its origin, its characteristics, and how to manageand store it is paramount to correctly understand GISitself. Analysis. Analysis is one of the main strengths of GIS,and one of the reasons why the first GIS were developed. Most GIS include analysis capabilities. They include methods that were already used with traditionalcartography, others that existed but were not feasible touse without computers, and new approaches that weredeveloped specifically after GIS appeared. Visualization. All types of information can be represented graphically which makes it easier to interpret it.In the particular case of geographical information, visualizing it is not only a different way of working with that3
information, but indeed the main one, since it is the oneto which we are more accustomed.While maps are graphical entities, in GIS, we work withraw alphanumeric data. In order to have the same capabilities of a printed map, GIS must be able to createvisual representations from that data, including map-likeones. The same cartographic principles that apply whendesigning a printed map are also valid when renderinggeographic data within GIS, and GIS users must be familiar with them. Technology. This includes both the GIS software andthe hardware that runs it. Additional elements that arecommon when working with GIS data, such as peripherals used for entering data or for creating printed cartography, are included here. Organization. This includes the elements that ensure aproper coordination between people, data and technology. As GIS gets more complex, managing the relationsamong its elements becomes more important.In the following chapters, we will describe these elements in detail.
History of GISGIS has experienced a huge development since its earlydays. With the popularization of GIS technologies, andthanks to the help of all other disciplines that use GIS andrely on it, the field of GIS has been redefined and expanded,especially in the last years.We can locate the origins of GIS in the sixties, whenthe first GIS applications appeared. The two main reasonsfor this were the increasing need of geographical information and the appearance of the first computers.The theoretical foundation of GIS was laid a few yearsbefore, with the development of new approaches in thefield of cartography, such as quantitative cartography,which seemed to predict the future needs that the use ofcomputers and geographical data would bring.The first relevant experience that combined computersand geography can be found in 1959, when Waldo Toblerdefined the principles of a system called MIMO (map in–map out), with the purpose of applying computers to thefield of cartography. He defined the basic ideas for creating, encoding, analyzing, and rendering geographical datawithin a computer system.5
The first GIS was the CGIS (Canadian GeographicalInformation System). It was developed in Canada in theearly sixties by Roger Tomlinson, who is popularly knownas the “father of GIS”.In the mid-sixties, two applications, SYMAP and GRID,laid out the theoretical foundation for the analysis of rasterand vector data, the two main approaches for encodingand storing geographical information (we will explain themin detail in the upcoming chapters). The main ideas forperforming analysis in raster GIS were defined by DanaTomlin with his map algebra.During the sixties, the field of GIS starts developingitself from those seminal works. GIS is not anymore anexperimental tool, and it starts to become and importantpart of the cartographic world.From this moment, GIS evolves through several different periods, moving very fast thanks to the influence ofmany external factors. This evolution affects the disciplineof GIS itself, the technology it involves, the data, and alsothe theories and techniques it is built on.The evolution of GIS as a disciplineAt first, GIS was just a combination of ideas from quantitative cartography, and the computer systems that existed atthat time. It was basically the work of cartographers andgeographers who tried to adapt their knowledge and theirneeds to a technology that looked promising. Since then, alarge number of other disciplines have contributed to thefield of GIS and their contributions are as important, or insome cases even more so, than those of cartography andgeography.More or less at the same time, society was becomingmore concerned about the environment and the effect of6
human actions on it. This influenced GIS which was becoming a fundamental tool for all tasks related to environmental management (land-use planning, environmentalmonitoring, etc.), and boosted its development.At the beginning of the seventies, once it was clearthat GIS had a great future ahead, the field of GIS startedto shape its identity and to become a solid discipline. Thefirst conferences and symposiums about GIS took placeand GIS was already included in University curricula. Specialized journals and forums appeared in the eighties andhelped spread GIS to a wider audience, The industry of GISconsolidated itself in the seventies. ESRI (EnvironmentalSystems Research Institute), pioneer and current leader ofthe GIS market, was founded is 1969, and its products haveplayed a key role in the popularization of GIS. The firstopen-source GIS, GRASS (Geographic Resources AnalysisSupport System), appeared in 1985.The beginning of the 21st century marks a turningpoint in the history of GIS, as it reaches non-professionalaudiences. Cartography services such as Google Mapsallow users with little or no technical GIS knowledge tointeract with a GIS application and use it. GPS navigators,which include both analysis and rendering capabilities thatcome from GIS, are another good example of this.The evolution of technologyThe evolution of computers has affected GIS. Three are themain areas that have had a major influence in shaping GISas we know it now. Graphical outputs. The capabilities of computers togenerate graphical outputs have greatly improved sincetheir beginnings, and they are still evolving. GIS has7
followed this evolution closely, both for screen renderingand for the case of printed outputs. Data access and storage. The size of GIS datasets hasincreased enormously, and using these large datasetswould not be possible without the corresponding improvements in both data storage and data access. Data input. In the early days of GIS, data were manuallydigitized. Nowadays, creating data that can be used in aGIS is a completely different process, and it uses specifichardware such as high-resolution scanners, or specificsoftware such as the one used for automatic digitalizationof pattern recognition based on images, all of whichgenerate ready-to-use data.Along with this, software has changed following theevolution of computers themselves, from mainframes topersonal computers, and more recently, to other platformssuch as tablets or mobile phones.By the end of the eighties, cartography can be efficiently produced in personal computers, with a comparatively low cost, without the need of expensive and dedicated large mainframes.Nowadays, the combination of positioning systemssuch as GPS with mobile platforms is playing and important role in the development of GIS, in areas such as datacollection.The Internet also changed GIS, much like it changedevery other field, whether scientific or not. In 1993, XeroxPARC, the first map server to distribute cartography overthe Internet, was created. The first digital on-line atlas,the Canadian National Atlas, has been available since 1994.More recently, the ideas of the Web 2.0 are adapted to thefield of GIS and contribute to the development of what isnow known as Web Mapping.8
The evolution of dataThe first geographical datasets used in GIS contained justscanned maps and digitized features obtained from them.Since then, new data sources have been constantly appearing, with formats that are better adapted to GIS, and withGIS itself adapting to them as well. As a consequence ofthat, the amount, precision, and quality of data that is nowavailable to be used in a GIS has dramatically increased.The launching of the first earth observation satellites represents a key advance. The techniques that werealready in use for aerial photography, developed mostlyduring the First World War (although the discipline goesback to the second half of the 19th century, when photoswere taken from hot air balloons), are applied on a globalscale when the first satellites are created. SPOT Image, thefirst commercial company to distribute satellite images thatcover the entire globe, was created in 1982.Positioning technologies are another important datasource for GIS. In 1981, the GPS system became completelyoperative, and in 2001, its accuracy for civil use was increased.As it happened with GIS software, digital geographicaldata becomes more popular and receives more attention. In1976, the United States Geological Service (USGS) publishesits first Digital Elevation Models (DEM), in response tothe high relevance that this type of data now had in thecontext of geographical analysis. In 2000, elevation datafrom the Shuttle Radar Topographic Mission(SRTM) is released to the public, covering 80% of the Earth’s surfacewith a resolution of one arc second (about 30 meters).The development of techniques such as LiDAR, whichcan be used to get elevation data with much more detail,9
opens a large array new possibilities for areas such as terrain analysis.The evolution of data is not just technical, but also social and organizational. As the amount of data increases,it becomes clear that new strategies must be developed formanaging those data. So-called Spatial Data Infrastructures are developed as a result of this. The most relevantof them is the United States National Spatial Data Infrastructure (NSDI), created in 1994. In Europe, the INSPIREdirective serves a similar purpose.Many of these activities and developments follow thespecifications set up by the Open GIS Consortium (OGC),and international consortium founded in 1994, which worksto homogenize and standardize the use and distributionof geographical data.The evolution of theories and techniqesOnce the first GIS was implemented and could respond tothe data management and analysis needs for which theywere created, new techniques and approaches began to bedeveloped.Spatial analysis is a comparatively recent field. In 1854,John Snow performed what is usually considered one ofthe first examples of analytical cartography, when he useda map to determine the source of a cholera outbreak inLondon.In his book Design with Nature (1969), Ian McHargdefined the basic ideas about map overlays, which, aswe will later see, are fundamental for the analysis andvisualization of geographical data layers within a GIS.Terrain analysis is another field that has experienced ahuge qualitative change thanks to GIS. Traditional terrainanalysis, mostly based on geology and geomorphological10
analysis, developed into a quantitative science focused onthe morphometric analysis of relief.Along with the analytical component, cartography alsoevolved in the context of GIS. In 1819, Pierre Charles Dupincreated the fist choropleth map. With the arrival of GIS,this type of map will become very popular.The advances in Computer-Assisted Design (CAD) applications and in-screen rendering techniques helped indefining a new discipline: computational geometry. GISvector analysis is based on it.
Fundamentals of cartography andgeodesySince GIS inherits concepts and ideas previously used tocreate printed maps, it is mandatory to know them in orderto correctly use the tools included in a GIS. The fundamental concepts from cartography and geodesy are themost important ones. Without them, it is not possible tounderstand GIS.Basic concepts of geodesyThe main property of georeferenced information is that ithas a location, and more particularly, a location on theearth. This location is given with coordinates that defineit, which requires a reference system for the coordinates.Geodesy is the science that provides the theoreticalframework for this, and it studies the Earth’s shape. Geodesy, through its different branches, provides methods andconcepts that allow defining and using precise and rigurouscoordinates to locate elements and phenomena that takeplace on Earth.Geodesy is needed due to the fact that the Earth is notflat, and when the area that is studied is large enough, the13
effect of the Earth’s curvature cannot be ignored. For thisreason, GIS implement the required elements to managegeographical information, taking into account the ideasand principles of geodesy.One of the main purposes of geodesy is to establisha reference system and define a set of points (known asgeodesic vertices), whose position is know with a highlevel of accuracy. Based on those points, which forma geodesic network, coordinates for any point on theEarth’s surface can be computed.Reference surfacesTo accomplish this, geodesy defines two basic referencesurfaces: reference ellipsoid and geoid.Earth has a spherical shape. However, it is not a perfectsphere, but is instead what is called an ellipsoid. In anellipsoid, the radius is not constant and depends on thelocation over its surface. Using an ellipsoid to define theEarth’s shape is more precise than assuming it has a spherical shape, and is needed to create accurate cartography,especially when the represented surface is not too large.The ellipsoid provides a theoretical expression of theEarth’s shape, and the next step is to determine the parameters that define it. In the case of a sphere, the onlyparameter needed is the radius. In the case of an ellipsoid, two parameters have to be determined: the length ofsemi-major and semi-minor axis.For historical reasons, many ellipsoids exist, all of themderived from the work of geodesists in different times andplaces. The first general ellipsoids, which can be used forrepresenting any place on Earth’s surface, appeared aproximately a hundred years ago, created as an international14
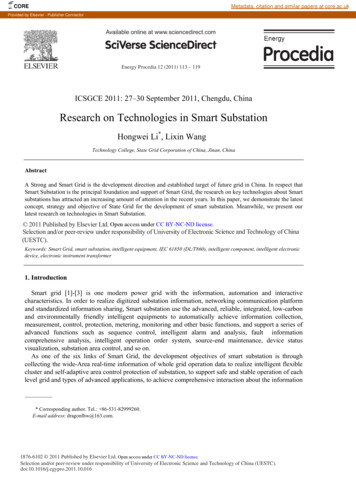
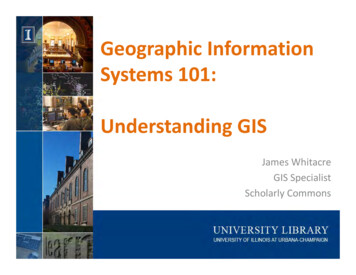
Earth's surfaceEllipsoidGeoidFigure 3.1: Comparison of the three fundamental surfaces:Earth’s surface, geoid and ellipsoid.(Adapted from Wikipedia).reference that can be used for creating cartography in different areas of our planet. The WGS–84 ellipsoid is oneof the most popular currently, and it is used by the GPSpositioning system.The other reference surface is the geoid, defined as thethree-dimensional surface where every point have the samegravitational attraction. It is an equipotential surface thatresults from assuming average ocean levels and extendingthem under the Earth’s surface.As in the case of ellipsoids, there are several geoids aswell. These are not constant and evolve to adapt to thechanges that take place on the Earth’s surface.Figure 3.1 shows a comparison of the three surfaces:Earth’s surface, geoid and ellipsoid.In a general ellipsoid, both the location of it centerof gravity and its equatorial plane match those of the Earth.In a local ellipsoid, this does not have to be true, and theellipsoid by itself is not enough, since we do not know howto place it relative to the real Earth’s surface.The concept of datum solves this problem. A datumis the combination of a reference surface (the ellipsoid)and a point in which it is linked to the geoid. That point iscalled the fundamental point, and the ellipsoid is tangent15
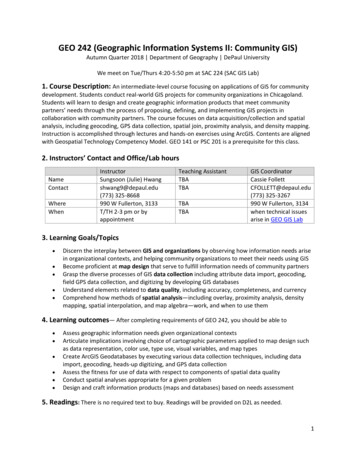
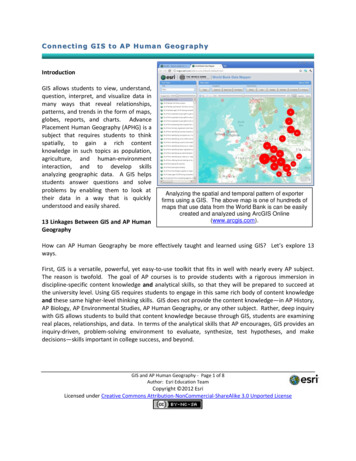
to the geoid there. At the fundamental point, a line perpendicular to the geoid is identical to a line perpendicular tothe ellipsoid.Coordinate reference systemsOnce we have a model to define the Earth’s shape, we canestablish a system to code any position over its surface andasign a corresponding coordinate to it. The combinationof a coordinate system and a datum is called a coordinatereference system (CRS).Regarding the coordinate system, we have two mainalternatives: using the elements of spherical geometryusing the concepts of plane geometry. In the latter, weneed a projection system to place the elements on thesurface of the ellipsoid into a plane.Geographical coordinates use a spherical coordinatessystem in which the location of every point is definedby two angular values: latitude and longitude. Lines ofequal latitude are called parallels, while lines of equallongitude are called meridians.Geographical coordinates are of great utility, especiallywhen working with large regions. However, it is not a cartesian system, and it is difficult to perform tasks such asmeasuring distances or areas. To simplify operationslike those, we need cartesian coordinates. To assign a planecoordinate to every point on te Earth’s surface (which isnot a plane), we must use a cartographic projection.Earth’s surface is not developable. That is, it cannotbe flattened without distortion. For this reason, we needa methodology for converting points on this surface intopoints on a plane. Figure 3.2 shows this idea.In the case depicted in the figure, point are projecteddirectly onto the plane. Another alternative is to project16
Flat surfaceABaEllipsoidsurfacebcCFigure 3.2: Graphical explanation of a projection. Points A, Band C on the surface of the ellipsoid are converteed into theirequivalent points a, b and c on a plane.them onto a surface that, unlike the surface defined by asphere or an ellipsoid, can be developed (that is, it can beflattened later without distortion). The most usual surfacesfor that are the cylinder and the cone. The correspondingprojections are called conical projections and cylindrical projections.It can be seen in the figure that projecting points introduces distortions. For instance, the distance betweenpoints A and B is not the same as the distance betweenpoints a and b. All projections introduce some sort of distorsion, regardless of their properties. Depending on themetric properties that are preserved undistorted, we haveequal-area projections (which preserve area), conformal (preserve angles and shapes) o equidistant (preservedistances).Depending on the context and the purpose of our data,we might use one or another type of projection.One of the most widespread projections nowadays isthe Universal Transverse Mercator, which is the basisfor the UTM coordinate system. This system is not just a17
projection, but a complete system of many of them. Earth’ssurface is divided in rectangular regions, and for each ofthem a different projection and a different set of geodeticalparameters are used. It uses a single ellipsoid: WGS-84.In the UTM system, coordinate are not expressed asabsolute coordinates, but instead the are refered to thecorresponding rectangle, as relatives coordinates within it.The UTM grid contains 60 zones, each 6 of longitudein with. Zone 1 is locateed between 180 and 174 West, andnumbering increases eastward.Each zone is segmented into 20 latitude bands, rangingfrom 80 South to 84 North. These are coded with lettersfrom C to X, excluding I and O due to their similarity tothe numerals one and zero. Each band has 8 of latitude inheight, except the X band, which has 12.A UTM rectangle is therefore defined by a numberand a letter, and the coordinates that are used to locatea given point on the Earth’s surface are referred to thezone to which it belongs. Coordinates are expressed inmeters and represent the distance between the point andthe origin of the UTM rectangle. The origin is located atthe intersection between the meridian passing through thecenter of the zone and the equator.To avoid negative numbers, the origin is assumed tohave and X coordinate of 500000 meters and a Y coordinateof 10000000 meters, causing all coordinates referred to itto have only positive values.Coordinate conversion and transformationIt is common when working with GIS to have layers inseveral different coordinate systems, or in the samecoordinate system but using different parameters (such asa different datum). In order to be able to use those layers18
together, we have to work in a single coordinate systems,and at least some of those layers will have to be convertedto it. That is known as coordinate conversion. If theorigin and destination coordinate systems have a differentdatum, coordinate conversion is called coordinate transformation.In a GIS, conversion and transformation capabilitiesallow to generate new layers that use a different CRS. Also,GIS include the ability to perform them on-the-fly whenlayers are rendered, so we can create a map with layers thatdo not share the same CRS. These are correctly representedon the map and “match” one with another, since the GISis automatically performing the corresponding changes totheir coordinates to have them in a common CRS.To facilitate the use of coordinate reference systems,there are initiatives that organize and code them so eachsystem can be easily identified by a unique code, (called aSpatial Reference System Identifier (SRID)). The mostcommon coding system is the one created by the EuropeanPetroleum Survey group (EPSG).Basic cartographic conceptsAmong the fundamental concepts of cartography that anyGIS user has to know, scale is the most important one.The scale of a map represent the size ratio between the“map” that would be obtained by developing the real surfacewe are representing (the Earth’s surface in this case), andthe scale of our smaller map. Knowing this ratio, we canknow the real measures of the elements that are includedin the map, since we can convert the measurements thatwe make on it into real-world measures. It’s important tokeep in mind that these measures are not so “real”, sincethe projection might have distorted them, but they are,19
nonetheless, measures at the original scale of the objectthat is measured.Scale is usually expressed as a quotient between the distance measured in a map and the distance that this measurerepresents in reality. For instance, a 1:50000 scale meansthat 1 centimeter in a map is equivalent to 50000 centimeters in reality, that is 500 meters. This value is known asthe numeric scale.Regardless of the projection used, scale is completelytrue only at certain points in the map. In the rest of them,scale changes. The relation between the scale in thosepoints and the numeric scal
It took me ve years to write the book, which ended up being a complete reference book with almost a thousand pages. Knowing that its size and its level of detail could be intimidating, and that many people would prefer a shorter version, in 2015, I wrote “Introducción a los SIG”. The book you