Transcription
Investor Presentationand Company OverviewFourth Quarter Fiscal 2021
Forward LookingStatements andNon-GAAPDisclaimerThis presentation and the accompanying oral presentation contain forward-looking statements that involve substantial risk anduncertainties, which include, but are not limited to, statements regarding our future results of operations and financial position,including our expectations regarding demand for our products and solutions and our future revenue; financial targets; businessstrategy; plans and objectives for expansion and future operations; our licensing and pricing models; our assessments of ourcompetitive advantages and the strength of our solutions and products; the effectiveness of our go-to-market and growthstrategies, including the positioning of our solutions and products, assessments of new and existing customers' reasons forselecting our solutions and products, and anticipated benefits from our strategic partnerships; new enhancements to our existingproducts and services or plans for future products; the expected performance or benefits of our offerings; our customer base;estimates of our potential addressable market and growth opportunities and our ability to address those opportunities; and ourexpectations regarding revenue mix, our ability to grow our business, the drivers of growth and the benefits of our investments.These forward-looking statements are subject to the safe harbor provisions under the Private Securities Litigation Reform Act of1995. Our expectations and beliefs in light of currently available information regarding these matters may not materialize. Actualoutcomes and results may differ materially from those contemplated by these forward-looking statements due to uncertainties,risks, and changes in circumstances, including but not limited to those related to: our future financial performance, including ourexpectations regarding our revenue, cost of revenue, gross profit or gross margin, operating expenses (which include changes insales and marketing, research and development and general and administrative expenses), and our ability to achieve andmaintain future profitability; our ability to continue to deliver and improve our offerings and develop new offerings, includingsecurity-related product and cloud and SaaS offerings; customer acceptance and purchase of our existing offerings and newofferings, including the expansion and adoption of our SaaS offerings; our inability to realize value from investments in thebusiness, including R&D investments; our ability to maintain and expand our user and customer base; the impact of the COVID 19pandemic on the macroeconomic environment, on our business, operations, hiring and financial results, and on businesses of ourcustomers and partners, including their spending priorities, the effect of lockdowns, restrictions and new regulations; the impactof our licensing model on the use and adoption of our software; the impact of foreign currency exchange rate and interest ratefluctuations on our results; our international expansion strategy; our operating results and cash flows; our beliefs and objectivesfor future operations; the sufficiency of our capital resources; our ability to successfully execute our go-to-market strategy andexpand in our existing markets and into new markets, and our ability to forecast customer retention and expansion; and generalmarket, political, economic and business conditions.Additional risks and uncertainties that could cause actual outcomes and results to differ materially are included in our filings withthe Securities and Exchange Commission (the “SEC”), including our Annual Report on Form 10 K for the fiscal year ended April30, 2020 and any subsequent reports filed with the SEC. SEC filings are available on the Investor Relations section of Elastic’swebsite at ir.elastic.co and the SEC’s website at www.sec.gov. Elastic assumes no obligation to, and does not currently intend to,update any such forward-looking statements, except as required by law.In addition to GAAP financial information, this presentation and the accompanying oral presentation include certain non-GAAPfinancial measures. See the Appendix for a reconciliation of all historical non-GAAP financial measures to their nearest GAAPequivalent.
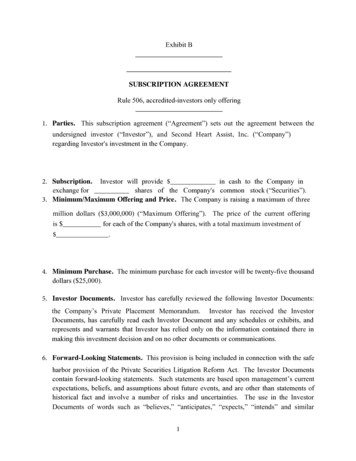
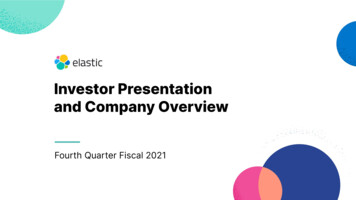
Elastic at a Glance NYSE ESTC Founded 2012 608.5M 12BRevenueMarketCapitalization1 15,000SubscriptionCustomersAs of FY21As of June 11, 2021135 2,100 Countries withEmployeesEmployees 18.3M45%Free Cash FlowRevenue fromoutside the U.S.Amsterdam,NetherlandsMountain View,California
Elastic Highlights: Search. Observe. Protect.Large, Diverse User and Customer BaseSecular Tailwinds Driving Significant OpportunityCustomer penetration: 48% Fortune 500, 34% Forbes 2000 78B TAM in 2021Diverse Deployment Model - On-premise,hybrid, public cloudHigh Recurring Revenue Model66% of total revenue Self-Managed, 34% YoY growth27% of total revenue Cloud; 80% YoY growthTotal Revenue: 608.5M; 42% YoY growthSubscription Revenue: 93% of total; 45% YoY growthStrong Customer GrowthSustainable Competitive Differentiation 15,000 Subscription Customers; 730 customers withACV 100K; 75 customers with ACV 1MMonetization model is based on subscriptions thatprovide proprietary features and supportStrong Expansion Motion with Multiple LeversExperienced, Founder-led TeamMultiple expansion motions drive high Net ExpansionRate of 130%Strong conviction to build a long-lasting companyAs of FY21
We are a search company.
We all know search as a search box that wesee on our favorite app or website .
but search is so much moreSearch finds insights across yourenterprise apps and contentrepositories to improveemployee productivity andsatisfactionSearch discovers insights fromwithin your enterprise systems,applications, and infrastructure todrive operational efficienciesSearch correlates insights withinyour security data, networks, andendpoints to protect yourorganization and thwart attacks
our TAM 78B 78B2021 45BSource: IDCWW AI-enabled Search Software Forecast 2020 2024WW Business Analytics Software Forecast 2020 2024WW IT Operations Management Software Forecast 2020 2024WW Device Vulnerability Management Forecast 2020 2024WW Security-as-a-Service Forecast 2020 2024WW Corporate Endpoint Security Software Forecast 2020 2024WW SIEM Forecast 2020 2024WW Business Analytics Software Forecast 2020 20242018
Customers across various industries, segments, and ePublic SectorAutomotive/TransportationRetail/EcommerceK
Powerful Business Model with Strong Network EffectsMultiple Expansion Levers-More data sources & volumeMore projects for the same solutionacross an enterpriseMore solutions adoptedCompelling CommercialModel-Proprietary features deliver significant valueLow-friction, resource-based pricing modelStrong new customer acquisitionFree Basic features become paid in CloudTechnology Differentiation-Solving problems from aunified search lensSpeed, scale, and relevance3 solutions, a single stackMassive Adoption-Basic tier drives massiveadoption of proprietary, freefeatures
Large Market Opportunity with Many Growth LeversLarge Total Addressable MarketDemonstrated track record ofstrong expansion: more data, moreprojects, more solutionsRapid pace of new customeradditions driven by paidfeatures and supportSolutions driving expansion withsignificant growth opportunityRobust growth in Elastic Cloud
Powerful Engine for New Customer GrowthMassive frictionless adoptionthrough free and open tier(proprietary features)Paid features and Supportdrive customer growthAll features monetized inSaaS (no free tier)Nurture campaigns inmarketingExpanding sales coveragedriving annual subscriptions Cloud and Self-managedSelf-service on-ramp for SaaSMonthly paymentsNo commitmentSingle pricing model
Levers to Drive ExpansionProjectsGrow More dataMore sources of dataUpsell to higher tiersMore Projects forSame Solution Expand across theenterpriseUpsell to higher tiersMore Solutions Extend across EnterpriseSearch, Observability, SecurityUpsell to higher tiers
power of searchWe aim to enable everyorganization in the world toutilize the power of searchacross their data to instantlyfind relevant insights andtake action.
power ofcommunity Millions of developers; drives adeveloper mindshare movement Creates a strong top of the funnelfoundation Facilitates bottom up adoption withinenterprises Generates an entry point into newmarkets and geos 150K meetup members, 263 globalgroups
power of asingle stack Organizations get leverage across multipleuse cases and teams A unified foundation for solutions Accelerates feature velocity
power of open Apache 2.0-licensedsource code is nowdual-licensed (ElasticLicense v2 or SSPL Elastic License v2 issimplified and morepermissive Our community andcustomers continue tohave free and openaccess to use, modify,redistribute, andcollaborate on the code Further protects ourcontinued investmentsand extends ourcompetitive differentiation Does not impactcustomers or the vastmajority of users
power of cloudand hybrid Ease of use, turnkey SaaS,consumption-based Provides customers with data gravity andlocality Support for customer data privacy regulations Multi-cloud support with native integration(billing/marketplace) 45 cloud regions; 3x from FY19 Support for cloud and on-premisesdeployments with ECE an ECK
Elastic Cloud isavailable andintegrated with everymajor cloud provider
Growth Drivers for Elastic olutionsRich ProprietaryFeaturesExpanding Investments,Locations
Investing in Global Cloud Regions CoverageAmericas18 regions16EMEA14 regionsGCPAzureAWSAs of FY21APJ13 regions
Observabilitypower ofsolutions Solves specific business problems withease of use Built into the Elastic Stack Single, unified experience across allsolutionsSecurityEnterprise Search
Enterprise SearchSearch everything, anywhere.Site SearchWorkplace SearchApplication SearchEcommerce SearchCustomer Support Search
WebsiteSearch enables newmonetization modelsand app stickinessWorkplaceSearch drives improveduser experiences andincreased conversionsApplicationEvery business today isan online business.Search increasesemployee productivityacross internal docsand applicationsCustomers want Powerful, fast, and relevant search experiences.Out-of-the-box. Open APIs. Capability to have pre-tunedsearch for any website, application, or workplace app.Complete visibility into the search analytics, results anduser behavior.“Elasticsearch is not only a powerful search engine,but also a powerful analytics engine for makingproduct recommendations and alerting on orderthresholds, powering our e-commerce business.Leading E-commerce Company
ObservabilityUnified observability for your entiredigital ecosystem.LogsMetrics / MonitoringAPM / TracingUptime / Synthetics
Managing systemsis complex.Search enablescorrelation of logs,metrics, and APM tracesSearch improves IToperations efficiency andreduces MTTRSearch providesactionable insights tomeet business objectivesCustomers want A single pane of glass across their observability data — logs,metrics, APM traces, and more. Easy ingestion. Accessiblemachine learning and anomaly detection. Automated alertsand workflow. Operational simplicity. Collaboration betweenDev, Ops, and Security teams.“We’re really happy with Elastic Observability and we’vebeen able to dramatically reduce our operations cost by50% and free up 95% of devops time.Fortune 500 Auto Manufacturer
SecurityPrevent, detect, and protectyour organization from attacks.Security Information and Event Monitoring (SIEM Security AnalyticsEndpoint Security (EPP/EDR Threat HuntingSecOps/Cloud Monitoring
Stopping attack at scaleis hard.Search facilitatesreal-time detection andprotection from endpointsto the data centerSearch enablesreal-time, holisticvisibility for all SecOpsSearch reducesdwell times tominimize or avoiddamageCustomers want Threat protection at scale across their systems, networks,and endpoints. Out-of-the-box detection rules with machinelearning, integration with MITRE ATT&CK, automated alertsand workflow to stop an attack in real-time, collaborationbetween ITOps, DevOps, and SecOps teams.“The dream was to automate a 24 7 protection systemthat works on its own. With our Elastic powered securityplatform, we save millions of dollars.Fortune 100 Retailer
power ofthe customer
Customers Among the Top 10 Companies of Each Industry48%Fortune 500Customers34%Forbes 2000CustomersAs of FY21As of iesBroadcast &Cable8/107/107/107/10Aerospace ompaniesTelecomServices
power of single pricingResource-based Pricing Pay for the data you useElastic Enterprise SearchElastic ObservabilityElastic SecuritySite SearchAPMSIEMNo query-based pricingNo agent/user-based pricingNo user/ingest-based pricingApp SearchLogsEndpoint SecurityNo docs-based pricingNo ingest-based pricingNo endpoint-based pricingWorkplace SearchMetricsNo user-based pricingNo host-based pricing
Developer to CXO MotionDeveloper &Practitioners Initial use case or project Champions Elastic across theirteam and departmentLine of Business (LOB Executiveand CXOs Adoption of Elastic across multiplelines of business or BUs Enterprise-wide adoption, Center ofExcellence Executive/CXO endorsement Multiple use cases or projects Adoption of Elastic across a singleline of business or BU Champions Elastic to other LOBleaders and executives
Customer JourneyHigh Volume, FrictionlessUser EngagementENGAGE & ADOPT Meetups Training Website Cloud Trials (SaaS ElasticON Download Documentation Basic Feature Usage Forums Trial to Paid FeaturesWarm Touch, Value-FocusedCustomer EngagementONBOARD & EXPAND Sales Development Support Field Sales Training Solution Architects Customer Success Inside Sales Renewals
Globally Distributed Sales Coverage45%of revenuefrom outsidethe U.S.As of FY21EnterpriseCommercialPublic Sector
Rapid customer growth and increasing strategic commitmentsTotal CustomersCustomers with ACV 100KCustomers withACV 1M 15,000 50 610FY20 75 730 11,300FY21FY20FY21FY20FY21
Solutions Driving Expansion with Significant Growth Opportunity 100K ACV Customers 50%1 Solution 30%2 Solutions3 Solutions 1M ACV Customers 20%1 Solution2 Solutions3 Solutions 25% 30% 45%As of FY21Solutions represent Enterprise Search, Observability and Security. For instance, if a customer uses loggingand APM, that counts as one solution (Observability), not two.
Why We WinSearch ValueTechnology VersatilityPricing TransparencySearch drives immediateA single technology that isResource-based pricingvalue core to a customer’sversatile enables customersensures there are nobusiness and critical useto have economies of scalehidden costs and thatcases in a way that isacross multiple projects,customers can grow overcontinuous.teams, and use cases.time with transparency.
Our Leadership TeamShay BanonFounder & CEOJanesh MoorjaniCFOJustin HoffmanSenior VP, SalesPaul ApplebyPresident, WorldwideField OperationsKevin KlugeSenior VP ofEngineeringAsh KulkarniChief Product OfficerW.H. Baird GarrettSenior VP, LegalGeneral Counseland SecretarySally JenkinsChief MarketingOfficerLeah SuttonSenior VP, GlobalHuman Resources
Commitment to Social Responsibility is a Key Component to Elastic’s CultureEmployee andCommunityEngagement Diversity and inclusion are core to our source code Employ anti-bias interviewer training and astructured hiring process with regards to D&I Maintain global targets for percentage of womenin management, engineering, and across thecompany Conduct regular employee engagement surveysand pay equity analyses to drive pay equity acrossgender globally Offer wide range of equitable benefits across areassuch as health, family, community, and time away Drive employee learning and organizationaldevelopment via Linkedin Learning and otherinternal initiatives Employee resource groups to support employeeengagement and foster an inclusive environment “Elastic Cares” program drives all year aroundcommunity and giving campaignsEnvironmentalHealth andSafety Elastic’s workforce is “Distributed by Design”.Leveraging a globally distributed workforceenables: Less transportation: minimizes traffic congestionand overall carbon footprint Lower energy usage, emissions and waste:much smaller office portfolio than mostcomparable organizations minimizes waste andenergy consumption Supply chain environmental and socialresponsibility management: Developing programsusing several industry standards such as ISO(International Standards Organization), RBA(Responsible Business Alliance, formerly EICC Electronic Industry Citizenship Coalition) andothers.Governance Board of Directors: independent majority board andan independent pay committee; 7 of 8 directors areindependent, the board has a lead independentdirector and all members of our board committeesare independent Diversity: 25% of our directors are female and theboard is California AB 979 (underrepresentedcommunity) compliant Term limits: Initial term of three years and amaximum term of 12 years for non-executivedirectors Corporate policies and mandatory employeetraining: Strong policies such as “CorporateGovernance Guidelines”, “Code of BusinessConduct and Ethics”, “Anti-Corruption Policy andWhistleblowing Policy” and mandatory ethics andcompliance trainings for all employees
Building a Culture of Success
Financial Overview
93%Subscriptionrevenue mix66%High RecurringRevenue Model withRobust SaaS Growth45% Y/YSelf-managed34% Y/Y27%SaaS80% Y/YAs of FY21
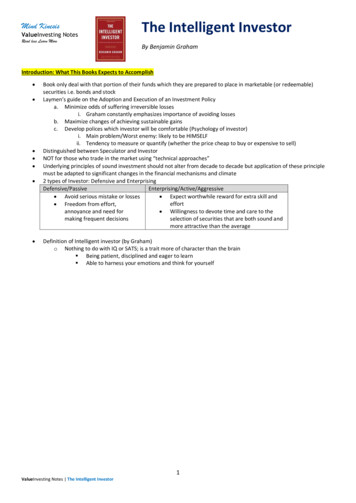
Strong Track Record of Driving Growth 157Total Revenue 145 millions 124 101 90 81 11 178 13 10 334Deferred Revenue 309 millions 278 165 8 10 147 260 134 210 121 9 9 7 7 113 129 398 114 201 104 171 170 92 82 74 52Q4 19Q1 20Q2 20Q3 2063%58%59%60%Q4 20Q1 21Q2 21Q3 21Q4 2153%44%43%39%44%Q1 20Q2 20Q3 20Q4 20Q1 21Q2 2166%64%58%52%52%63%54%Y/Y Growth %Y/Y Growth %SubscriptionQ4 19ServicesSums may not add to totals due to rounding.Q3 21Q4 2159%53%
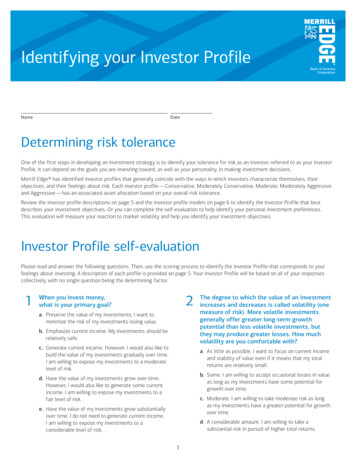
Operating Leverage Inherent in Model Visible As We ScaleTotal Revenue 608MNon-GAAP Operating Margin % 428MFY19FY20FY21 20.5% 17.7% 1.2% 272MFY19FY20FY21
Continued Expansion in Gross Profit As We ScaleNon-GAAP Gross Profit and Margin %Elastic Cloud is dilutive to gross margin % butaccretive to gross profit dollars. 46975% 31977%Maintained Non-GAAP Gross Margin % throughefficiencies despite increase in SaaS mixAnticipate modest continued headwind toNon-GAAP Gross Margin as SaaS mix increasesFY20FY21FY20FY21
Investing in Proprietary Innovation Increases Competitive AdvantageNon-GAAP R&D Expense and % of RevenueHigh velocity of releases with mainly proprietaryfeatures drives competitive advantage 160Rapid adoption delivers value early; paid featuresdrive monetization32.6% 14026.3%Endgame acquired in Q2 FY20Operating leverage through:Single code base across Stack and SolutionsPower Plays in Stack leveraged across SolutionsFY20FY21FY20FY21Top line growth investment growth
Rapidly Scaling Efficient Go-to-Market ModelEfficient distribution model drives efficiency ingo-to-market motions with strong productivityNon-GAAP S&M Expense and Margin % 23145.1% 193Investing globally in coverage and capacityacross roles38.0%Operating leverage through:Productivity GainsGrowth in CloudMoving further up within the enterpriseScaling velocity modelFY20FY21FY20FY21Partnerships
Financial FrameworkDrive recurring revenue growth: Subscriptions mix at 90% or moreGrow Elastic Cloud faster than overall business: Gradual increase in SaaS mixBalance profitability and growth: Disciplined reinvestmentTarget 5% annual share dilution (excluding acquisitions)Turned free cash flow positive in FY21Expect 1 billion-plus of revenue in FY23
Revenue Highlights millionsQ4 FY21Y/YY/Y CCFY21Y/YY/Y CCTotal Revenue 177.644%39% 608.542%40%Total SubscriptionRevenue 164.544%40% 567.345%42%SaaS Revenue 51.377%73% 166.380%78%Subscription % ofTotal Revenue93%ProfessionalServices Revenue 13.116%14%CC Constant Currency93%34%30% 41.2
Strong Billings and Customer Metrics millionsQ4 FY21Y/YY/Y CCTTM Y/YCalculated Billings 1 240.938%33%41%Q4 FY21 CUSTOMER METRICSTotal Subscription Customers 15,000Subscription Customers with TCV 1M 75Subscription Customers with ACV 100,000 730Net Expansion Rate 1 Slightly below 130%Calculated Billings represents total revenue plus the sequential increase in deferred revenue as presented on the statement ofcash flows, less the increase in unbilled accounts receivable. See appendix for reconciliation to GAAP.CC Constant Currency
Non-GAAP Income Statement HighlightsQ4 FY21% OFREVENUEFY21% OFREVENUETotal Revenue 177.6100% 608.5100%Gross Profit/Margin 137.978% 469.177%Research & Development Expense 43.524% 160.326%Sales & Marketing Expense 69.839% 231.238%General & Administrative Expense 25.915% 85.014%Operating Income/Margin 1.2 1% 7.3 1% millions, except per share amountsEarnings Per ShareSee appendix for reconciliation to GAAP 0.08 0.09
Select Financial Measures millions, except employeesFree Cash FlowQ4 FY21 3.1Cash & Cash Equivalents 400.8Total Deferred Revenue 397.7Remaining Performance Obligations 796.4EmployeesSee appendix for reconciliation to GAAP2,179
Appendix
Releases: Continued rapid pace of innovationPowerful foundational features in the Elastic Stack included: schema on read (GA ,frozen tier (GA , supervised machine learning (GA Elastic EnterpriseSearch Updated data architecture,including a new Elastic AppSearch precision tuning API Added performance andstability improvements tothe Elastic App Search webcrawler and support forweb crawling standards Introduced a new DropboxPaper connector andenhanced custom sourceAPIs in Elastic WorkplaceSearchElastic Observability Launched the beta ofElastic APM correlations Added support forMicrosoft Azuremonitoring use caseswith native MicrosoftAzure console integration Enabled additionalscalability and flexibilityof data ingestarchitectures with thebeta release of FleetServerElastic Security General availability ofanalyst-driven correlationpowered by Event QueryLanguage (EQL Added a new layer ofransomware preventionwith behavioral analysisin the Elastic Agent Launched beta supportfor central managementof osqueryElastic Cloud Launched support for thefrozen data tier, poweredby searchable snapshots Expanded support forautoscaling on ElasticCloud Launched two newMicrosoft Azure cloudregions: Azure SouthCentral US Texas), andAzure East US Virginia)
Remaining Performance Obligations (RPO Historical Trend millionsRemaining PerformanceObligations (RPO Q4 FY20Q1 FY21Q2 FY21Q3 FY21Q4 FY21 535.6 576.4 643.5 705.7 796.4
GAAP to Non-GAAP ReconciliationsGross Profit and Gross MarginQ4 FY21FY21 131.8 447.43.611.9 Amortization of acquired intangibles2.18.4 Employer payroll taxes on employee stock transactions0.41.3Non-GAAP gross profit 137.9 469.1GAAP subscription gross margin % in millionsGAAP gross profit Stock based compensation78.7%78.4% Stock based compensation1.2%1.3% Amortization of acquired intangibles1.3%1.5% Employer payroll taxes on employee stock transactions0.1%0.1%Non-GAAP subscription gross margin %81.4%81.3%GAAP professional services gross margin %17.4%6.3% Stock based compensation11.8%11.7% Employer payroll taxes on employee stock transactions1.8%1.6%Non-GAAP professional services gross margin %31.0%19.7%GAAP gross margin %74.2%73.5% Stock based compensation2.0%2.0% Amortization of acquired intangibles1.2%1.4% Employer payroll taxes on employee stock transactions0.2%0.2%Non-GAAP gross margin %77.6%77.1%Sums may not add to totals due to rounding
GAAP to Non-GAAP ReconciliationsOperating ExpensesQ4 FY21%RevenueFY21FY21%RevenueQ4 FY20Q4 FY21GAAP sales & marketing expenses 58.2 82.246% 273.945% Stock based compensation 5.8 9.1 5.1% 31.6 5.2% Amortization of acquired intangibles 1.4 1.4 0.8% 5.7 0.9% in millions except percentages Acquisition and related expenses 0.0 0.00.0%0.00.0% Employer payroll taxes on employee stock transactions 0.4 1.9 1.1% 5.4 0.9% Non-GAAP sales & marketing expenses 50.5 69.839% 231.238%Y/Y38%20%GAAP research & development expenses 45.6 55.431% 199.233% Stock based compensation 6.5 11.0 6.2% 35.3 5.8% Employer payroll taxes on employee stock transactions 0.3 1.0 0.5% 3.7 0.6% Non-GAAP research & development expenses 38.8 43.524% 160.326%Y/YGAAP general & administrative expenses12%15% 20.2 31.318% 103.817% Stock based compensation 2.7 4.8 2.7% 14.9 2.4% Acquisition and related expenses 0.2 0.00.0%0.00.0% Employer payroll taxes on employee stock transactions 0.1 0.6 0.4% 4.0 0.7% Non-GAAP general & administrative expenses 17.2 25.915% 85.014%Y/YSums may not add to totals due to rounding50%35%
GAAP to Non-GAAP ReconciliationsOperating Loss, Operating Margin and Net Loss per share in millions except percentages and per share amountsGAAP operating lossQ4 FY20Q4 FY21FY21 34.6 37.1 129.5 Stock based compensation17.228.493.7 Amortization of acquired intangibles3.63.514.2 Acquisition and related expenses0.20.00.0 Employer payroll taxes on employee stock transactions0.83.914.4Non-GAAP operating loss 12.7 1.2 7.3 GAAP operating margin % 28.0% 20.9% 21.3% Stock based compensation13.9%16.0%15.4% Amortization of acquired intangibles2.9%2.0%2.3% Acquisition and related expenses0.2%0.0%0.0% Employer payroll taxes on employee stock transactions0.7%2.2%2.4%Non-GAAP operating margin % 10.3% 0.7% 1.2% GAAP net loss per share 0.38 0.48 1.48 Stock based compensation0.210.321.07 Amortization of acquired intangibles0.040.040.16 Acquisition and related expenses0.000.000.00 Employer payroll taxes on employee stock transactions0.010.040.16 Tax adjustment 0.01 0.00 0.01 Non-GAAP net loss per share 0.12 0.08 0.09 Sums may not add to totals due to rounding
GAAP to Non-GAAP ReconciliationsCalculated Billings in millionsRevenueAdd: Increase in total deferred revenueLess: (Increase) decrease in unbilled accounts receivableCalculated billingsQ4 FY20Q4 FY21FY20FY21 123.6 177.6 427.6 608.552.062.685.7115.9 0.5 0.6 0.6 2.6 175.1 240.9 512.7 721.8Y/Y38%41%Free Cash Flow in millionsNet cash used in operating activitiesLess: Purchase of property and equipmentLess: Capitalization of internal-use softwareFree cash flowFree cash flow margin*Q4 FY20Q4 FY21FY20FY21 5.9 1.6 30.6 22.5 0.8 1.2 5.1 3.9 0.0 0.3 0.0 0.3 6.8 3.1 35.6 18.3 5% 2% 8% 3%*Free cash flow margin represents free cash flow divided by total revenueSums may not add to totals due to rounding
GAAP to Non-GAAP ReconciliationGross Profit, Gross Margin and Operating Margin in millions)GAAP gross profitFY19FY20FY21 193.6 304.9 447.4 Stock based compensation4.67.111.9 Amortization of acquired intangibles2.86.88.4 Employer payroll taxes on employee stock transactions0.00.51.3Non-GAAP gross profit 201.1 319.4 469.1GAAP gross margin71.3%71.3%73.5% Stock based compensation1.7%1.7%2.0% Amortization of acquired intangibles1.0%1.6%1.4% Employer payroll taxes on employee stock transactions0.0%0.1%0.2%Non-GAAP gross margin %74.0%74.7%77.1%GAAP operating margin % 37.3% 40.0% 21.3%14.7%14.0%15.4% Amortization of acquired intangibles1.1%2.4%2.3% Acquisition and related expenses0.3%4.2%0.0% Employer payroll taxes on employee stock transactions0.7%1.8%2.4% 20.5% 17.7% 1.2% Stock based compensationNon-GAAP operating margin %Sums may not add to totals due to rounding
GAAP to Non-GAAP ReconciliationResearch & Development and Sales & Marketing ExpensesFY19FY20FY21FY19% RevenueFY20% RevenueFY21% Revenue 101.2 165.4 199.237.2%38.7%33% Stock based compensation 16.1 23.6 35.3 5.9% 5.5% 5.8% Acquisition and related expenses 0.7 0.00.0 0.3%0.0%0.0% Employer payroll taxes on employee stock transactions 0.9 2.2 3.7 0.3% 0.5% 0.6%Non-GAAP research & development expenses 83.4 139.5 160.330.7%32.6%26.3%GAAP sales & marketing expenses 147.3 219.0 273.954.2%51.2%45% 12.0 19.3 31.6 4.4% 4.5% 5.2% Amortization of acquired intangibles 0.1 3.3 5.7 0.1% 0.8% 0.9% Acquisition and related expenses 0.0 0.50.0 0.0% 0.1%0.0% Employer payroll taxes on employee stock transactions 0.7 3.2 5.4 0.3% 0.8% 0.9% 134.4 192.6 231.249.5%45.1%38.0% in millions)GAAP research & development expenses Stock based compensationNon-GAAP sales & marketing expenses
DefinitionsCustomers: We define a customer as an entity that generated revenue in the quarter ending on themeasurement date from an annual or month-to-month subscription. All affiliated entities are typicallycounted as a single customer.Customers 100K ACV and Customers 1M ACV The annual contract value, or ACV, of a customer’scommitments is calculated based on the terms of that customer’s subscriptions, and represents the totalcommitted annual subscription amount as of the measurement date. Month-to-month subscriptions arenot included in the calculation of ACV.Net Expansion Rate: To calculate an expansion rate as of the end of a given month, we start with the ACVfrom all customers as of twelve months prior to that month end, or Prior Period Value. We then calculatethe ACV from these same customers as of the given month end, or Current Period Value, which includesany growth in the value of their subscriptions and is net of contraction or attrition over the prior twelvemonths. We then divide the Current Period Value by the Prior Period Value to arrive at an expansion rate.The Net Expans
Elasticsearch is not only a powerful search engine, but also a powerful analytics engine for making product recommendations and alerting on order thresholds, powering our e-commerce business. Leading E-commerce Company. Observability