Transcription
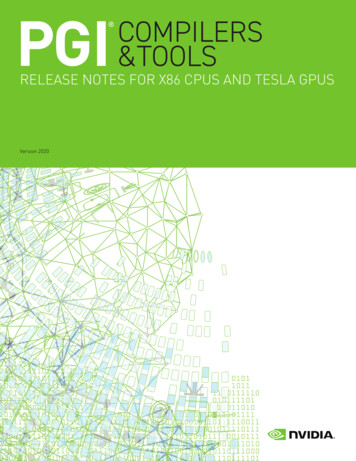
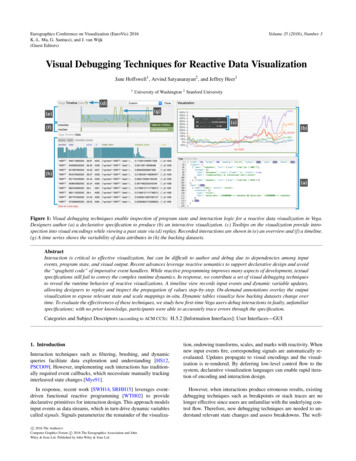
Eurographics Conference on Visualization (EuroVis) 2016K.-L. Ma, G. Santucci, and J. van Wijk(Guest Editors)Volume 35 (2016), Number 3Visual Debugging Techniques for Reactive Data VisualizationJane Hoffswell1 , Arvind Satyanarayan2 , and Jeffrey Heer11University of Washington 2 Stanford University(d)(e)(g)(f)(c)(b)(h)(a)Figure 1: Visual debugging techniques enable inspection of program state and interaction logic for a reactive data visualization in Vega.Designers author (a) a declarative specification to produce (b) an interactive visualization. (c) Tooltips on the visualization provide introspection into visual encodings while viewing a past state via (d) replay. Recorded interactions are shown in (e) an overview and (f) a timeline.(g) A time series shows the variability of data attributes in (h) the backing datasets.AbstractInteraction is critical to effective visualization, but can be difficult to author and debug due to dependencies among inputevents, program state, and visual output. Recent advances leverage reactive semantics to support declarative design and avoidthe “spaghetti code” of imperative event handlers. While reactive programming improves many aspects of development, textualspecifications still fail to convey the complex runtime dynamics. In response, we contribute a set of visual debugging techniquesto reveal the runtime behavior of reactive visualizations. A timeline view records input events and dynamic variable updates,allowing designers to replay and inspect the propagation of values step-by-step. On-demand annotations overlay the outputvisualization to expose relevant state and scale mappings in-situ. Dynamic tables visualize how backing datasets change overtime. To evaluate the effectiveness of these techniques, we study how first-time Vega users debug interactions in faulty, unfamiliarspecifications; with no prior knowledge, participants were able to accurately trace errors through the specification.Categories and Subject Descriptors (according to ACM CCS): H.5.2 [Information Interfaces]: User Interfaces—GUI1. IntroductionInteraction techniques such as filtering, brushing, and dynamicqueries facilitate data exploration and understanding [HS12,PSCO09]. However, implementing such interactions has traditionally required event callbacks, which necessitate manually trackinginterleaved state changes [Mye91].In response, recent work [SWH14, SRHH15] leverages eventdriven functional reactive programming [WTH02] to providedeclarative primitives for interaction design. This approach modelsinput events as data streams, which in turn drive dynamic variablescalled signals. Signals parameterize the remainder of the visualizac 2016 The Author(s)Computer Graphics Forum c 2016 The Eurographics Association and JohnWiley & Sons Ltd. Published by John Wiley & Sons Ltd.tion, endowing transforms, scales, and marks with reactivity. Whennew input events fire, corresponding signals are automatically reevaluated. Updates propagate to visual encodings and the visualization is re-rendered. By deferring low-level control flow to thesystem, declarative visualization languages can enable rapid iteration of encoding and interaction design.However, when interactions produce erroneous results, existingdebugging techniques such as breakpoints or stack traces are nolonger effective since users are unfamiliar with the underlying control flow. Therefore, new debugging techniques are needed to understand relevant state changes and assess breakdowns. The well-
Jane Hoffswell, Arvind Satyanarayan, Jeffrey Heer / Visual Debugging Techniques for Reactive Data Visualizationdefined semantics of declarative visual encodings provide new opportunities for enhanced debugging support, as tools can surfacetraces from pixels, through scale transforms, to source data (andvice versa). Regardless of programming style, interactions can beinherently difficult to author and debug. Developers must understand complex dependencies among input events, program state,and visual output. Textual specifications alone are inadequate fortracking relationships through time-varying behaviors. To debugfaulty interactions, developers must inspect the state of events andprogram variables during interaction, and track changes over time.In this paper, we describe formative interviews with visualizationdevelopers to assess their debugging needs. We then contribute aset of visual debugging techniques for reactive data visualizations,motivated by three design goals to enable users to probe the state,visualize relationships, and inspect transitions.Consider debugging an index chart of stock prices that interactively renormalizes the data based on the mouse position (Fig. 1b,2). A user first writes a specification (Fig. 1a) of encoding rules andinteractions. During interaction, the user notices that at certain timepoints, all the time series flatline (Fig. 4b) due to a specificationerror. The user must now assess the dependencies between interaction, program state, and visual output. She could start by recordinginteractions in the timeline (Fig. 1f), and replaying (Fig. 1d) to observe how events propagate. The overview (Fig. 1e) summarizesactivity, allowing for quick identification of interaction patterns.In-situ annotations (Fig. 1c) expose the faulty position encodingby showing the data values and encodings corresponding to the selected pixel. The user can then inspect the backing dataset via dynamic tables (Fig. 1h). Guided by the attribute variability (Fig. 1g),she observes that some data attributes have been zeroed out, whichshe selects to link back to the specification to fix the error.We instantiate these techniques in the context of Vega [SWH14],a declarative visualization grammar that supports reactive interaction design. In an initial evaluation, we study how 12 first-time Vegausers debug faulty interactions in unfamiliar specifications. Despitetheir lack of expertise with Vega, we find that the participants canaccurately trace errors to problematic lines in the specifications byemploying our visual debugging techniques.2. Related WorkOur visual debugging techniques leverage event-driven functionalreactive programming abstractions, and are informed by prior workon timeline- and replay-based interactive debuggers, and visual representations of program state and behavior.2.1. Functional Reactive ProgrammingEvent-Driven Functional Reactive Programming (E - FRP)[WTH02], one of many FRP variants [BCC 13], is an increasingly popular paradigm for authoring interactive behaviors.E - FRP models low-level input events as continuous streams of data,which can be composed into dynamic variables called signals.When a new event fires, the E - FRP runtime propagates it to thecorresponding streams, and dependent signals are updated in twophases. In the first phase, signals are reevaluated using their dependencies’ prior values; these dependencies are then reevaluated inthe second phase [WTH02]. E - FRP has been shown to be suitablyexpressive for interactive web applications [MGB 09, CC13] andvisualizations [CL08, KL15, SWH14]. In this section, we focus onthe former and defer the latter to the subsequent section.Although E - FRP is sufficiently expressive for web applications,debugging support remains weak. Many existing debugging techniques — such as breakpoints and stack traces — no longer apply,as users declaratively specify interactions. The E - FRP runtime isentirely responsible for the program execution, the particulars ofwhich will be unfamiliar to end-users. The Elm language [CC13]has begun to develop an interactive debugger, inspired by BretVictor [Vic12]. The Elm debugger allows recording and replayingprogram states, but developers must manually annotate their codewith watch and trace statements. Tracked states are then simply printed out in a list. In contrast, our timeline view automaticallytracks all user-defined signals. Along with the overview, the timeline provides users with a visual representation of event and statepropagation, which facilitates identifying faulty behavior.2.2. Timeline- and Replay-based DebuggersThe technique of recording and replaying program states can alsobe found in the FireCrystal [OM09] and Timelapse [BBKE13] systems. Both systems target interactive behaviors on web pages, butrequire significant supporting infrastructure. For example, to capture user interaction, FireCrystal must register a watcher on theDocument Object Model (DOM) and a number of event listeners;it then leverages the Firefox browser’s debugging API to identifywhich line of code is executed. The authors report that this operation is CPU-intensive and can affect interactive performance duringrecording [OM09]. For Timelapse, Burg et al. developed Dolos: extensions to the WebKit browser engine to record and replay interactions. By operating at this low-level, Dolos overcomes the overhead of watchers and event listeners, and integrates directly withthe browser’s existing JavaScript inspector [BBKE13].By using E - FRP semantics, such complex infrastructures are notnecessary to support our visual debugging techniques. In particular(as detailed in §3), we need only track and visualize signal valuesover time. This simplification is possible because signals expressthe bulk of an interaction technique, abstracting away the particularinput events that trigger interactive behavior. Simple static analysisof the specification can then identify where signals are used.2.3. Visual Representations of Program BehaviorRepresenting program state visually has been found to be a powerful pedagogical aid. Online Python Tutor [Guo13] provides visualizations of allocated Python objects, pointer references, globalvariables, and stack frames. Teachers have incorporated this system into course materials and reported that the diagrams mirroredones they produce in class to help students build mental models.This finding was corroborated by students accessing the site as asupplementary learning tool, who shared positive anecdotes aboutits utility on online discussion forums. Whyline [KM04] and Theseus [LBM14] investigate the effects of introducing visualizationswithin integrated development environments. Whyline’s extensionsreduced debugging time by a factor of 8, while developers adoptedc 2016 The Author(s)Computer Graphics Forum c 2016 The Eurographics Association and John Wiley & Sons Ltd.
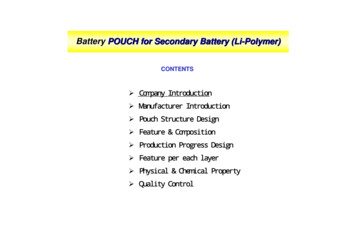
Jane Hoffswell, Arvind Satyanarayan, Jeffrey Heer / Visual Debugging Techniques for Reactive Data Visualization(a){."signals": [{"name": "indexDate","init": {"expr": "time('Jan 1 2005')"},"streams": [{"type": "mousemove", "expr": "clamp(eventX(), 0, width)","scale": {"name": "x", "invert": true}}]}],"data": [{"name": "stocks", "url": "data/stocks.csv", .},{ "name": "index", "source": "stocks","transform": [{"type": "filter","test": "month(datum.date) month(indexDate) && ."}]},{ "name": "indexified stocks", "source": "stocks","transform": [{"type": "lookup", "on": .},{"type": "formula", "field": "indexed price", "expr": "."}]}],"scales": [{"name": "y", "type": "linear","domain": {"data": "indexified stocks", "field": "indexed price"},"range": "height"}, .], indexDateRaw Datastocks.jsonindex aindexed priceScalesy}Figure 2: (a) An excerpt of the Vega JSON specification and (b) a corresponding design schematic for (c) an interactive index chart. Eventstreams capture mousemove events that are passed through an inverted scale transform and stored in a signal. The signal parameterizesdata transforms to select an index point and normalize stock price time-series data.entirely new problem-solving strategies by leveraging Theseus’ visualizations. These results motivate our study of visual techniquesfor debugging reactive visualizations.System profilers also make use of visualizations. For example,Flame Graphs [Gre15] are widely used to understand the CPUand memory performance of applications, and similar visualizations have been added to profile JavaScript performance within theChrome web browser [Goo15b]. Akin to GNU ggprof [GKM82],Chrome also provides graph visualizations to profile JavaScript’smemory usage [Goo15a]. More recently, Perfopticon [MHHH15]visualizes the query plan and execution behavior of distributeddatabase systems. Algorithm visualizations map low-level algorithmic behavior to visual properties, with animations showingchanges over time [DFS02]. All of these visualizations have beenpurpose-built to expose low-level execution details, enabling expertusers to identify performance bottlenecks. During our formativestudies, experienced visualization designers reported that displaying the execution pipeline that produces the resultant visualizationwould only be tangentially useful when debugging faulty behavior.The user defers execution to the system, rendering low-level visualization techniques ineffective since users lack familiarity withthe internal structure. Thus, our techniques maintain the abstractionlevel of the specification language used by users.3. Background: The Vega Visualization GrammarOur visual debugging techniques were developed in the contextof Vega, a declarative visualization grammar. In this section, webriefly describe the aspects of Vega relevant to this paper. For concrete interactive examples, we refer interested readers to the onlineVega editor: http://vega.github.io/vega-editor.Closely following the model of Protovis [BH09] andD3.js [BOH11], Vega visualizations comprise graphical primitives called marks, such as bars, plotting symbols, and lines,whose properties are determined by the attributes of backingdatasets. Integrated data transformation pipelines provide operations including statistical summarization and spatial layout(e.g., treemaps and cartographic projections). Scales map datac 2016 The Author(s)Computer Graphics Forum c 2016 The Eurographics Association and John Wiley & Sons Ltd.attributes to visual variables, and are visualized by guides (i.e.,axes and legends). Vega visualizations are expressed using JSON.A JavaScript runtime parses input specifications and producesresulting visualizations [SRHH15].To support interaction design, Vega uses Event-Driven Functional Reactive Programming (E - FRP) [SWH14]. Input events aremodeled as streams of data, and an event selector syntax facilitatesstream composition. For example, [mousedown, mouseup] mousemove specifies a stream of mousemove events thatoccur between mousedown and mouseup (otherwise known asdrag). Event streams serve as a first-class data source. Signals arein turn defined as reactive expressions over stream values. For instance, a signal might extract the x and y coordinates from the mostrecent mouse input event. Signal values defined in pixel space canbe passed through inverse scale transforms to map back to the datadomain. Scale inversions allow interactive behaviors to generalizeacross distinct coordinate spaces (e.g., small multiples) or coordinate multiple visualizations (e.g., brushing and linking).Signals can parameterize the remainder of the Vega specification, thereby endowing data transformations and visual encodingswith reactive semantics (Fig. 2). Reactive updates (referred to aspulses) occur in two steps [WTH02]. When an event occurs, dependent signals are re-evaluated in their specification order. Thisstep allows signal expressions to access the previous values of dependencies listed later in the specification; these dependencies aresubsequently updated on the same pulse. Once the signals have updated, dependent data transformations and visual encodings are recomputed in topological order of the underlying dependency graph.Signals are critical for enabling the development of our visual debugging techniques. Signals decouple low-level input events frominteraction logic. For example, the same set of named signals canbe driven by mouse and touch events. Moreover, signals expressthe bulk of the interaction logic and participate in visual encodingeither as direct parameters or by parameterizing simple if-then-elseencoding rules. As a result, signals provide a meaningful entrypoint into an interaction specification. In contrast to imperativeevent handlers, complex static analysis is not required to identifyand surface the relevant program state.
Jane Hoffswell, Arvind Satyanarayan, Jeffrey Heer / Visual Debugging Techniques for Reactive Data Visualization4. Formative Interviews & Design GoalsTo better understand the debugging needs for reactive data visualization, we conducted formative interviews with Vega developersregarding their development processes. At the time of the study,Vega’s reactive extensions had not yet been officially released, soparticipants were primarily familiar with static visualizations.Prior to this work, there was no infrastructure for debuggingvisualizations in Vega. Users could only rely on the JavaScriptconsole to traverse the underlying system internals. However, thismethod was not discoverable or intuitive for novice users. Accessing and navigating the system internals requires existing knowledge of how to locate relevant information, which is often deeplynested in the internal structure. This structure contains extraneousdetails that complicate identification of relevant information. Thestructural disconnect between signals, data, and encodings makesit hard to track changes between components, thus making it impractical for complex tasks. An example of the debugging processin this environment is available in the supplementary material.Participants. We recruited 8 software professionals (all male), allwith experience creating static Vega visualizations, and none affiliated with the University of Washington. Participants were selectedbased on their participation in the Vega community. Each interviewlasted about 30 minutes; participants did not receive compensation.Protocol. The semi-structured interviews examined each participant’s development process as related to Vega. Participants wereshown sample visualizations of Vega’s dataflow graph and asked toreflect on the utility of such techniques with respect to their debugging needs; one participant was unable to access and view the sample visualizations during the interview. The full script is included inthe supplementary material and includes the following questions: What was the last (or most troublesome) error you encounteredwhen generating a Vega specification? In what ways do you think the debugging process could havebeen facilitated? Do you think that having the dataflow graph visualized would beuseful for the development process?Data Collection. The interviews took place over Skype andGoogle Hangouts. The example visualizations were shared usingGoogle Docs. We captured audio recordings for later review andtranscribed notes during the interview.Results. Errors in encoding are often visually salient (e.g., pointsare filled with the wrong color), but tracing the error through thespecification can be difficult — is the result due to an incorrectscale definition, an error in data transformations, or a problem inthe input data itself? With Vega’s declarative model, users lack visibility into the state of these components. One participant notedthat “when you mess up that JSON you get an error from deep inJavaScript land,” while another participant described difficult debugging scenarios where “[the resultant visualization is] just blankand you don’t know why.”Participants noted that visualizing the internal dataflow graphcould be beneficial for Vega system developers, but provides toomuch internal information tangential to their user-level debuggingtasks. In particular, one participant noted that “the [dataflow] graphpresumes insight into how Vega’s internals operate.” Inspecting thestate via the JavaScript console or viewing Vega’s dataflow graphpresents users with a mixture of state information, only a smallfraction of which is relevant to the debugging task at hand. Theextraneous system details complicate identification of relevant information, suggesting that it would be beneficial to strip internalsystem information from the user’s view.Participants explained that their needs centered on the relationships between data and encodings expressed within their specifications. One participant explained that Vega “need[s] a way to examine internal variables. [and] to see the internals of the step-bystep process.” Many participants additionally expressed the need tounderstand “the structure of the data that Vega is actually using”because data transformations may restructure the data or introducenew attributes. One participant noted that “the easiest path to solve[the specification error] was to just break into the [JavaScript] debugger and see what state the data was in at various stages.”Interactions further complicate the debugging process. Signalsparameterize data transformations and encodings, introducing additional dependencies. While signals usefully abstract low-level input events, some users find that this abstraction complicates reasoning about event propagation. As one participant stated, “debuggingreactivity is like a true true nightmare.” Our interviews and observations regarding interaction inform three debugging design goals.Probe the state: At a given moment, the visualization is determined by signal values, data transformations, and encoding rules.Users must be able to inspect the state of each of these components.Visualize relationships: The state of one component often affects the state of others — for example, signals can parameterizeencoding rules, or data transformations may affect scale domains.Users must be able to identify dependencies between components.Inspect state transitions: Input events trigger transitions fromstate to state, and debugging faulty interactions requires understanding the causes and consequences of these transitions. To identify the source of an error, users must be able to inspect how valuespropagate through the specification.5. Visual Debugging TechniquesWe now present the design of our visual debugging techniques forreactive data visualization. In the formative studies, one participantobserved that “There are two possible errors. One is like a runtime error. The other is you actually have a well-formed executionand [the visualization] is not showing what you expect it to show.”These debugging techniques focus on the latter, supporting the refinement of the user’s mental model through exploration of boththe data and state. To enable inspection of state and the behaviorof changes over time, we incorporate three elements: a timeline ofsignals, in situ annotations of relevant encodings, and a dynamicdata table. In the following sections, we describe the design andbacking rationale for each of these debugging techniques.5.1. The Signal Timeline and ReplayThe timeline (Fig. 1f) lists every user-defined signal in specification order. Signal updates are represented as colored cells in thec 2016 The Author(s)Computer Graphics Forum c 2016 The Eurographics Association and John Wiley & Sons Ltd.
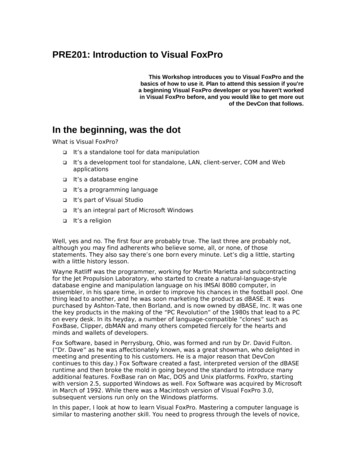
Jane Hoffswell, Arvind Satyanarayan, Jeffrey Heer / Visual Debugging Techniques for Reactive Data Visualization(a)(b)(c)Index Chartconsistent interaction{ "name": "xMax", "init": 1.6,"streams": [{"type": "xDelta","expr": "xMax ousemoveBrushingbrushbrushFigure 3: The overview, timeline, and signal annotations after performing interactions. (a) The overview provides insight into differentinteraction patterns. (b) Stepping within a pulse allows users to see intermediate states of an interaction. The second scatterplot showsa brush representing the new brush start and old brush end. (c) Dependencies are shown as red outlines on hover. (d) Signalannotations overlay the visualization, with fill color encoding temporality: from darkest (past), through red (current), to lightest (future).timeline, arranged into columns corresponding to reactive updates(pulses). The current signal value is displayed on the far right;mouse hover expands the contents and displays any scale transforms used to define the signal. As users interact with the visualization, signal values update and populate new columns in thetimeline. By default, cell widths are automatically adjusted so allpulses are visible. An overview (Fig. 1e) summarizes pulse activityover time, with bar heights encoding the number of signal updateson a given pulse. The overview exposes patterns in the recorded interaction (Fig. 3a), and brushing zooms the timeline to show onlypulses within the selected range.Hovering over a cell displays a tooltip of the signal value in theoverview to enable rapid comparison. Hovering also exposes thedependencies a signal update relies on — cells are outlined in redto illustrate which dependency values are used, and icons are shownbeside dependency names in case the corresponding cell is not visible (Fig. 3c). Keyboard navigation allows users to move up anddown, to understand the propagation of signal values within thesame pulse (Fig. 3b), or left and right to identify a particular pulsewhich exhibited faulty behavior. The selected cell is indicated withdark green, with other signal values used by this state in light green.Users can select a cell in the timeline to rewind the visualizationto an earlier state. Each time user interaction triggers a signal toupdate, the system records the new value and pulse number. Replay is enabled by setting the signal values for the desired pulseand re-rendering the visualization as if it were a new pulse in thespecification. During replay, interaction is disabled to prevent newevents from being added to the timeline mid-stream.Rationale. The timeline provides users introspection into theheart of the interaction logic — signals — and is designed to reifythe two-step reactive update process. As a result, pulses populatethe timeline from top to bottom, and hovering over a particular cellcan reveal if an older value was used for a dependency listed later.Early prototypes took this one step further. Pulse propagation wasmore salient as each cell in the timeline was marginally offset, proc 2016 The Author(s)Computer Graphics Forum c 2016 The Eurographics Association and John Wiley & Sons Ltd.ducing a “cascade” or “waterfall” effect. This design required morespace to encode the same information and made coarse navigationdifficult. It was only meaningful to navigate left or right (i.e., backwards or forwards in time). As a result, locating a faulty pulse required users to step through every intermediate state of other pulses.In contrast, by condensing pulses into columns, users can quicklymove back and forth across the timeline and only deep dive into theintermediate states of pulses of interest.The timeline also maintains the level of abstraction providedby signals. For example, the particular low-level input eventsthat trigger a reactive update are not identified. When such lowlevel events are required for debugging erroneous event selectors,users can define additional signals as needed that only capture theevent.type that triggers them, and track them via the timeline and overview. Similarly, although Vega’s internal dataflow dependency graph can be readily visualized, the timeline only surfaces dependency information for the particular cell a user hoversover. Helper signals automatically generated by Vega are also hidden from view. Together, these reflect the findings of our formative study: users were overwhelmed by details of Vega’s executionpipeline, and found them to be tangential to the debugging at hand.5.2. In-Situ AnnotationsWhen users pause interaction recording, either explicitly (Fig. 1d)or by rewinding to an earlier state, a number of on-demand annotations become available to inspect the visualization state in-situ.The specification is analyzed to extract all scaled visual encodingrules for each mark. Mousing over the visualization performs a hittest against the underlying scenegraph to find an intersecting markor group. If a mark is not found, then the user’s cursor is over agroup’s background; the tooltip displays the cursor’s coordinatesrelative to the group, along with any spatial scales used to encodethe group’s children (Fig. 1c). If a mark is found, its visual encoding rules are shown in addition to the coordinates.
Jane Hoffswell, Arvind Satyanarayan, Jeffrey Heer / Visual Debugging Techniques for Reactive Data 122232425262728293031323334353637383940."signals": [{"name": "indexDate","init": {"expr": "time('Jan 1 2005')"},"streams": [{"type": "mousemove","expr": "clamp(eventX(), 0, eventGroup('root').width)","scale": {"name": "x", "invert": true}}]}],{"width": 650,"height": 300,"padding": "strict","signals": [{"name": "indexDate","init": {"expr": "time('Jan 1 2005')"},"streams": [{"type": "mousemove","expr": "clamp(eventX(), 0, eventGroup('root').width)","scale": {"name": "x", "invert": true}}]},{"name": "maxDate", "init": {"expr": "time('Mar 1 2010')"}}],1/12"data": [{"name": "stocks", "url": "data/stocks.csv"},{ERROR"name": "index", "source": "stocks","transform": [{"type": "filter","test": "datum.date 1296000000 indexDate && datum.date - 1296000000 indexDate"5/12}]},{"name": "indexified stocks", "source": "stocks","transform": [{"type": "lookup","on": "index", "onKey": "symbol",1/12"keys": ["symbol"], "as": ["index term"],3/12"default": {"price": 0}}, {"type": "formula",1/12"field": "indexed price","expr": "datum.index term.price 0 ? (datum.price-datum.index term.price)/datum.index term.price : 0" 5/12}]}],."data": [{"name": "stocks","url": "data/stocks.csv","format": {"type": "csv", "parse": {"price":"number", "date":"date"}}},{"name": "index","source": "stocks","transform": [{"type": "filter","test": "datum.date 1296000000
Visual Debugging Techniques for Reactive Data Visualization Jane Hoffswell1, Arvind Satyanarayan2, and Jeffrey Heer1 1 University of Washington 2 Stanford University (h) (f) (e) (d) (g) (b) (a) (c) Figure 1: Visual debugging techniques enable inspection of program state and interaction logic fo