Transcription
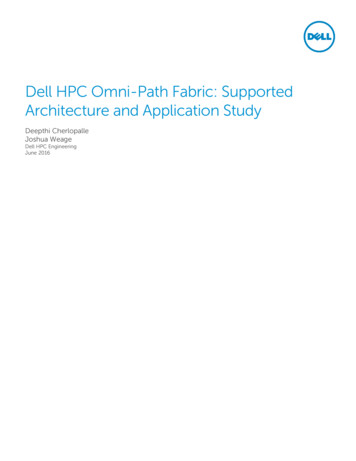
Techniques for Debugging HPC ApplicationsNIKOLAY PISKUN , DIRECTOR OF CONTINUING ENGINEERING, TOTALVIEW PRODUCTSRogueWave by Perforce 2019 Perforce Software, Inc.AUGUST 7 2019, ATRESC 2019
Agenda What is debugging and why TotalView? Overview of TotalView and TotalView’s new UI Advanced C and Data debugging MPI and OpenMP parallel debugging Reverse debugging Memory debugging GPU debugging Python/C debugging Using TotalView on ANL TotalView resources and documentation Questions/Comments2 Rogue Wave by Perforce 2019 Perforce Software, Inc.roguewave.com
What is Debugging andWhy do you need TotalView?
What is Debugging? Debugging is the process of finding andresolving defects or problems within acomputer program or a system. Algorithm correctness Data correctness Scaling/Porting correctness4 Rogue Wave by Perforce 2019 Perforce Software, Inc.roguewave.com
TotalView debugger enables you to do: Interactive debugging Live control of an executing program Remote debugging Debug a program running on another computer Post-mortem debugging (core files and reverse debugging) Debugging a program after it has crashed or exited Memory debugging Find memory management problems (leaks, corruption ) Comparing results between executions Batch debugging (tvscript, CI environments) Unattended debugging
TotalView for HPC and for All Leading debug environment for HPC users Active development for 30 years Thread specific breakpoints Control individual thread execution View complex data types easily From MacBook to Top500 Supercomputers Track memory leaks in running applications Supports C/C and Fortran on Linux/Unix/Mac Support debugging mixed Python/C Integrated Reverse debugging Batch non-interactive debugging. Allowing YOU to have Predictable development schedules Less time spent debugging6 Rogue Wave by Perforce 2019 Perforce Software, Inc.roguewave.com
TotalView’s GUI
TotalView’s Classic UI Original powerful design Better tested for high-scale MPI jobs Assembler support Better supported for Remote Display Client To use: Set UI preference Or command line argumenttotalview -oldUI8 Rogue Wave by Perforce 2019 Perforce Software, Inc.roguewave.com
TotalView’s New UI (default) Provides a modern, dockable interface Easier to use, better workflows An architecture to grow To use:– Set UI preference– Or command line argumenttotalview -newUI New UI gaps:– Missing array slicing andstriding, view across, datavisualization– No very high-scale support9 Rogue Wave by Perforce 2019 Perforce Software, Inc.roguewave.com
Intro & Starting Up
11 Rogue Wave by Perforce 2019 Perforce Software, Inc.roguewave.com
Start New Process – Arguments12 Rogue Wave by Perforce 2019 Perforce Software, Inc.roguewave.com
Start New Process – Enable ReplayEngine13 Rogue Wave by Perforce 2019 Perforce Software, Inc.roguewave.com
Start New Process – Memory Debugging14 Rogue Wave by Perforce 2019 Perforce Software, Inc.roguewave.com
CUDA memory checking15 Rogue Wave by Perforce 2019 Perforce Software, Inc.roguewave.com
Set environment variables16 Rogue Wave by Perforce 2019 Perforce Software, Inc.roguewave.com
Standard I/O redirection17 Rogue Wave by Perforce 2019 Perforce Software, Inc.roguewave.com
Attach to Process18 Rogue Wave by Perforce 2019 Perforce Software, Inc.roguewave.com
Attach to Process19 Rogue Wave by Perforce 2019 Perforce Software, Inc.roguewave.com
Attach to Process – Enable Replay Engine20 Rogue Wave by Perforce 2019 Perforce Software, Inc.roguewave.com
Open a Core File21 Rogue Wave by Perforce 2019 Perforce Software, Inc.roguewave.com
Open a Core File22 Rogue Wave by Perforce 2019 Perforce Software, Inc.roguewave.com
Process Control & Navigation
Interface ConceptsRoot Window State of all processes beingdebugged Process and Thread status Instant navigation access Sort and aggregate bystatus24 Rogue Wave by Perforce 2019 Perforce Software, Inc.roguewave.com
Process Window OverviewToolbarStack Trace PaneStack Frame PaneProvides detailed state ofone process, or a singlethread within a processSource PaneA single point of controlfor the process and otherrelated processesTabbed Area25 Rogue Wave by Perforce 2019 Perforce Software, Inc.roguewave.com
Stepping CommandsBased onPC location
Action PointsBreakpointsBarrier PointsConditional BreakpointsEvaluation PointsWatchpoints27 Rogue Wave by Perforce 2019 Perforce Software, Inc.roguewave.com
Conditional Breakpoint28 Rogue Wave by Perforce 2019 Perforce Software, Inc.roguewave.com
Evaluation Point – Test Fixes on the Fly! Test small source code patchesCall functionsSet variablesTest conditionsC/C or FortranSome limitations: Can’t use C constructors29 Rogue Wave by Perforce 2019 Perforce Software, Inc.roguewave.com
WatchpointsWatchpoints are set on a fixed memory regionUse Tools Watchpoint from a Variable Window orFrom source pane with contextual menuWhen the contents of watched memorychange, the watchpoint is triggered andTotalView stops the program.Watchpoints are not set on a variable.You you need to be aware of thevariable scope.Watchpoints can be conditional orunconditionalUses Hardware Watchpoints withvarious limitations based onarchitecture30 Rogue Wave by Perforce 2019 Perforce Software, Inc.roguewave.com
Advanced C and Data Debugging
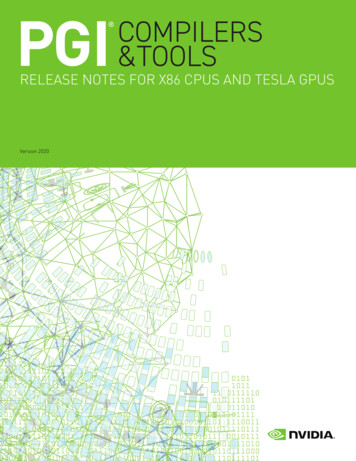
Advanced C and Data Debugging TotalView supports debugging the latest C 11/14features including:– lambdas, transformations for smart pointers,auto types, R-Value references, range-basedloops, strongly-typed enums, initializer lists,user defined literals TotalView transforms many ofthe C and STL containers suchas: array, forward list, tuple,map, set, vector andothers.Insteadof ThisSee This!
Array Slicing, Striding and Filtering (classic UI) Slicing – reduce display to a portion of the array [lower bound:upper bound] [5:10] Striding – Skip over elements [::stride] [::5], [5:10:-1] Filtering– Comparison: , ! , , , , – Range of values: [ ] lowvalue : [ ] high-value– IEEE values: nan, inf, denorm33 Rogue Wave by Perforce 2019 Perforce Software, Inc.roguewave.com
Array Statistics Easily display a set of statistics for thefiltered portion of your array34 Rogue Wave by Perforce 2019 Perforce Software, Inc.roguewave.com
Visualizing Array Data Visualizer creates graphic images of your program’sarray data. Visualize one or two dimensional arrays View data manually through the Window Visualizecommand on the Data Window Visualize data programmatically using the visualizefunction35 Rogue Wave by Perforce 2019 Perforce Software, Inc.roguewave.com
Dive in All Dive in All Use Dive in All to easily see each member of a data structure from an array of structures36 Rogue Wave by Perforce 2019 Perforce Software, Inc.roguewave.com
Looking at Variables Across Processes TotalView allows you to look at the value of avariable in all MPI processes Right Click on the variable Select the View View AcrossTotalView creates an arrayindexed by processYou can filter and visualizeUse for viewing distributed arrays as well.You can also View Across Threads37 Rogue Wave by Perforce 2019 Perforce Software, Inc.roguewave.com
Multi-Thread and Multi-Process Parallel Debugging
In the Parallel Program Session select:Select: MPI preferencenumber of tasksnumber of nodesstarter arguments then save all this in Session39 Rogue Wave by Perforce 2019 Perforce Software, Inc.roguewave.com
Stepping Commands40 Rogue Wave by Perforce 2019 Perforce Software, Inc.roguewave.com
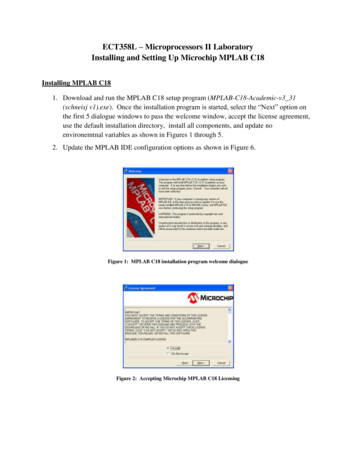
Message Queue Graph Hangs &Deadlocks PendingMessages Receives Sends Unexpected Inspect Individualentries Patterns41 Rogue Wave by Perforce 2019 Perforce Software, Inc.roguewave.com
Find Deadlocks and Performance Sinks Filtering– Choose messages to track– Choose MPI Communicators Cycle detection Sink42 Rogue Wave by Perforce 2019 Perforce Software, Inc.roguewave.com
Reverse Debugging
Reverse DebuggingReplay Engine – The right way to debugStep forward over functionsStep backward over functionsStep forward into functionsStep backward into functionsAdvance forward out of currentFunction, after the callAdvance backward out of currentFunction, to before the callAdvance forward to selected lineAdvance backward to selected lineRun forwardRun backwardAdvance forward to “live” session44 Rogue Wave by Perforce 2019 Perforce Software, Inc.roguewave.com
ReplayEngine Captures execution history Records all external input toprogram Records internal sources of nondeterminism Replays execution history Examine any part of the executionhistory Step back as easily as forward Jump to points of interest An add-on product to TotalView Support for Linux/x86 Linux x86- 6445 Rogue Wave by Perforce 2019 Perforce Software, Inc.roguewave.com
Memory Debugging
Memory Debugging TotalView’s memory debugging technology allows you to Easily find memory leaks and other memory errors Detect malloc/free new/delete API misuse Dangling pointer detection Detect buffer overruns Paint memory blocks on allocation and deallocation Memory debugging results can be easily shared as HTML reports or raw memory debugging files. Compare memory results between runs to verifyelimination of leaks Supports parallel applications Low overhead and does not require recompilation orinstrumentation47 Rogue Wave by Perforce 2019 Perforce Software, Inc.roguewave.com
Strategies for Parallel Memory Debugging Run the application and see if memory events are detectedView memory usage across the MPI job Compare memory footprint of the processes Are there any outliers? Are they expected? Gather heap information in all processes of the MPI job Select and examine individually Look at the allocation pattern.Does it make sense? Look for leaks Compare with the 'diff' mechanism Are there any major differences?Are they expected?48 Rogue Wave by Perforce 2019 Perforce Software, Inc.roguewave.com
GPU Debugging
GPU debugging with TotalView NVIDIA CUDA support– Multiple platforms : X86-64,PowerLE, ARM64– Multiple cards: from Jetson to Turing Features and capabilities include– Support for dynamic parallelism– Support for MPI based clusters and multi-card configurations– Flexible Display and Navigation on the CUDA device Physical (device, SM, Warp, Lane) Logical (Grid, Block) tuples– CUDA device window reveals what is running where– Support for CUDA Core debugging– Leverages CUDA memcheck– Support for OpenACC50 Rogue Wave by Perforce 2019 Perforce Software, Inc.roguewave.com
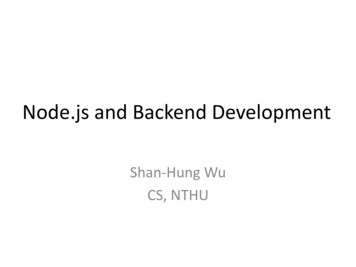
GPU Debugging Model Improvements First in class UnifiedSource debugging Improves andstreamlines debuggingCUDA applications Set breakpoints in CPU and GPU kernelcode before it is launched on the GPU Compare variables in CPUand GPU code together
CUDA Debugging Demo
Extending Debugging Capabilities:How to Debug (AI) Mixed Python/C Code
Debugging multiple languages Debugging one language is difficult enough Especially with many threads/processes The language intersection is tougher Data comparison Glue code Issues are: Type mismatches Extraneous stack frames55 Rogue Wave by Perforce 2019 Perforce Software, Inc.roguewave.com
Python debugging with TotalView (New GUI only) What TotalView provides: Easy Python debugging session setup Fully integrated Python and C/C call stack ”Glue” layers between the languages removed Easily examine and compare variables in Python and C Utilize reverse debugging and memory debugging What TotalView does not provide (yet): Setting breakpoints and stepping within Python code56 Rogue Wave by Perforce 2019 Perforce Software, Inc.roguewave.com
Demo#!/usr/bin/pythondef callFact():import tv python example as tpa 3b 10c a bch “local string” return tp.fact(a)if name ' main ’:b 2result callFact()print result
totalview -args python test python types.py
Python without special debugger supportNo viewing of Pythondata and code59 Rogue Wave by Perforce 2019 Perforce Software, Inc.Gluecoderoguewave.com
Showing C code with mixed data Glue code filtered out Python data and codeavailable for viewingShows Python & C C dataPy data60 Rogue Wave by Perforce 2019 Perforce Software, Inc.roguewave.com
Remote Display Debugging
Remote Display Client (RDC) Offers users the ability to easily set up and operate a TotalView debug session that is running on another system Consists of two components Client – runs on local machine Server – runs on any system supported by TotalView and “invisibly” manages the secure connection betweenhost and client Free to install on as many clients as needed Remote Display Client is available for: Linux x86, x86-64 Windows Mac OS X62 Rogue Wave by Perforce 2019 Perforce Software, Inc.roguewave.com
Remote Display Client63 Rogue Wave by Perforce 2019 Perforce Software, Inc.roguewave.com
Remote Display Client (Argonne NL)64 Rogue Wave by Perforce 2019 Perforce Software, Inc.roguewave.com
Summary Use of modern debugger saves you time. TotalView can help you because: It’s cross-platform (the only debugger you ever need) Allow you to debug accelerators (GPU) and CPU in one session Allow you to debug multiple languages (C /Python/Fortran)65 Rogue Wave by Perforce 2019 Perforce Software, Inc.roguewave.com
Using TotalView for Parallel Debugging on ANL
Starting a MPI job – method 1For HPC we have two methods to start the debuggerThe ‘classic’ method totalview –args mpiexec –np 512 ./myMPIprog myarg1 myarg2 This will start up TotalView on the parallel starter (mpiexec, srun, runjob, etc) and when you hit ‘Go’ the job will start up andthe processes will be automatically attached. At that point you will see your source and can set breakpoints. Some points to consider You don’t see your source at first, since we’re ‘debugging’ the mpi starter Some MPI’s don’t support the process acquistion method (most do, but might be stripped of symbols we need when packaging) In general more scalable than the next method.67 Rogue Wave by Perforce 2019 Perforce Software, Inc.roguewave.com
Starting a MPI job – method 2The ‘indirect’ method Simply ‘totalview’ or ‘totalview myMPIprog’ and then you can choose a parallel system,number of tasks, nodes, and arguments to the program. With this method the program source is available immediately Less dependent on MPI starter symbols May not be as scalable as some ‘indirect’ methods launch adebug server per process68 Rogue Wave by Perforce 2019 Perforce Software, Inc.roguewave.com
Using TotalView at Argonne TotalView available on Theta, Vesta, Mira, Cooley Installed totalview.2019T.2.7/bin/totalview module load totalview Download and install RDC from es/remote-display-client Connect to Theta Get allocation first On Theta :qsub -A ATPESC2019 –n N –q debug-flat-quad –I Module load totalview totalview -args aprun –np N .69 Rogue Wave by Perforce 2019 Perforce Software, Inc.roguewave.com
TotalView Resources and Documentation
TotalView Resources & Documentation TotalView documentation: /en/current/ User Guides: Debugging, Memory Debugging and Reverse Debugging Reference Guides: Using the CLI, Transformations, Running TotalView TotalView online HTML doc: ndex.html Other Resources (Blogs, videos, white papers, etc): https://www.roguewave.com/resources?tagid 18 New UI resources: Reference CodeDynamics tation/codedynamics New UI videos: namics/videos Python Debugging blog: lenge-debugging-python-and-cc-applications/71 Rogue Wave by Perforce 2019 Perforce Software, Inc.roguewave.com
Questions/Comments Any questions or comments? Don’t hesitate to reach out to me directly with any problems or suggestions! Email: nikolay.piskun@roguewave.com Thank you for your time today!72 Rogue Wave by Perforce 2019 Perforce Software, Inc.roguewave.com
RogueWave by Perforce 2019 Perforce Software, Inc.
Techniques for Debugging HPC Applications NIKOLAY PISKUN , DIRECTOR OF CONTINUING ENGINEERING, TOTALVIEW PRODUCTS AUGUST 7 2019, ATRESC 2019 . Use for viewing distributed arrays as well. . Remote Display Client (RDC) Offers users the ability to easily set up and operate a