Transcription
TRACE32 as GDB Back-EndRelease 09.2021MANUAL
TRACE32 as GDB Back-EndTRACE32 Online HelpTRACE32 DirectoryTRACE32 IndexTRACE32 Documents . GDB Support . TRACE32 as GDB Back-End .1Introduction .3Documentation Updates3Related Documents3Supported Architectures .4Operation Theory and Restrictions .5TRACE32 Setup .6Configuration File6T32Start7GDB Front-Ends Setup .8The GNU Project Debugger GDB8Eclipse10Microsoft Visual Studio13Visual Studio Code15Remote Serial Protocol .18Protocol Extensions18Symmetrical Multiprocessing Support18 1989-2021 Lauterbach GmbHTRACE32 as GDB Back-End 2
TRACE32 as GDB Back-EndVersion 04-Nov-2021IntroductionTRACE32 PowerView implements a GDB stub functionality. This provides an interface to any applicationusing the GDB Remote Serial Protocol (RSP) to control TRACE32 PowerView via TCP or UDP.For the end users, this document presents: The supported target architectures. The operation theory of the GDB back-end and the solution restrictions. How to configure TRACE32 as a GDB back-end. TRACE32 integration to some example front-ends via the GDB interface.For the users interested in the integration of TRACE32 with their custom GDB front-end, this documentpresents the limitations of the RSP and the protocol extensions defined to overcome them.For information about using TRACE32 to debug e.g a virtual target over its GDB stub or to debug anapplication over gdbserver, please refer to “TRACE32 as GDB Front-End” (frontend gdb.pdf).Documentation UpdatesThe latest version of this document is available for download from:www.lauterbach.com/pdf/backend gdb.pdfRelated Documents For information about how to install TRACE32, see “TRACE32 Installation Guide”(installation.pdf). For information about TRACE32 configuration, please refer to “Debugger Basics - Training”(training debugger.fm). 1989-2021 Lauterbach GmbHTRACE32 as GDB Back-End 3
Supported ArchitecturesThe TRACE32 GDB stub is supported for the following architectures: 68K/ColdFire 8051/XC800/M51 Arm (32 and 64 bit) GTM Intel x86/x86 64 MicroBlaze MIPS32/MIPS64 PowerArchitecture (32 and 64 bit) RISC-V SuperH TriCore V850/RH850 XtensaOther architectures could be supported on demand. Please send your request tosupport@lauterbach.com 1989-2021 Lauterbach GmbHTRACE32 as GDB Back-End 4
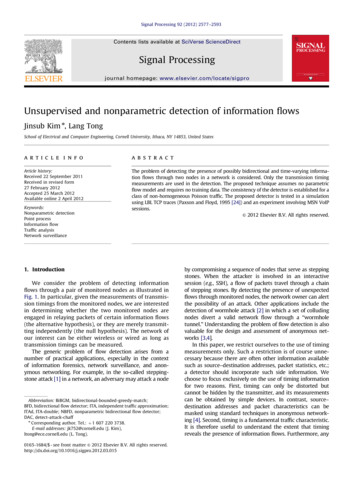
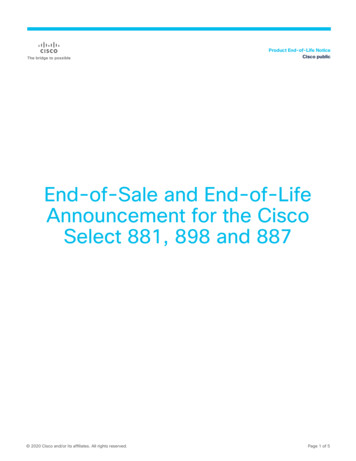
Operation Theory and RestrictionsTRACE32 PowerView receives commands from the remote GDB front-end, executes them and sendsthe response back to the front-end.TRACE32 PowerViewGDBProtocol: TCFUSB/Link: TCP/IPNETThe GNU ProjectDebuggerGDB Front-EndTRACE32 HardwareTRACE32 PowerViewas a GDB Back-EndThe Communication to TRACE32 PowerView is implemented as a socket interface. This means, that theGDB front-end and TRACE32 PowerView can reside on two different hosts, using network connections forthe communication. TRACE32 PowerView routes the GDB requests to the TRACE32 hardware. The answerto the request goes exactly the opposite way, returning information to the GDB front-end.The GDB requests are operated just beside normal TRACE32 operation. You can use both, TRACE32PowerView and the GDB front-end interchangeable, although it is not recommended. The GDB front-endwon't be informed about changes that are done in TRACE32 PowerView.Due to some limitations of the Remote Serial Protocol, extended TRACE32 functionality like trace views,MMU views and OS-aware debugging is not supported. 1989-2021 Lauterbach GmbHTRACE32 as GDB Back-End 5
TRACE32 SetupConfiguration FileTo configure TRACE32 PowerView as GDB back-end you need to add the following lines to your TRACE32configuration file. The default configuration file is config.t32 and is located in the TRACE32 system directory. - mandatory empty line - optional comment line;T32 GDBGDB NETASSISTPACKLEN 1024PORT 30000PROTOCOL TCP - mandatory empty linePACKLEN This specifies the maximum package length in bytes for the socket communication.Optional: the value default is 1024.PORT This specifies the port number for the communication.Optional: the default value is 30000.PROTOCOL This specifies the used protocol (TCP or UDP);Optional: the default protocol is TCP.An empty line is mandatory before and after the GDB block in theTRACE32 configuration file, otherwise, a “syntax error” will be reportedwhen starting TRACE32.TRACE32 could be configured to start as a hidden instance, For more information, please refer to“TRACE32 Installation Guide” (installation.pdf). 1989-2021 Lauterbach GmbHTRACE32 as GDB Back-End 6
T32StartIn case you are using the t32start utility to start TRACE32, you can enable the GDB interface underAdvanced Settings Interfaces GDB Port.Please refer to the “T32Start” (app t32start.fm) manual for more information about the t32Start utility. 1989-2021 Lauterbach GmbHTRACE32 as GDB Back-End 7
GDB Front-Ends SetupTRACE32 PowerView could be controlled by any front-end that supports the GDB Remote Serial Protocol.This section presents some examples of third party tools that could be configured to control TRACE32PowerView via its GDB stub.The GNU Project Debugger GDBIn the following example gdb-multiarch is used. The other alternative, is to use the appropriate gdb for theselected architecture: gdb-multiarch GNU gdb (Ubuntu 7.11.1-0ubuntu1 16.5) 7.11.1Copyright (C) 2016 Free Software Foundation, Inc.1.Make sure that you set the correct architecture. In this example, the architecture arm is used tocontrol TRACE32 PowerView for Arm:(gdb) set architecture armThe target architecture is assumed to be arm2.Connect to TRACE32 PowerView using TCP. Here the localhost address 127.0.0.1 is used. IfTRACE32 PowerView is started on a different machine than the one running gdb, the remotemachine IP address needs to be used. At this level, there are two different way to start the GDBsession. This depends on the status of the communication between TRACE32 debugger and thetarget:-If the debug communication between TRACE32 and the target is already established.TRACE32 PowerView should show for example “system ready” in the status bar. Then, thecommand target remote needs to be used.(gdb) target remote 127.0.0.1:30000Remote debugging using 127.0.0.1:300000x000011fc in ? ()-If the debug communication between TRACE32 and the target is not yet established.TRACE32 PowerView should show for example “system down” in the status bar. Then, thecommand target extended-remote needs to be used. In the following example, the monitorcommands are used to initiate the communication between TRACE32 and the target. Formore details please see Monitor Commands.(gdb) target extended-remote 127.0.0.1:30000Remote debugging using 127.0.0.1:30000(gdb) monitor B::SYStem.CPU CortexA9(gdb) monitor B::SYStem.Up 1989-2021 Lauterbach GmbHTRACE32 as GDB Back-End 8
3.Now you can continue debugging using the GDB command line. E.g:-Set the symbol file relative to the application loaded into the target memory(gdb) symbol-file sieve.elfReading symbols from sieve.elf.done.-Set a breakpoint(gdb) break sieveBreakpoint 1 at 0x15e6: file ./src/sieve.c, line 798.-Continue the program execution(gdb) continueContinuing.Breakpoint 1, sieve () at ./src/sieve.c:798798count 0;Monitor CommandsThe TRACE32 GDB stub supports the following monitor commands:helpThe command “monitor help” returns the string “TRACE32”B:: cmd Execute a TRACE32 PRACTICE command.Example: “monitor B::Var.set mcount 1”eval func Get the return value of a PRACTICE function.Example: “monitor eval Register(PC)”Practice-StateThe command “monitor Practice-State” returns the run-state ofPRACTICE.0: not running1: running2: dialog window openset step-mode [hll asm]Execute an assembly or high-level single step when getting a GDB RSPstep packet. Default is asm.sync [on off]Enable / disable the software component that allows a TRACE32instance to connect to other instances by executing the TRACE32command SYnch.ON or SYnch.OFF. 1989-2021 Lauterbach GmbHTRACE32 as GDB Back-End 9
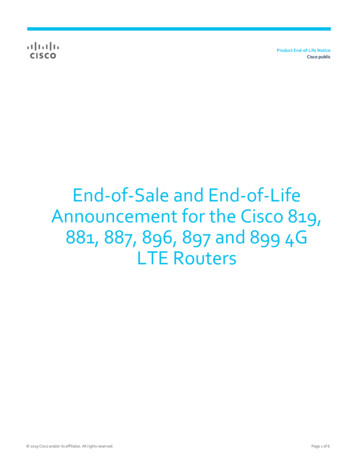
default-reset[core system]core: execute the command SYStem.Option.EnReset OFF.system: execute the command SYStem.Option.EnReset ON.reset debugExecute a SYStem.Mode Up.Examples:(gdb) monitor helpTRACE32(gdb) monitor eval Var.Value(mcount)00000792(gdb) monitor B::Data.Set 0x100 %Long 0(gdb) monitor eval Var.Value(mcount)00000000(gdb) monitor B::QUITRemote connection closedEclipseIt is possible to control TRACE32 PowerView via its GDB stub from Eclipse. However, it is recommended touse the Target Communication Framework (TCF) instead, since it offers more features. For more details,please refer to “TRACE32 as TCF Agent” (app tcf setup.pdf).The following screenshots are generated using Eclipse IDE for C/C Developers, Oxygen.2 Release(4.7.2).You need to configure Eclipse as follows:1.Add a debug configuration for remote application to your Eclipse work space. In the DebugConfigurations window, you need to select the configuration “GDB (DSF) manual RemoteDebugging Launcher”. 1989-2021 Lauterbach GmbHTRACE32 as GDB Back-End 10
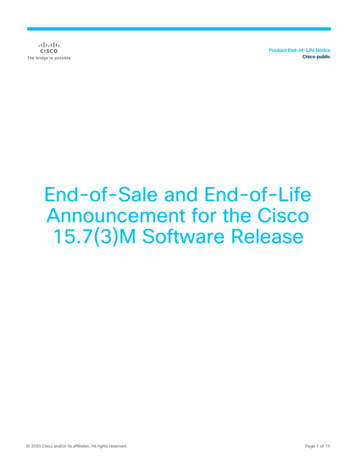
2.In the Debugger tab, select your GDB debugger according to your target architecture.3.Set up the connection configuration according to your TRACE32 PowerView setup.-Set the Host name or IP address of the machine running the TRACE32 PowerView instance. 1989-2021 Lauterbach GmbHTRACE32 as GDB Back-End 11
4.Set the Port number according to the GDB port configuration of the PowerView instance.Before you try to start debugging from Eclipse, you need to make sure that the debugcommunication between TRACE32 and the target is already established. TRACE32 PowerViewshould show for example “system ready” in the status bar. 1989-2021 Lauterbach GmbHTRACE32 as GDB Back-End 12
Microsoft Visual StudioStarting from Microsoft Visual Studio 2015, it is possible to install the GDB Debugger extension for VisualC . This introduces a new project type, that provides additional project properties and allows to connectthe Visual Studio debugger to a GDB stub.The following screenshots are based on Microsoft Visual Studio Professional 2015.You need to configure Visual Studio as follows:1.Create a new project by selecting the template “Makefile Project (GDB)”.2.Set up the debugging configuration on the project properties page:-Chose the item Local GDB.-Set up the correct GDB debugger executable according to your target architecture. In thisexample, a configuration for Arm architecture is used.-Configure the Local Debugger Server Address with the IP address or host name of themachine, running the TRACE32 PowerView instance, and the GDB port number of theTRACE32 PowerView instance. 1989-2021 Lauterbach GmbHTRACE32 as GDB Back-End 13
3.Make sure that the debug communication between TRACE32 and the target is alreadyestablished. The TRACE32 PowerView should show for example “system ready” in the statusbar. 1989-2021 Lauterbach GmbHTRACE32 as GDB Back-End 14
Visual Studio CodeYou need to configure Visual Studio Code as follows to establish a connection with TRACE32 PowerView:1.Make sure the Native Debug extension for Visual Studio Code is installed.2.Select the menu Debug Add Configuration then select GDB.3.Set the correct values under “gdbpath”, “target” and “autorun”.{"version": "0.2.0","configurations": [{"name": "Debug","type": "gdb","request": "launch",// set the path to the project’s ELF file:"target":" {workspaceRoot}/sieve.elf",// set the path to the gdb executable on the host:"gdbpath": "C:/ARMGCC/bin/arm-none-eabi-gdb.exe","cwd": " {workspaceRoot}","valuesFormatting": "parseText","autorun": [// connect to TRACE32 PowerView listening to port// number 3000"target remote localhost:30000",// load the debug symbols in VSCode"symbol-file {workspaceRoot}/sieve.elf",]}]} 1989-2021 Lauterbach GmbHTRACE32 as GDB Back-End 15
4.Start TRACE32 PowerView with a startup script in order to establish connection with the target.Example:C:\T32\bin\windows64\t32marm.exe -s \C:\T32\demo\arm\compiler\gnu\demo sram.cmm5.To start debugging, select the menu Debug Start or press F5.You can additionally replace the TRACE32 built-in editor call with a call to the Visual Studio Code editorusing the command SETUP.EDITEXT:SETUP.EDITEXT ON " path to vscode \Code.exe -g ""*:#""" 1989-2021 Lauterbach GmbHTRACE32 as GDB Back-End 16
If you do the a right mouse click in the TRACE32 List window then select Edit Source, the file will bedisplayed in Visual Studio Code on the selected line number. 1989-2021 Lauterbach GmbHTRACE32 as GDB Back-End 17
Remote Serial ProtocolTRACE32 GDB stub supports almost all the packets defined by the Remote Serial Protocol except somepackets that are generally not needed to control TRACE32 PowerView via the GDB stub.If you need theexhaustive list of the supported packets please send a request to support@lauterbach.com.Protocol ExtensionsThe Remote Serial Protocol does not provide a way to distinguish between different memory types.When the RSP protocol is used to communicate with a GDB stub other than the GNU gdbserver, thememory address is not always sufficient to identify a unique physical memory location. Depending onthe access mode, the same memory address could refer to different physical memory locations (e.g.secure/non secure memory for Arm architecture). To overcome these limitations, Lauterbach hasdefined a protocol extension: A packet to read length addressable memory of type defined by access class starting ataddress address .qtrace32.memory: access class , address , length A packet to write length addressable memory of type defined by access class starting ataddress address . The data is given by values ; each byte is transmitted as a two-digithexadecimal number.Qtrace32.memory: access class , address , length , values If the TRACE32 software version implements this protocol extension, it should include the string”qtrace32.memory ;Qtrace32.memory ” in the reply to the “qSupported” packet.The available access classes are dependent on the processor architecturein use. Therefore refer to the Access Class/Memory Class section of yourProcessor Architecture Manual for more details.Symmetrical Multiprocessing SupportIn order to support Symmetrical Multi-Processing (SMP) debugging over the GDB interface, TRACE32considers each core from an SMP system as a thread. Thus, all the RSP packets relative to the multi-threadhandling are used for multi-core handling. 1989-2021 Lauterbach GmbHTRACE32 as GDB Back-End 18
the Visual Studio debugger to a GDB stub. The following screenshots are based on Microsoft Visual Studio Professional 2015. You need to configure Visual Studio as follows: 1. Create a new project by selecting the template “Makefile Project (GDB)”. 2. Set up the debugging configuration on