Transcription
SEISMIC ASSESSMENT OF EXISTING CHEVRON BRACED FRAMESDESIGNED IN ACCORDANCE WITH THE 1980 CANADIAN CODEREQUIREMENTSYasaman BALAZADEH MINOUEI1, Sanda KOBOEVIC2 and Robert TREMBLAY3ABSTRACTThe seismic deficiencies of a 10-storey steel braced frame located in Vancouver, British Columbia,designed in accordance with the 1980 National Building Code of Canada and the CSA-S16.1-M78steel design standard were evaluated using the nonlinear procedure defined in the ASCE 41-13standard. Nonlinear time-history analysis of the tension-compression chevron-braced frame wasperformed for a set of seven historical ground motion records compatible with the NBCC designspectrum. When the inelastic response of braces was represented in the model, buckling of the braceswas predicted at the lower levels of the structure. Beam buckling at the lower levels of the buildingwas observed when inelastic beam response was included in the model. Beam buckling in chevronbraced frames is further investigated using different types of analytical models.INTRODUCTIONThe seismic design provisions were introduced in the National Building Code of Canada (NBCC) in1941 (Mitchell et al., 2010). Seismic design and detailing provisions for steel structures wereintegrated into the CSA S16 design standard in 1989. In previous editions of CSA S16, ductilebehaviour was not explicitly taken into account in seismic design. As the understanding of seismicbehaviour gradually increased over the years based on experiences from past earthquakes andextensive research studies, design provisions have been continuously updated (Tremblay 2011). Thelatest Canadian building code, NBCC 2010 (NRCC 2010), and steel design standard CSA S16-09(CSA 2009) reflect the most recent findings in the area of seismic engineering and are comparable toseismic design norms of other countries.In the 1980’s, prior to the implementation of seismic requirements in CSA S16, steel bracedframes with tension-only bracing and chevron bracing systems were the most common types of lateralload resisting system used in steel buildings in Canada. The bracing members were usually made ofback-to-back double angle sections while beams and columns were selected from W-shaped sections. Atthe brace ends, back-to-back legs were connected to single vertical gusset plates using high strengthbolts. Steel concentrically braced frames designed in accordance with the provisions of the 1980NBCC (NRCC 1980) and the CSA-S16.1-M78 steel design standard (CSA 1978) are likely to exhibitsevere seismic deficiencies due to the absence of any explicit consideration of special seismic detailing1Graduate student, Ecole Polytechnique of Montreal, Montreal, yasaman.balazadeh-minouei@polymtl.caAssistant Professor, Ecole Polytechnique of Montreal, Montreal, sanda.koboevic@polymtl.ca3Professor, Ecole Polytechnique of Montreal, Montreal, robert.tremblay@polymtl.ca21
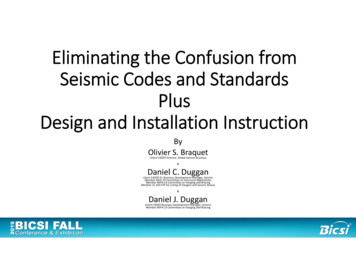
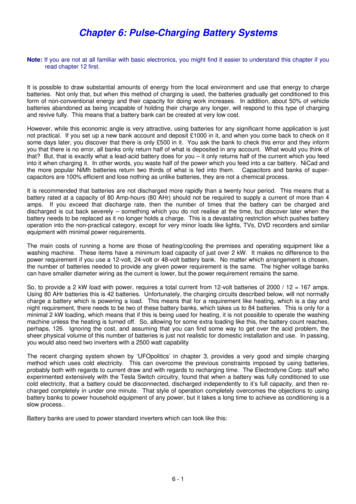
requirements in their design. The seismic assessment of steel braced frame structures used in aprototype 10-storey building located in Vancouver, British Columbia, was carried out in a previousstudy (Jiang et al., 2012a). The response of the structure was evaluated using the results of theresponse spectrum analysis as specified in the NBCC 2010. The resistance of the structural elementsand connections was calculated in according with the CSA-S16-09 provisions. The results obtained fortension-compression chevron braced frame showed that none of the structural elements includingbraces, columns and beams had sufficient capacity. In addition, the brace connections had inadequatestrength. The governing failure mode for all brace connections was block shear failure.In this paper, the seismic response of a tension-compression chevron-braced frame is furtherstudied by conducting the seismic assessment based on results of nonlinear analysis. The structure isassessed following the procedure detailed in the ASCE 41-13 standard (ASCE 2013). This U.S.standard provides requirements for the analysis and assessment of existing buildings and includesacceptance criteria for the structural components. The Tier 3 systematic evaluation procedure isfollowed to assess the behaviour at the collapse prevention structural performance level for 2% in 50years hazard, which corresponds to the basic NBCC performance objective in the 2010 NBCC.Member capacities are determined using the provisions of the current CSA S16-09 steel designstandard. The structure is analysed using the nonlinear dynamic procedure proposed in the ASCE 41standard. Different numerical modelling techniques are applied to assess the seismic demand on thestructure, and examine the effect of nonlinearity of different structural members on the global seismicresponse of the building. The nonlinear analysis is carried out for a group of seven historical groundmotion records scaled to match the NBCC design spectrum. The study focuses on the response ofbraces and beams. For the beams, it is found that in-plane buckling could occur. This failure mode hasnot been investigated in past studies. The response of the beams is further investigated by using fivedifferent types of beam models.DESIGN OF THE BUILDING STUDIEDThe plan view and frame elevation of the studied 10-storey building is illustrated in Fig.1. Thestructure was designed according to the design provisions of the 1980 NBCC and the CSA-S16.1-M78steel design standard. Because of the large differences between the level of design seismic loadsproposed in the NBCC 1980 and those specified in the 2010 NBCC, NBCC 1980 was chosen to designthe building. The studied structure is located in Vancouver, British Colombia. It is situated on firmground site which classifies for foundation factors F 1.0 (NBCC 1980) or Fa Fv 1.0 (NBCC2010). The importance factor for the building, I, was taken as one. Chevron bracing was used in E-Wdirection whereas tension-only braced frames with diagonals in the X configuration were selected inthe N-S direction. The fundamental period was estimated using the Rayleigh method, as would havebeen done in practice in the 1980’s. The periods of the chevron braced and X-braced frames are 2.00 sand 2.77 s, respectively. The obtained periods are significantly longer than the 0.54 s value calculatedusing the NBCC empirical expression, Temp 0.09hn/D0.5where hn 40.23 m and D 45.72 m. Theequivalent static force procedure was applied to determine earthquake effects as permitted in NBCC1980 for regular structures. The seismic base shear of the structure was determined from:V ASKIFW(1)In this equation, A is the design acceleration ratio, S is the seismic response factor ( 0.5/T0.5), Kis a coefficient calculated based on the type of construction, I is the importance factor, F is thefoundation factor and W is the seismic weight. For this study, A 0.08, I 1.0, F 1.0, W 83756 kNfor the entire building, and K 1.0 and 1.3 for the tension-compression and tension-only bracing,respectively. The resulting seismic force coefficients, V/W, are equal to 0.029 and 0.032 for thechevron bracing and tension-only bracing systems, respectively. To account for higher mode effects,which are likely to impact the response of this taller building, a concentrated lateral force, Ft 7.74%V, was applied at the roof level. The remaining seismic load, V – Ft, was distributed along the heightof the structure as a function of the relative product of the storey seismic weight and height measured2
Y.Balazadeh Minouei, S.Koboevic and R.Tremblay3from the ground up to the level under consideration. In-plane torsion and P-delta effects wereconsidered in design. The overturning moment reduction factor, J, was taken equal to 1.0.The frames of the 10-storey building were designed based on the requirements of CSA-S16.1M78. The structural members were made of CSA-G40.21-300W steel (Fy 300 MPa, Fu 450 MPa).All bracing members were double angle sections with equal leg angles in back-to-back position. Class3 sections were used for the bracing members to control width-to-thickness ratios, as prescribed inCSA-S16.1-M78. For chevron bracing members, the overall slenderness ratio was limited to 200. Onestitch was also placed at the mid-length of the bracing members to satisfy the CSA-S16.1-M78slenderness provision. The back-to-back legs of the angles were connected to single vertical gussetplates using high strength A325 bolts, 19.1 mm in diameter. The design of the bracing members wasgoverned by axial strength requirements, except at the roof level where selection of the braces wasgoverned by maximum brace overall slenderness limits. For these over strong braces, connectiondesign was controlled by the 50% Cr or Tr minimum force requirement, which resulted in beneficialoverstrength. CSA S16.1-M78 did not consider shear lag effects and the block shear failure mode forsuch bolted connections; therefore, the brace connections were smaller compared to current braceconnection designs. The beams and columns were selected from W sections, and the columns weretiered in two-storey segments. The beams were assumed to be laterally supported by the floors andthus were selected to resist shear and flexure from gravity loads and strong-axis buckling undercombined axial compression and bending.b)X-BracingChevron Bracing45725 @ 9144 45 7209 @ 3962 35 658N5 @ 9144 45 720Note: All dimensions in mmX-BracingChevron BracingFigure 1. Plan view and braced frame elevations of the 10-storey buildingNUMERICAL MODELLINGAccording to the ASCE 41 standard, a two dimensional model can be used to perform an analysis ifthe structure has rigid diaphragms and the displacement multiplier due to total torsional moments doesnot exceed 1.5 at any floor. The displacement multiplier is the ratio of the maximum displacement atany point on the floor diaphragm to the average displacement (δmax/δavg). Accidental torsion should beconsidered in the analysis unless it can be shown that the accidental torsional moment is less than 25%of the inherent torsional moment in the building or the displacement multiplier calculated for theapplied loads and accidental torsion is less than 1.1 at every floor. In this study, the maximum value ofthe displacement multiplier was 1.09. Consequently, it was possible to use a two-dimensional modelfor the nonlinear analysis and accidental torsion effects could be neglected.The analytical model of the studied frame was developed in the OpenSees finite elementstructural analysis platform (McKenna and Fenves 2004). Two modelling approaches, named Model Band Model C, were considered to evaluate the seismic behaviour of the structural members. In ModelB, nonlinear beam-column elements were used for the braces whereas elastic beam-column elementswere used for the beams and columns. This model permitted partial study of the nonlinear frameresponse accounting only for the cyclic tensile yielding and inelastic buckling of the braces. Each
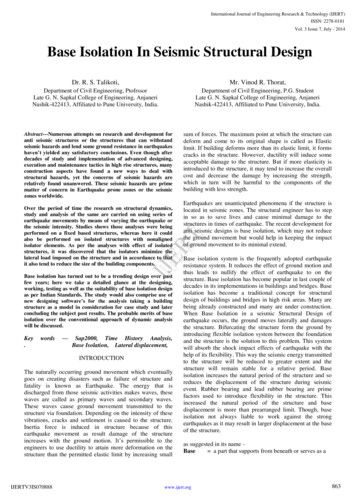
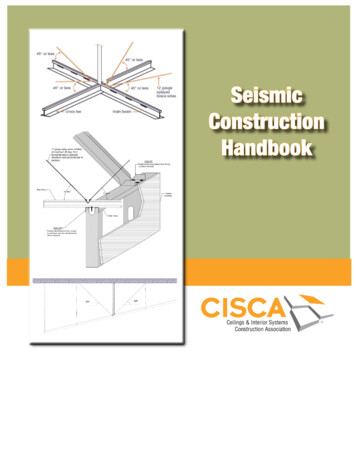
brace member was modelled using 16 nonlinear beam-column elements, with 4 integration points perelement (Bertero 2004) and fiber discretization of the section to reproduce distributed plasticity. Thetwo series of angle elements were connected at their ends and at the locations of the stitch connectorsplaced at mid-length of the bracing members. In the connection zone, the double angle sections werelinked to each other by means of elastic beam column elements with high axial and flexural stiffness.The connections of the braces to the gusset plates were represented by zero-length elements. Toreproduce the nonlinear behaviour of braces, the Giuffré-Menegotto-Pinto (Steel 02) material withkinematic and isotropic hardening properties was assigned to the fibers representing the angle crosssections. Initial out-of-straightness and residual stresses were also considered (Balazadeh-Minouei etal., 2013; Jiang et al., 2012b). Elastic beam elements were used to model the beams and columns inorder to evaluate the elastic force demand on these members. Actual flexural and axial stiffnessproperties of beams and columns were assigned to the beam-column elements and a zero-lengthelement with high axial stiffness and negligible flexural stiffness was considered to model the beamcolumn connections. Column bases were assumed to be pinned.In Model C, nonlinear beam-column elements were used for both the braces and the beams. Thecolumns were represented by elastic beam elements. Similarly to the braces in Model B, 16 nonlinearbeam-column elements with 4 integration points placed along each element were used for the beammembers. The cross section of each element was discretized by fibers to which the Steel02 materialwas assigned with a residual stress pattern typical for W shaped sections. Hence, beam inelasticbuckling response and its effects on the braced frame response could be examined. The beams wereassumed to be laterally supported, thus only in-plane flexural buckling was represented. Beam initialin-plane out-of-straightness was assigned in the form of two half-sine waves having maximumamplitude of 1/1000 of half the total beam length. This amplitude corresponds to the fabricationtolerances specified in CSA-S16.1-M78. The inelastic out-of-plane flexural response of the beam-tobrace gusset plate connections was modelled using zero-length elements with fiber discretization andSteel 02 inelastic material properties. Residual stresses were not modelled in the gusset plates.The load combination including gravity load and earthquake effects as specified in the NBCCwas used in the analyses , i.e. 1.0D 0.5L 0.25S 1.0E, where D, L, S and E respectively refer to thedead load, the floor live load, the roof snow load and the earthquake load. To simulate P-Delta effectsin the analyses, a leaning column carrying gravity loads was linked to the braced frame model.GROUND MOTIONSTwenty pairs of two horizontal components of historical ground motions were initially selectedconsidering the magnitude-distance scenarios that contribute the most to the seismic hazard at the site,as proposed by Atkinson (2009). Out of these records, seven pairs of ground motion time historieswith the lowest standard deviation of SAtarg/SAsim and a mean value of SAtarg/SAsim in the 0.5 to 2.0range were retained for further analysis. To scale the records, a square root of the sum of the squares(SRSS) spectrum was constructed for each pair of horizontal ground motion components by taking theSRSS of the 5 percent damped response spectra for the scaled components. The same scaling factorwas used for both components of a pair and each pair was scaled such that the average of the SRSSspectra from all horizontal component pairs fell above the NBCC 2010 spectrum for periods rangingfrom 0.2T to 1.5T, where T is the fundamental period of the structure. For each pair of motions, onecomponent was selected to perform the nonlinear time history analysis of the two-dimensional model.The component that was chosen had the closest standard deviation between the scaled componentscompared to the standard deviation of the average of the SRSS spectra for periods ranging from 0.2Tto 1.5T. The average spectrum from the seven selected scaled components also had to be equal to orexceed the NBCC 2010 spectrum for the period range from 0.2T to 1.5T; otherwise, an additionalscaling factor had to be applied to all seven selected scaled components. The selected records andcomponents are from the 1994 Northridge earthquake (TH01: Castaic Old Ridge Route, 360 , andTH02: Beverly Hills - 14145 Mulhol, 009 ), 1989 Loma Prieta earthquake (TH05: Hollister - South &Pine, 090 , and TH07: Palo Alto - SLAC Lab, 270 ), 1992 Landers earthquake (TH10: Barstow,000 ), 1971 San Fernando (TH12: Hollywood, 090 ) and 1999 Hector Mine earthquake (TH19:Joshua Tree, 360 ) and the final scaling factors for these records are, respectively: 1.485, 1.620, 1.485,4
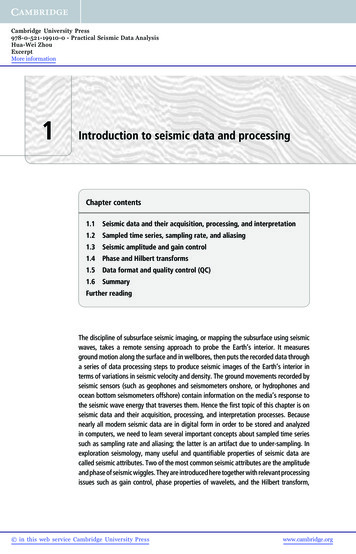
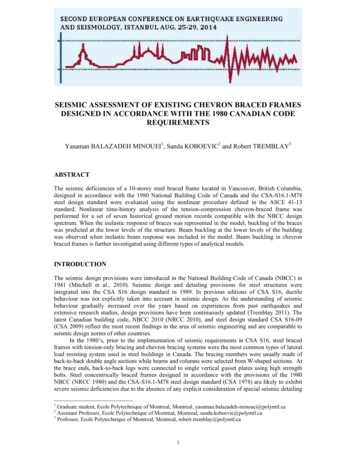
Y.Balazadeh Minouei, S.Koboevic and R.Tremblay51.620, 1.755, 1.755 and 1.890. Figure 2 shows that the average of the SRSS spectra does not fallbelow the NBCC 2010 spectrum for periods ranging from 0.2T to 1.5T. However, the averagespectrum of the seven selected components was below the NBCC 2010 spectrum and a second scalingfactor had to be applied to all components to obtain the average spectrum of seven selected scaledcomponents shown in Fig. 2.1.4NBCC 2010 spectrumAverage of SRSS spectraAverage of 7 selected componentsAverage of 7 selected scaled components1.2Sa (g)10.80.60.40.2000.511.522.533.54Period (s)Figure 2. Scaling of the selected ground motionsASSESSMENT RESULTS OF NONLINEAR ANALYSIS PROCEDUREIn the ASCE 41 standard, the axial tension and compression demands in braces are considered asdeformation-controlled actions, and the acceptance criteria for the braces in the nonlinear procedureare expressed in terms of specific deformation limits. Braces are categorized as primary componentsand evaluated for the collapse prevention performance level. For braces in tension, the limit in ASCE41 is 9ΔT, where ΔT is the axial deformation of the brace at the expected tensile yielding load. For thebraces in compression, the acceptance criteria are 8Δc and 7Δc for slender and stocky compressivebraces, respectively; where, Δc is the axial deformation of the brace at the expected buckling load. Forthe braces, the expected yield strength can be used and a value of 330 MPa was adopted. Resultsobtained for Model B were used to assess the elastic demand on beams, columns and braceconnections. These components are considered as force-controlled. To evaluate beams and columns,the combined axial and flexural force demands were compared to the beam and column forcecapacities using the CSA S16-09 axial-bending interaction equations. The resistance factor was equalto 1.0 and the nominal yield strength was used to calculate the capacities. In Model C, inelasticbuckling of the beams under axial and flexural demands was explicitly verified.The results for one of the critical ground motions (TH02) are presented for models B and C. Thetime histories of the storey drift and axial force demands on the braces at the 1st floor obtained fromModel B are illustrated in Figs. 3a and 3b, respectively. Large storey displacements developed at the1st level as a consequence of buckling of the braces at that level. Buckling of the braces wasaccompanied by high brace axial deformation demand. Figure 3b shows that the strength of the braceconnections in the 1st floor is attained and exceeded several times during the ground motion. In Fig.3c, buckling of the braces at t 5.2 s in the 1st level led to large flexural demand on the beam at thatlevel. The axial load demand on the beam at the 1st floor exceeds the beam nominal compressiveresistance, Cn, at t 3.8 s, before buckling of the braces. Note that beam buckling was not modelled inModel B, and the axial load demand in the beam is compared to the beam nominal compressiveresistance calculated assuming an effective length for in-plane buckling equal to the total beam length.Fig. 3d shows the evaluation of the right-hand side (RHS) column at the 1st floor. As shown, the axialload demand alone exceeds the column nominal axial strength, Cn. In addition, the large storey driftdeveloping in the 1st level as a result of brace buckling induced high flexural demand on the columnsat that level which would also likely contribute to column buckling.
a)0.15BRACE DEMAND TOCAPACITY RATIO0.1STOREY DRIFTb)MODEL B0.050-0.05-0.10-0.5-1MODEL B- LEFT BRACE- Puf/AgFyMODEL B- RIGHT BRACE- Puf/AgFyTn-CONNECTION/AgFyBRACE- Cn/AgFy-1.524TIME (s)68010d)2.5221.5COLUMN DEMAND TOCAPACITY RATIO01.52.5BEAM DEMAND TOCAPACITY RATIO0.5-2-0.15c)110.50-0.5-1MODEL B- Puf/AgFyMODEL B- Cn/AgFy-1.5-202MODEL B- P-M RATIOMODEL B- M/Mn46TIME (s)8246TIME (s)81010.50-0.5MODEL B- Puf/AgFy-1MODEL B- P-M RATIO-1.5Cn/AgFy-2100246TIME (s)810Figure 3. Response time history results from Model B under TH02: a) Storey drift at level 1; b) Brace axial forcedemand at level 1; c) Axial and flexural demands in the beam at level 1; and d) Axial and flexural demands inthe column at level 1.a)0.15BRACE DEMAND TOCAPACITY RATIO0.1STOREY DRIFTb)MODEL C0.050-0.05-0.10-0.5MODEL C- LEFT BRACE- Puf/AgFy-1MODEL C- RIGHT BRACE- Puf/AgFy-1.52.524TIME (s)68Tn-CONNECTION/AgFyBRACE- Cn/AgFyMODEL C- Puf/AgFyMODEL C- P-M RATIOMODEL C- Cn/AgFy21.510-0.5-1-1.5-224TIME (s)d)2.51.5246TIME (s)81081020.50010COLUMN DEMAND TOCAPACITY RATIO0BEAM DEMAND TOCAPACITY RATIO0.5-2-0.15c)1681010.50-0.5MODEL C- Puf/AgFy-1MODEL C- P-M RATIO-1.5Cn/AgFy-20246TIME (s)Figure 4. Response time history results from Model C under TH02: a) Storey drift at level 1; b) Brace axial forcedemand at level 1; c) Axial and flexural demands in the beam at level 1; and d) Axial and flexural demands inthe column at level 1.6
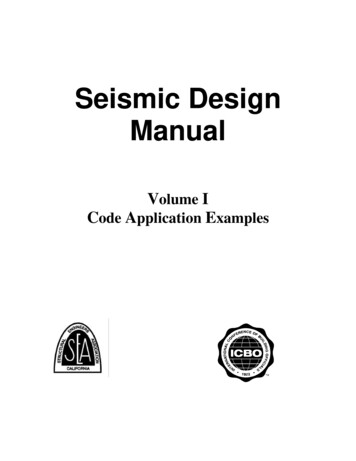
Y.Balazadeh Minouei, S.Koboevic and R.Tremblay7Figure 4 shows the time history response obtained under the same ground motion (TH02) whenusing Model C. In this model, beam buckling response was explicitly represented. In Fig. 4a, thestorey displacement at level 1 is different from that shown in Fig. 3a because beam in-plane bucklingoccurred over half of the total beam length at that level, which affected the structure response. Figure4b shows that brace buckling did not occur at the 1st floor and brace forces remained below the braceconnection strength. This is because brace force demand was limited by beam buckling. In Fig. 4c,beam buckling is observed at the 1st storey at t 3.8 s, when the axial load reached and slightlyexceeded the beam Cn. Note that the beam Cn in this figure is calculated using an effective lengthequal to half of the total beam length because the braces did not buckle and could still offer a verticalsupport at the beam mid-length, which is consistent with the buckling mode observed in the analysis.Beam instability will be discussed in detail in the next section. Consistently with Model B, the axialload in the RHS column exceeded the nominal column compressive resistance (Fig. 4d). However, inModel C the flexural demand in the column was induced by the large drift caused by beam buckling.In the real structure, the presence of the floor slab would restrain the lateral displacement of thecolumn at the 1st level. However, in general, the connection of beam to slab would have not beendesigned for that demand, and the retrofit strategy should be proposed to improve the seismicbehaviour of the structure.BEAM BUCKLING RESPONSE IN CHEVRON BRACED FRAMEAnalyses with Model C revealed that in-plane beam buckling over half the beam length is a likelyfailure mode in steel chevron braced frames built prior to implementation of modern seismic designprovisions, and it is typical for chevron braced frames with low gravity load on the beam. Beambuckling is therefore further investigated by conducting incremental static (pushover) analysis of thebeam located at the 1st level of the 10-storey prototype building.MODEL 1FMODEL 2FFMODEL 3 FMODEL 4MODEL 5FF10.90.8C/Cn0.70.60.50.40.30.20.1MODEL1MODEL 2MODEL 4MODEL 5MODEL 30051015AXIAL DEFORMATION (mm)20Figure 5. a) Models used for examination of the beam buckling response at the 1st level of chevron braced frame;and b) Computed beam axial load-deformation responses.Five different models were considered to study in detail the beam buckling response and assessthe beam compressive strength. The five models were developed by gradually including different
structural components, starting from a simple beam case represented in Model 1 to a 2-storey chevronbraced frame assembly in Model 5 (Fig. 5a): Model 1 is a simple beam having half the beam length;Model 2 represents the continuous two-span beam; Model 3 includes the bracing members framingfrom above; Model 4 includes the gusset plate of the braces framing from below; and Model 5includes the bracing members framing from below. In Models 3, 4 and 5, the braces were assumed tobe pinned at their ends. In Models 1 and 2, axial loading was applied at one beam end. In subsequentmodels, beam axial load was induced by applying storey shear though the braces. Gravity loading wasimposed on the beam. Figure 6 shows the location of the elements and the cross-section fiberdiscretization used for the beam in the different models.ABW310x44.5A2L02000x2x20PL 1360x435x19.05BSection AElevation View1A2A3A4A5A6A7B8B9B10B11A12A13A14A15ASection B16A16 Nonlinear Beam-Column ElementsFigure 6. Location of elements and cross-section fibers in the beam member modelIn Fig. 5b, the axial load-axial deformation responses of the compression half beam segmentfrom the 5 different models are compared. In this figure, the beam Cn is determined with an effectivelength equal to half the chevron beam length. The peak C/Cn values from Models 1 to 5 are: 0.86,0.923, 0.923, 0.964 and 0.963, respectively. The buckling strengths determined using Models 2 to 5are higher than that obtained from Model 1. This could be expected because the additional flexuralstiffness provided by the second half of the beam subjected to tension contributed to increase thebuckling resistance of the compression half-beam segment. In Models 4 and 5, the presence of thegusset plate increased the beam axial and flexural stiffnesses; the latter also resulted in increased beambuckling strength. The results from the most representative Model 5 show that the Cn value fromcurrent code equations can be used to predict the beam buckling strength.The evolution of the stresses and strains at the beam extreme top and bottom fibers upon beambuckling are presented for each model in Fig. 7. In Model 1, only the elements located in the left-handside beam half-segment were included, and the results at the mid-length of the half-beam segment, i.e.at integration point 1 of element 5 were examined. Results at integration point 1 of element 9 wereconsidered in Models 2 and 3, i.e. at the beam mid-length. In Models 4 and 5, the gusset plateextended over elements 7 to 10; therefore, the results at integration point 3 of element 6 wereconsidered for these models.8
Y.Balazadeh Minouei, S.Koboevic and R.Tremblaya)20FLANGE NORMAL STRAIN /εYFLANGE NORMAL STRESS /FY0.2-0.2-0.4-0.6-0.8-11015AXIAL DEFORMATION AXIAL DEFORMATION (mm)20051015AXIAL DEFORMATION (mm)20051015AXIAL DEFORMATION (mm)20051015AXIAL DEFORMATION (mm)20051015AXIAL DEFORMATION (mm)2014121086420-251015AXIAL DEFORMATION (mm)2018FLANGE NORMAL STRAIN /εYFLANGE NORMAL STRESS /FY10.50-0.5-151015AXIAL DEFORMATION (mm)1614121086420-2202FLANGE NORMAL STRAIN/εYFLANGE NORMAL STRESS AXIAL DEFORMATION (mm)200FLANGE NORMAL STRAIN/εY0.2FLANGE NORMAL STRESS /FY-8-1010.2e)-620FLANGE NORMAL STRAIN /εYFLANGE NORMAL STRESS -2-4-6-8-10-12-14-16-1.2051015AXIAL DEFORMATION (mm)20Figure 7. Stress and strain demands upon beam buckling from Models 1 (a) to 5 (e).As seen in Fig. 7a, yielding in compression is reached in the fibers located at the beam top flange ofModel 1, at an axial deformation of approximately 6 mm, when buckling occurred. Beyond that point,the variation of the stresses and strains in the bottom flanges is reversed as buckling deformations
increase. Figs. 7b and 7c show that the top flange fibers of Models 2 and 3 yield in tension at bucklingof the beam. The presence of the braces framing from above has limited effects on the beam bucklingresponse. In Models 4 and 5, yielding developed at the beam bottom flange, next to the gusset plate,when buckling occurred. The presence of the braces framing from below has limited impact on thestress and strain distributions before and after buckling.CONCLUSIONSThe seismic performance of a steel tension-compression chevron braced frame used in a regular 10storey building located in Vancouver, British Columbia, was assessed in accordance with the ASCE41-13 standard. The structure was designed following the design provisions of the 1980 Canadianseismic code. Nonlinear time-history analyses were carried out for a set of seven ground motionrecords. The nonlinear analysis with brace nonlinear response showed the buckling of the braces at thefirst level, which led to large flexural demands on the beam at that level. The resulting large storeydrift imposed bending moments on the columns and caused soft-storey response. The braceconnections were also found to have insufficient capacity. When beam buckling was also representedin the nonlinear analysis, the beam at the first level buckled in-plane within its half-length, whichcaused large storey drifts and, thereby, high flexural demand on the columns. Beam buckling limitedthe axial forces that developed in the braces: the braces did not buckle at the first floor and the braceconnection capacities were not reached. Further assessment of the beam buckling response in chevronbraced frames was performed using five different beam models. The study showed that the beam inplane buckling response and strength are influenced by the presence of the braces and the gusset plateconnections, and the distribution of stresses and strains were sensitive to the modelling employed forbraces and the gusset plates. Nevertheless, for this structure, the beam compressive strength could bepredicted well by using current code equations assuming an effective length equal to the beam halflength.ACKNOWLEDGEMENTSThe authors gratefully acknowledge the financial support provided by the Natural Sciences andEngineering Research Council of Canada (NSERC) for the Canadian Seismic Research Network(CSRN).REFERENCESASCE (2013) Seismic evaluation and rehabilitation of existing buildings, ASCE/SEI 41-13 (Public CommentDraft), American Society of Civil Engineers, Reston, VAAtkinson GM (2009) “Earthquake time histories compatible with the 2005 national building code of Canadauniform hazard spectrum”, Canadian Journal of Civil Engineering, 36(6)
CSA-S16.1-M78. For chevron bracing members, the overall slenderness ratio was limited to 200. One stitch was also placed at the mid-length of the bracing members to satisfy the CSA-S16.1-M78 slenderness provision. The back-to-back legs of the angles were connected to single vertical gusset pl