Transcription
Overview of DemographicConcepts and MethodsUnited Nations Statistics Division
Outline1.2.3.4.5.6.7.What is demographyMeaning of “population”Population change and components of population growthDemographic transitionData sourcesDemographic measurementsDirect and indirect techniquesUnited Nations Workshop on Evaluation and Analysis of Census DataNay Pyi Taw, Myanmar, 1–12 December 2014
What is demography?Literally translated from the Greek, 'demography' means 'descriptionof the people’One definition among many:“Demography is the study of the size, territorial distribution, andcomposition of population, changes therein, and the components ofsuch changes, which may be identified as natality, mortality, territorialmovement (migration), and social mobility (change of status).”(Duncan & Hauser 1972) The study of population processesUnited Nations Workshop on Evaluation and Analysis of Census DataNay Pyi Taw, Myanmar, 1–12 December 2014
Meaning of “population”1. Collection of persons alive at a specified point in time who meet certaincriteriaExamples:- The “population of India on April 1, 1995,"- The "population of American black females in the Northeast on June 1, 1900”2. Kind of collectivity that persists through time even though its membersare continuously changing through attrition and accession. Thus, "thepopulation of India" may refer to the aggregate of persons who haveever been alive in the area we define as India and possibly even tothose yet to be born there. The collectivity persists even though avirtually complete turnover of its members occurs at least once eachcentury.Source: Preston et al. (2001)United Nations Workshop on Evaluation and Analysis of Census DataNay Pyi Taw, Myanmar, 1–12 December 2014
Demographic analysis Focuses on this enduring collectivity studying changes in its size,growth rates, and composition Emphasis is on understanding aggregate processes, but demographyis also attentive to the implications of those processes for individuals Many of the indexes used in demography (life expectancy at birth,total fertility rate) translate aggregate-level processes into statementsabout the demographic circumstances faced by an average orrandomly-chosen individualSource: Preston et al. (2001: 1-2)United Nations Workshop on Evaluation and Analysis of Census DataNay Pyi Taw, Myanmar, 1–12 December 2014
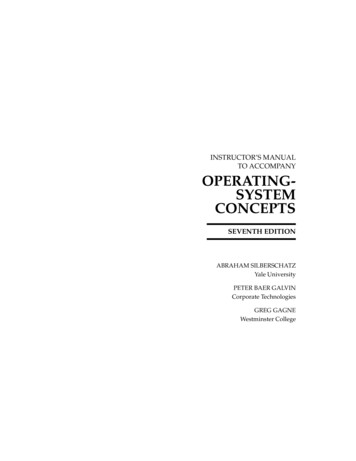
World population growth through historySource: McFalls 2007: 25United Nations Workshop on Evaluation and Analysis of Census DataNay Pyi Taw, Myanmar, 1–12 December 2014
World population growth through historyWorld populationWhen?How long?1 billion1800All of human history2 billion1930130 years3 billion196030 years4 billion197515 years5 billion198712 years6 billion199912 years7 billion201314 years Source: McFalls 2007: 25 United Nations Workshop on Evaluation and Analysis of Census DataNay Pyi Taw, Myanmar, 1–12 December 2014
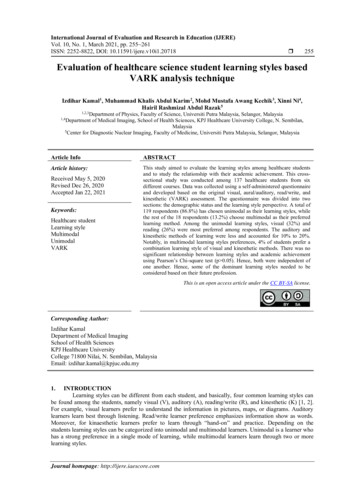
World population growth 1950-20501098Billion people765Less Developed Regions4321More Developed Regions0YearSource: UNPD (2013)United Nations Workshop on Evaluation and Analysis of Census DataNay Pyi Taw, Myanmar, 1–12 December 2014
World population clock, 2014More developed Less 162Second2.70.02.7PopulationNatural increase perYearDayHourSource: Haub & Kaneda (2014) United Nations Workshop on Evaluation and Analysis of Census DataNay Pyi Taw, Myanmar, 1–12 December 2014
How to understand these changes?What are the components of population growth?United Nations Workshop on Evaluation and Analysis of Census DataNay Pyi Taw, Myanmar, 1–12 December 2014
Components of population growthPopulation Populationat time 0at time tNatural increase(Births – Deaths)Net migration(Immigration – Emigration)(arrivals – departures)United Nations Workshop on Evaluation and Analysis of Census DataNay Pyi Taw, Myanmar, 1–12 December 2014
Components of population growthPopulation growth can occur only if:1. Natural increase is positiveB D B increases or D declinesand/or2. Net migration is positiveI E I increases or E declinesIn history, the first case is more important to understand the impressivepopulation growth Demographic transitionUnited Nations Workshop on Evaluation and Analysis of Census DataNay Pyi Taw, Myanmar, 1–12 December 2014
Demographic Transition One of demography’s main theoretical preoccupation in 20th centuryMore a generalization from observed trends than a theoryDescriptive and pedagogic valueMany patterns of transition, with different timing and explanations Movement of death and birth rates in a society, from a situation whereboth are high (in the pre-transition stage) to one where both are low (inthe post-transition stage). Transition is the interval between these two stages during which thepopulation increases oftentimes rapidly, as births exceed deaths.United Nations Workshop on Evaluation and Analysis of Census DataNay Pyi Taw, Myanmar, 1–12 December 2014
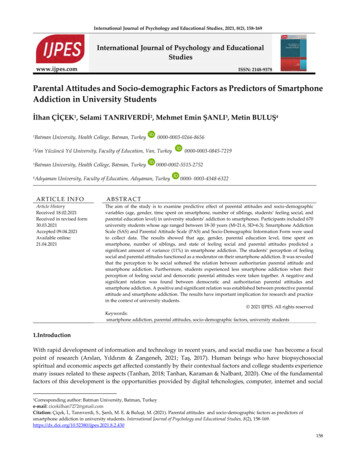
Classic stages of demographic transitionBefore the startMortalityof the DTdeclineFertility decline At the end of the DTlife was short, birthsImprovedwereliving conditionsPopulationandgrowth remainsBirth andhighdeath rates aremany, growth was slowhealthandpracticetheat the beginning but fallsclosenearagain.0 Low population population explosionpopulation was youngat the end of the stagegrowth with fluctuationsSource: McFalls 2007: 27United Nations Workshop on Evaluation and Analysis of Census DataNay Pyi Taw, Myanmar, 1–12 December 2014
Growth rate over the demographic transitionStage 1Stage 2Stage 3Adapted from Bloom et al. 2003: 31United Nations Workshop on Evaluation and Analysis of Census DataNay Pyi Taw, Myanmar, 1–12 December 2014Stage 4
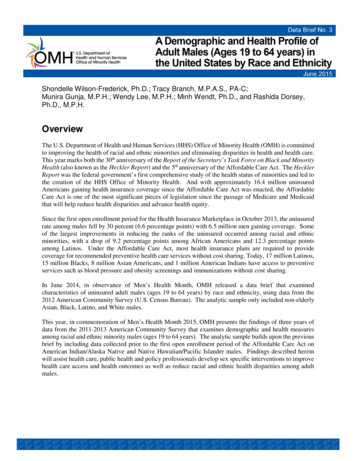
250 years of demographic transition in Norway40Crude rate (p. 1000)3530252015105Crude Birth RateCrude Death 199020000Data source: Moving average computed from Rowland (2003)United Nations Workshop on Evaluation and Analysis of Census DataNay Pyi Taw, Myanmar, 1–12 December 2014
Demographic transition across the globe (Data source: UNPD 2013)WORLD40Crude Birth RateCrude Death Rate30201050Crude rate (p. 1000)Crude rate (p. 1000)500403020100Less Developed Regions3020100Data source: UNPD (2013)(excluding least developed)50Crude rate (p. 1000)Crude rate (p. 1000)5040More Developed Regions403020100Least Developed RegionsUnited Nations Workshop on Evaluation and Analysis of Census DataNay Pyi Taw, Myanmar, 1–12 December 2014
Demographic transition in Asia (Data source: UNPD 2013)50AsiaCrude Birth RateCrude Death Rate3020100Crude rate (p. 1000)40South-Eastern Asia40302010050Crude rate (p. 1000)Crude rate (p. 1000)5040Myanmar3020100United Nations Workshop on Evaluation and Analysis of Census DataNay Pyi Taw, Myanmar, 1–12 December 2014
Changes in age structure through the demographic transition (DT)100 40-4435-3930-3425-2920-2415-1910-145-90-4STAGE 2: With declining mortality, the population becomesyounger because more children survive1086420246United Nations Workshop on Evaluation and Analysis of Census DataNay Pyi Taw, Myanmar, 1–12 December 2014810
Changes in age structure through the demographic transition (DT)100 40-4435-3930-3425-2920-2415-1910-145-90-4STAGE 3: Fertility decline reduces the proportion of children.Successive generations become similar in size (parents children).1086420246United Nations Workshop on Evaluation and Analysis of Census DataNay Pyi Taw, Myanmar, 1–12 December 2014810
Changes in age structure through the demographic transition (DT)100 40-4435-3930-3425-2920-2415-1910-145-90-4STAGE 4: With continuing fertility decline, the relative numberof children reduces and the older population becomes moreimportant (high life expectancy).1086420246United Nations Workshop on Evaluation and Analysis of Census DataNay Pyi Taw, Myanmar, 1–12 December 2014810
Diversity of population pyramids, 3 different stagesSource: McFalls 2007: 19United Nations Workshop on Evaluation and Analysis of Census DataNay Pyi Taw, Myanmar, 1–12 December 2014
Components of population growthEach component of population growth (population, births,deaths, migration) need to be estimated from empirical data Data sourcesUnited Nations Workshop on Evaluation and Analysis of Census DataNay Pyi Taw, Myanmar, 1–12 December 2014
Data sourcesMain sources Census Vital registration Sample surveysSome other sources Population register Demographic Surveillance System (DSS)United Nations Workshop on Evaluation and Analysis of Census DataNay Pyi Taw, Myanmar, 1–12 December 2014
Data sources – Census"The total process of collecting, compiling, evaluating, analysing, andpublishing or otherwise disseminating demographic, economic andsocial data pertaining to all persons in a country or in a welldelineated part of a country at a specified time.” (United Nations 2008) Total processNot sufficient to simply collect and collate information in a census, but alsoanalyze, publish and disseminate the data. Demographic, economic and social dataTo collect more than just a simple headcount of the population UniversalityTo enumerate all people in a population SimultaneityTo produce a snapshot of the population at a point in timeUnited Nations Workshop on Evaluation and Analysis of Census DataNay Pyi Taw, Myanmar, 1–12 December 2014
Data sources – Census The oldest, most demanding, and most important source ofdemographic information many demographic methods developedfor census data Among the most complex and massive peacetime exercises a nationundertakes Requires the mapping the entire country, mobilizing and training anarmy of enumerators, conducting a massive public campaign,canvassing all households, collecting individual information,compiling vast amounts of completed questionnaires, and analysingand disseminating the dataUnited Nations Workshop on Evaluation and Analysis of Census DataNay Pyi Taw, Myanmar, 1–12 December 2014
Data sources – Census (Recommended) to be conducted once per decade UN Principles and Recommendations ( 3rd revision forthcoming) 2010 World Population and Housing Census Programme (UNSD) 19 countries have not conducted a census (slight improvementcompared to 26 during the 2000-round) UNSD Population Census oducts/dyb/dybcensusdata.htm Micro samples available for 79 countries (258 censuses) at IPUMSInternational (Integrated Public Use Microdata nal/United Nations Workshop on Evaluation and Analysis of Census DataNay Pyi Taw, Myanmar, 1–12 December 2014
General overview – 2010 round of censusesNumber of countries/areas that conducted, plan to conduct and did notschedule a population and housing census in the 2010 round, by 052006200920102011201220132014United Nations Workshop on Evaluation and Analysis of Census DataNay Pyi Taw, Myanmar, 1–12 December 2014Nocensus
Enumeration used in 2010 round of censusesTotal countriesPercentTotal126100Face-to-face interview, paper questionnaire9475Face-to-face interview, electronic questionnaire1411Telephone1411Self-enumeration, paper questionnaire, collected by enumerators3024Self-enumeration, paper questionnaire, return by mail1814Self-enumeration, internet3326Register-based enumeration1814Pre-existing administrative records86Other22* The sum of the categories exceeds 100% as countries were asked to provide answers as to all the methods they applied.United Nations Workshop on Evaluation and Analysis of Census DataNay Pyi Taw, Myanmar, 1–12 December 2014
Data sources – Census (De facto vs. De jure)De facto (Latin, for ‘in actual fact’)The population is enumerated where it is found, regardless of therespondent’s usual place of residence.De jure (Latin for ‘in law’)The respondent is enumerated at their usual place of residence,regardless of where they stayed on the census date.In highly mobile populations, or populations subject to extensiveseasonal migration (e.g. crop-pickers), De facto and De jure data maygive widely divergent resultsSource: IUSSP & UNFPA (n.d.)United Nations Workshop on Evaluation and Analysis of Census DataNay Pyi Taw, Myanmar, 1–12 December 2014
Data sources – CensusAdvantagesDisadvantagesThe coverage aims to be universalThe size and complexity of the exercise means thatthe content and quality control efforts may be limitedCensus provides sampling frame forsubsequent surveys and studiesDue to high costs, census is conducted only everyten yearsThe census can serve as a useful toolfor ‘nation-building’, by involving theentire populationSome delay between data collection and release ofresults (typically, between 18 months to two years)meaning that the census only offers a snapshot ofthe population at some point in the pastCensus data avoids the sampling errorsthat can occur with sample dataRisks that census being politicised – either bygroups who feel that they might be systematicallyundercounted by the exercise, or by parties with avested interest in seeking to ensure that their group’spopulation is found to be larger than that of othergroupsCensuses provide data for small areas,such as districts and counties, which isvital for the planning of servicesSource: IUSSP & UNFPA (n.d.)United Nations Workshop on Evaluation and Analysis of Census DataNay Pyi Taw, Myanmar, 1–12 December 2014
Data sources – Vital registration system The second main source for demographers Collect information on individuals when (or shortly) after theyexperience the vital events (birth, marriage, death, (sometimes) migration) In almost all developed countries, registration of births, deaths, andmarriages is compulsory Vital data collected are tabulated totals from individual records Sometimes more extensive information collected (e.g. statistics for birthcould include sex, birth weight, place of birth ) Despite progress, civil registration systems still deficient in manycountries For example, only 60% of the 230 countries and areas register at least90% of births occurred in the country. While for death registration, only 47%of the countries and areas have at least 90% coverage. (UNSD 2012)United Nations Workshop on Evaluation and Analysis of Census DataNay Pyi Taw, Myanmar, 1–12 December 2014
Data sources – Sample surveys More and more important as statistical science has developed Collect vital statistics where the official registration system isinadequate or nonexistent and for intercensal period Collect supplementary demographic and other data, where it is notfeasible to collect the same from the population census Since the 1970s, coordinated demographic surveys have beentaken around the world through the World Fertility Survey (WFS),the Demographic and Health Surveys (DHS), the Multiple IndicatorCluster Surveys (MICS), or other national types of survey DHS micro datasets available online at: www.dhsprogram.com MICS micro datasets available online at: http://www.childinfo.org/mics.htmlUnited Nations Workshop on Evaluation and Analysis of Census DataNay Pyi Taw, Myanmar, 1–12 December 2014
Data sources – Some other sourcesPopulation register If country has a system of continuous registration it is possible to maintaina separate card for each individual from the time of his birth (orimmigration) to his death (or emigration) and to continually update therecord by recording such additional registration data as marriage, divorce,birth of children, etc.Demographic Surveillance System (DSS) DSS monitors demographic and health characteristics of a populationliving in a well-defined geographic area. A baseline census is followed byregular update of key demographic events (birth, death, migration,marriage ) and heath eventsUnited Nations Workshop on Evaluation and Analysis of Census DataNay Pyi Taw, Myanmar, 1–12 December 2014
Demographic measurements (rate, ratio, proportion)RateThe most widely used comparative measures of population changeIdeally, demographic rates show ideally the relationship between thenumber of demographic events (numerator) and the population at risk ofexperiencing them (denominator) in a specific period of time.Rate Number of Demographic EventsPopulation at Risk during specific period of timeUnited Nations Workshop on Evaluation and Analysis of Census DataNay Pyi Taw, Myanmar, 1–12 December 2014
Demographic measurements (rate, ratio, proportion)Rate When studying the relative incidence of births, deaths, marriages,migration and other vital events, it is apparent that the number of theseevents depends on the interval of time chosen (usually one year). A common method of comparing the incidence of births in severalcountries is to calculate for each country the number of births duringone year per 1,000 persons in the population of that country at themiddle of the year. The result is called a rate, in this case a rate per1,000 per year. Mid-year population calculated as the mean or average of the populationat the start and end of the yearUnited Nations Workshop on Evaluation and Analysis of Census DataNay Pyi Taw, Myanmar, 1–12 December 2014
Demographic measurements – Rate, examplesCrude Birth Rate and Crude Death Rate Example in ExcelUnited Nations Workshop on Evaluation and Analysis of Census DataNay Pyi Taw, Myanmar, 1–12 December 2014
A note on approximation of person-yearsWhen population increase linearly, theestimate of person-years lived using the midperiod population times period length will beaccurate because the overestimate for thefirst half-period is exactly offset by theunderestimate for the second half- period,i.e., the two triangles have equal areasSource: Preston et al. (2001: 16)When population follows an exponentialgrowth pattern, the two shaded surfaceshave different areas and the mid-yearapproximation will underestimate personyears lived during the period.United Nations Workshop on Evaluation and Analysis of Census DataNay Pyi Taw, Myanmar, 1–12 December 2014
Demographic measurements (rate, ratio, proportion)Ratio The size of a number relative to another convenient number When the population at risk is unavailable Ratio Denominators for ratios selected depending on the available data andease of understanding Example: sex ratio the number of men per hundred women(men/women 100)United Nations Workshop on Evaluation and Analysis of Census DataNay Pyi Taw, Myanmar, 1–12 December 2014
Demographic measurements (rate, ratio, proportion)Proportion A ratio in which the denominator includes the numerator Decimal fraction (between 0 and 1)Percentage A proportion mutliplied by 100 Easier to read/interpretUnited Nations Workshop on Evaluation and Analysis of Census DataNay Pyi Taw, Myanmar, 1–12 December 2014
Demographic measurements – ExampleNumber(in thous.)SinhaleseTamilCeylon 90.0690.0081.000Source: Pollard et al. (1990)United Nations Workshop on Evaluation and Analysis of Census DataNay Pyi Taw, Myanmar, 1–12 December 2014?74.417.96.90.8100.0
Demographic measurements – ExampleNumber(in thous.)SinhaleseTamilCeylon 00.0In 1984, 15.5 births per 1,000 population per year were observed inAustralia ? RateSource: Pollard et al. (1990)United Nations Workshop on Evaluation and Analysis of Census DataNay Pyi Taw, Myanmar, 1–12 December 2014
Demographic measurements - Probability The ratio of the number of demographic events to the initial population at riskof experiencing them in a fixed period of time In demography, probabilities are always based on the initial population For example, probability of dying at age 100 is based on the number of peoplewho celebrated their 100th birthdays (initial population) Since each occurrence in the numerator (e.g., divorce) must be preceded byan event in the denominator (marriage), the number of occurrences cannotexceed the number of preceding events a probability cannot exceed one and, since we are only dealing with positivequantities, probabilities cannot be negativeSource: Preston et al. (2001: 19)United Nations Workshop on Evaluation and Analysis of Census DataNay Pyi Taw, Myanmar, 1–12 December 2014
Demographic measurements - Probability Populations do not have probabilities except insofar as they pertain to cohortsthat are included in the population. Although we could count the number of marriages in a population during somecalendar year and the number of divorces during that year, the two numberscombined do not give a sensible estimate of the probability of divorce becausethey don't apply to the same cohort. If we happened to choose a year in asmall population where no one married but there was a divorce, ourpopulation's probability of divorce qD would be 1/0 (infinity), an obviouslyabsurd outcome. Only when we count the events pertaining to the cohort at risk of the event wecan properly define a probabilitySource: Preston et al. (2001: 19)United Nations Workshop on Evaluation and Analysis of Census DataNay Pyi Taw, Myanmar, 1–12 December 2014
Demographic measurements - Cohort Cohort is the aggregate of all units that experience a particular demographicevent during a specific time interval As for a population, a cohort always has some specific geographic referentwhether it is explicit or implicit A cohort usually consists of people, but it may also consist of entities (e.g.,marriages) formed by a demographic event. The cohort is usually identified verbally both by the event itself and by the timeperiod in which it is experienced Birth cohort most used Persons born during the same period will passthrough life together Examples: "US birth cohort of 1942” all persons born as US citizens in calendar year 1942 "French marriage cohort of 1990'‘ all marriages contracted in France during thecalendar year 1990Source: Preston et al. (2001)United Nations Workshop on Evaluation and Analysis of Census DataNay Pyi Taw, Myanmar, 1–12 December 2014
Demographic measurements – CohortMain limitation of working with cohort is that for computing cohort ratesand probabilities requires complete information on each individual untilhe or she has died (or at least has ceased to be "at risk” of the event ofinterest)For mortality, need to wait until the last person of a birth cohort passesaway in order to compute mortality indicatorsFor fertility, need to wait until the last woman of a birth cohort reachesthe end of her childbearing ages Demographers have developed the artifact of the synthetic cohort Synthetic cohort mixes the experiences of persons from different(birth) cohorts in order to compute demographic indicatorsSource: Preston et al. (2001)United Nations Workshop on Evaluation and Analysis of Census DataNay Pyi Taw, Myanmar, 1–12 December 2014
Example: Period Fertility vs. Cohort FertilitySource: IUSSP & UNFPA (n.d.)United Nations Workshop on Evaluation and Analysis of Census DataNay Pyi Taw, Myanmar, 1–12 December 2014
Example: Period Fertility vs. Cohort FertilitySource: IUSSP & UNFPA (n.d.)United Nations Workshop on Evaluation and Analysis of Census DataNay Pyi Taw, Myanmar, 1–12 December 2014
Example: Period Fertility vs. Cohort FertilitySource: IUSSP & UNFPA (n.d.)United Nations Workshop on Evaluation and Analysis of Census DataNay Pyi Taw, Myanmar, 1–12 December 2014
Direct and indirect techniques“In a perfect world, data would always be complete,accurate, current, pertinent, and unambiguous. In the realworld, data are generally flawed on some or all of thesedimensions”(Feeney 2003: 190)United Nations Workshop on Evaluation and Analysis of Census DataNay Pyi Taw, Myanmar, 1–12 December 2014
Direct and indirect techniquesDirect techniques require reliable and comprehensive information onpopulation, births, deaths usually from censuses and registrationsystemsBut, in most parts of the world, vital registration is incomplete andcensuses usually suffer from underenumeration and other defectsMany of the standard direct methods of demographic estimation thatcan be used in a “perfect world” cannot be applied successfully to themajority of the world populationStarting in the 1960s, development of estimation methods for use withdeficient and incomplete demographic data (William Brass (1921-1999)and associates) Indirect demographic estimationUnited Nations Workshop on Evaluation and Analysis of Census DataNay Pyi Taw, Myanmar, 1–12 December 2014
Direct and indirect techniquesIndirect techniquesUse available information and/or assumption (through the use of models)to infer the levels and trends of demographic changeExample: Levels and trends in child mortality can be estimated by answers to thequestion on the number of children ever born and children surviving by age ofwomen Adult mortality can be estimated using answers on the question on parentalsurvival or on siblings survival Fertility can be estimated using the population structure by single age and sexUnited Nations Workshop on Evaluation and Analysis of Census DataNay Pyi Taw, Myanmar, 1–12 December 2014
Indirect techniques – Main referencesUnited Nations (1983), Manual X: Indirect Techniques for DemographicEstimation, New York: United Nations, available online ion.shtmlMoultrie T.A., R.E. Dorrington, A.G. Hill, K. Hill, I.M. Timæus & B. Zaba(eds) (2013), Tools for Demographic Estimation. Paris: InternationalUnion for the Scientific Study of Population. available online e in /get-pdf-book-websiteUnited Nations Workshop on Evaluation and Analysis of Census DataNay Pyi Taw, Myanmar, 1–12 December 2014
Indirect techniques – Main packagesMORTPAK – The United Nations software package fordemographic measurement, available ation/publications/mortality/mortpak.shtmlExcel templates provided with each chapter of Moultrie et al. (2013), available ed Nations Workshop on Evaluation and Analysis of Census DataNay Pyi Taw, Myanmar, 1–12 December 2014
Direct and indirect techniques“The problem of estimating demographic measures fromincomplete data is a challenging one, one for which thereis no universal answer and one which therefore requiresin the demographer the qualities of resourcefulness andimagination.”(Pollard et al. 1990: 164)United Nations Workshop on Evaluation and Analysis of Census DataNay Pyi Taw, Myanmar, 1–12 December 2014
ReferencesBrass, W. (1985), Advances in Methods for Estimating Fertility and Mortality from Limited and Defective Data,London: Centre for Population Studies, London School of Hygiene and Tropical Medicine.Feeney G. (2003), "Data assessment“, in Demeny, P & G McNicoll (eds). Encyclopaedia of Population. Vol. 1. NewYork: Macmillan Reference USA, pp. 190-193.IUSSP & UNFPA (n.d.), Population Analysis for Policies and Programmes, Paris: IUSSP and UNFPA, available onlineat: http://papp.iussp.org/ (last accessed 1 December 2014).McFalls, J.A. Jr. (2007), Population: A Lively Introduction, 5th edition, Washington D.C., Population Reference Bureau.Pollard, A.H., Y. Farhat & G.N. Pollard (1990), Demographic Techniques, 3rd edition, Sydney: Pergamon Press.Preston, S., P. Heuveline & M. Guillot (2001), Demography: Measuring and Modeling Population Processes, Oxford:Blackwell Publishers Ltd.United Nations (2008). Principles and Recommendations for Population and Housing Censuses, Revision 2. NewYork: United Nations, DESA.UNPD (United Nations Population Division) (2013), World Population Prospects: The 2012 Revision, New York,DESA, Population Division, available online at: http://esa.un.org/unpd/wpp/index.htm (last accessed 1December 2014).UNSD (United Nations Statistics Division) (2012), Coverage of Birth and Death Registration [electronic /demographic/CRVS/CR coverage.htm (last accessed 2 December 2014)United Nations Workshop on Evaluation and Analysis of Census DataNay Pyi Taw, Myanmar, 1–12 December 2014
Thank youQuestions/comments? until 12 December: After 12 December: spoorenberg@un.org
United Nations Workshop on Evaluation and Analysis of Census Data Nay Pyi Taw, Myanmar, 1-12 December 2014 Demographic analysis Focuses on this enduring collectivity studying changes in its size, growth rates, and composition