Transcription
Urban, Rural & Built EnvironmentState of Environment Report Gujarat 2012Status of Waste Management in Urban & RuralAreas1.1 IntroductionWaste generation is an integral part of ecological cycle. Every element of ecosystemdirectly or indirectly produces waste. With the advancement in human activities,inventions and discoveries, the quantum of waste generation has gone high. It has notonly increased in volume but also has become more and more complex in compositionwhich cannot be decomposed completely through natural processes. Hence wastemanagement becomes an important responsibility of all the stakeholders generatingwaste and authorities managing human habitat and environment.This section aims at presenting the scenario of waste management in Gujarat. It coversall broad classifications of wastes, their status of generation, collection, treatment anddisposal, likely impacts and response mechanism of various stakeholders.1.1.1 What is Waste? – Definition and types“Wastes” are materials which are discarded after use at the end of their intended life-span.(MoEF, Report of the Committee to Evolve Road Map on Management of Wastes in India,2010)Waste can be categorized in various ways depending on their source of generation, physicalstate and composition to name a few. For the purpose of this study, waste has been classifiedbased on source of generation i.e. mainly waste generated by domestic and allied activitiesboth in Urban and rural areas and Industrial activities. Biomedical and E-waste is generated inany of these locations i.e Urban, rural or industrial but they have been dealt with separately asthere are separate rules that govern its management and separate infrastructure exists in thestate to manage these.Urban Waste1Domestic WasteRural Waste2Industrial WasteSolid/Liquid(Non Hazardous)WasteHazardous waste3Bio-Medical Waste4E- Waste1
State of Environment Report Gujarat 2012Urban, Rural & Built EnvironmentThe waste can be classified on the bases of their physical state and composition into liquidwaste and solid waste;1. Liquid Waste:Liquid waste means sludge resulting from, but not limited to, waste treatment works,air pollution control facility, domestic, commercial, mining, institutional, agricultural,or governmental operations; or other waste materials, including materials to berecycled or otherwise beneficially reused; or septic tank, grease trap, sediment trap,portable toilet, or oil and grease separator pump-outs; or solvents, sewage, industrialwaste, hazardous waste, semisolid waste, or potentially infectious waste; or anysimilar materials which would cause a nuisance if discharged to the ground waters.(Center of Excellence for Environmental Education, GoI)The solid by-products of sewage treatment are classified as sewage wastes or liquidwaste. They are mostly organic and derive from the treatment of organic sludge fromboth the raw and treated sewage. The inorganic fraction of raw sewage such as grit isseparated at the preliminary stage of treatment, but because it entrains putrescibleorganic matter which may contain pathogens, must be buried/disposed off withoutdelay. The bulk of treated, dewatered sludge is useful as a soil conditioner butinvariably its use for this purpose is uneconomical. The solid sludge therefore entersthe stream of municipal wastes unless special arrangements are made for its disposal.(CPHEEO)2. Solid Waste:Solid wastes are all the wastes arising from human and animal activities that arenormally solid and are discarded as useless or unwanted. (Center of Excellence forEnvironmental Education, GoI)Solid waste includes all types of waste in municipal waste category arising fromhuman and animal activity and all residential, commercial and institutionalbuildings.Various categories of wastes discussed in the following sections can bedefined as follows:"Municipal solid waste"(MSW) includes commercial and residential wastes generatedin municipal or notified areas in either solid or semi-solid form excluding industrialhazardous wastes but including treated bio-medical wastes. (MoEF, Municipal SolidWaste (Management and Handling) Rules, 2000)MSW also includes construction and demolition waste which is often mixed with thedomestic waste. This waste has high potential for reuse and recycling and so need tobe handled separately.Construction and demolition wastes are the waste materials generated by theconstruction, refurbishment, repair and demolition of houses, commercial buildingsand other structures. It mainly consists of earth, stones, concrete, bricks, lumber,roofing materials, plumbing materials, heating systems and electrical wires and partsof the general municipal waste stream, but when generated in large amounts at2
State of Environment Report Gujarat 2012Urban, Rural & Built Environmentbuilding and demolition sites, it is generally removed by contractors for filling lowlying areas and by urban local bodies for disposal at landfills. (CPHEEO)Industrial waste, as name indicates, it is purely contributed by industrial units. Its typeand characteristic majorly depend on the type of industry, processing and rawmaterials. It can be broadly classified into industrial Solid/Liquid waste andHazardous waste. Industrial Solid/Liquid waste differs from Hazardous waste inrespect of their composition. This type of waste has to be handled separately andrequires different treatment from domestic waste. It mainly contains ashes, chemicals,dyes, byproducts of the industry and heavy metals.Management of Industrial Solid Waste (ISW) is not the responsibility of local bodies.Industries generating solid waste have to manage such waste by themselves and arerequired to seek authorisations from respective State Pollution Control Boards(SPCBs) under relevant rules. However, through joint efforts of SPCBs, local bodiesand the industries, a mechanism could be evolved for better management. (CPHEEO)Hazardous waste means any waste which by reason of any of its physical, chemical,reactive, toxic, flammable, explosive or corrosive characteristics cause danger or islikely to cause danger to health or environment, whether alone or when in contact withother wastes or substances, and shall include waste specified in Schedule I, II & III ofthe Rules. (MoEF, Hazardous wastes (Management, handling and TransboundaryMovement) Rules, 2008)Hazardous wastes may be defined as wastes of industrial, institutional or consumerorigin. In some cases although the active agents may be liquid or gaseous, they areclassified as solid wastes because they are confined in solid containers. Typicalexamples are: solvents, paints and pesticides whose spent containers are frequentlymixed with municipal wastes and become part of the urban waste stream. Certainhazardous wastes cause explosions in incinerators and fires at landfill sites. Others,such as pathological wastes from hospitals and radioactive wastes, require specialhandling at all time. Good management practice should ensure that hazardous wastesare stored, collected, transported and disposed off separately, preferably after suitabletreatment to render them innocuous. (CPHEEO)Apart from Hazardous wastes generated from industrial areas, households docontribute some of the wastes that are hazardous in nature, though they produce itoccasionally. Wastes like aerosol canes, batteries from flash lights and button cells,bleaches and household kitchen and drain cleaning agents, car batteries, oil filters andcar care products and consumables, chemicals and solvents and their empty containers,chemical based cosmetic items, ,insecticides and their empty containers, light bulbs,tube-lights and compact fluorescent lamps, paints, oils, lubricants, glues, thinners, andtheir empty containers, pesticides and herbicides and their empty containers,photographic chemicals, styrofoam and soft foam packaging from new equipment andmercury-containing products are considered as domestic Hazardous Waste and theyare to be stored separately from ‘Bio-degradable’ and ‘recyclable’ domestic waste indedicated bins and disposed by municipal authority as per the Hazardous wasteManagement Rules. (CPHEEO)3
Urban, Rural & Built EnvironmentState of Environment Report Gujarat 2012"Bio-medical waste" means any waste, which is generated during the diagnosis,treatment or immunisation of human beings or animals or in research activitiespertaining thereto or in the production or testing of biologicals, and includingcategories mentioned in Schedule I of the Bio-Medical Waste Rules. (MoEF, BioMedical Waste (Management and Handling) Rules, 1998).Biomedical waste is mainlyattributed to waste from hospitals, medical clinics and laboratories. Biomedical wastediffers from other waste because of its infectious nature which asks for specializedtreatment. It mainly contains medicines, injections, cotton, decayed body parts, bottlesand the like.E-waste is electronic waste which encompass wide range of electrical and electronicdevices such as computers, hand held cellular phones, personal stereos, including largehousehold appliances such as refrigerators, air conditioners, microwaves and manymore.E Waste means waste electrical and electronic equipments, whole or in a part orrejects from their manufacturing and repair process, which are intended to bediscarded. (MoEF, e Waste (Management & Handling) Rules, 2011, 2011)1.2 ApproachDriving ForcePressureUrbanization, EconomicDevelopment, Change inthe Life Style,Increase in WasteGeneration, Quality ofWaste GeneratedResponseStateMore investment,Improved coverage,treatment and disposalAdequacy of scientifictreatment and disposalAwarenessprogrammesImpactPollution of waterbodies, landFigure 4. 1 - Conceptual Framework: Pressures, Impact & Response along the Value chain ofWaste Management4
Urban, Rural & Built EnvironmentState of Environment Report Gujarat 2012While increasing urbanization, industrialization, fast growing rural areas and changinglifestyles are widely accepted key drivers for waste generation, the Pressures and Impacts areobserved in different magnitudes across the value chain. Hence section on waste managementpresents the status and resulting pressure caused by solid and liquid waste along different keycomponents of sanitation chain (also often termed as value chain) namely generation/capture,collection (storage and transport), treatment and disposal.Waste management has been discussed in four main sections. The responses have beendiscussed for each section in terms of institutional, financial, technology andpromotion/awareness related response measures by different government, SOLID WASTE MANAGEMENTFinanceTechnologyWASTE WATER MANAGEMENTPromotion2Source: Adapted based on Infrastructure Planning Studio Presentation on City Sanitation Plan, CEPT University, 2010First section covers domestic waste (solid and liquid) from urban centres. Urban centers(municipal corporations and municipalities1) in Gujarat have been classified into 4 Classesviz. Class A to D depending on the population. Refer Annexure I for classification of urbancenters.State of urban waste is presented for Municipal corporations and Municipal Class A to D tosee the variations in status of generation, collection, treatment and disposal due evidentlyvaried population, administrative, financial and technical capacities of Urban Local Bodies ofdifferent class. The same has also been presented for five regions 2 of Gujarat to bring outspatial variation in waste generation, collection, treatment and disposal.Second section presents the status of solid and liquid wastes generated by Gram Panchayats ofGujarat - district wise as well as for five regions as in case of Urban waste. Third section1For administrative purposes, under the BPMC Act and Gujarat Nagarpalika Act (1963), urban areasare classified as municipal corporations and municipalities. In 2001 there were 7 municipalcorporations and 159 municipalities. The remaining Census towns having population less than 15000are governed under the rural administrative setup as per the provisions of the Gujarat Panchayat Act(1995). . (Urban Development & Urban Housing Department, GoG)2The five regions have distinct geographic features, agroclimatic conditions and nature of development.5
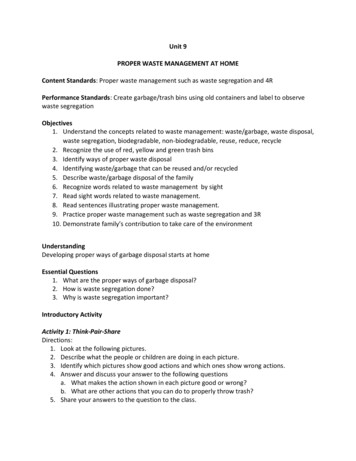
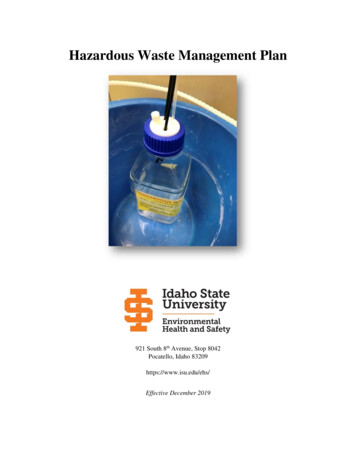
Urban, Rural & Built EnvironmentState of Environment Report Gujarat 2012covers biomedical waste management collection, treatment and disposal. Fourth sectiondetails out the E-waste generation and ongoing efforts for management in Gujarat1.3 Status of Urban Solid WasteMunicipal Solid Waste (Management & Handling) Rules, 2000 recommends the process formanaging the domestic solid waste through segregation, collection, storage, transportation,processing and disposal; and makes it obligatory on part of the Urban Local Bodies (ULBs) toexecute the same. In following section been assessed the state of urban solid waste from itsgeneration to final disposal.1.3.1 Waste CharacterizationIt would be pertinent to start with waste characterization for the Urban Solid Waste beforegoing into statistics of generation, collection, treatment & final disposal. Wastecharacterization of Urban Solid Waste was carried out by Gujarat Urban DevelopmentCompany Limited (GUDC) under the statewide project on Municipal solid wastemanagement in the year 2008-2009. The state was divided into different clusters and samplingwas done at 15 different locations within each of the ULBs. Figure 4. 2 shows the wastecharacterization averaged at state level. Analysis shows that organic waste constitutes about40 percent, followed by inert material which constitutes 22.94 percent. plastic, rubber &synthetic and paper & cardboard contribute 21.21 percent & 10.41 percent respectively.Average moisture content is 26.03 percent with calorific value of around 2232.88calorie/gram. For district wise figures refer to annex.Figure 4. 2 – Waste Characterization GujaratFigure 4. 3 - Waste Characterization inTypical Indian CityOrganic waste0.1Organic wastePaper & Cardboard21.240.74.7Inert (stone debries, Ash &Fine earth)536 4Paper & Cardboard40152710.4Glass & CeramicsTextileGlass & Ceramic22.9InertPlastic/RubberMetalPlastic, Rubber &SyntheticMetalSource: GUDC, 2008-2009Source: State of Environment Report - India, 2009Comparing the same with waste composition of typical Indian cities as shown in Figure 4. 3 itcan be said that cities of Gujarat have higher proportion of inert/stone debris in municipalwaste compared to typical Indian waste characteristics. Proportion of Glass & Ceramic is6
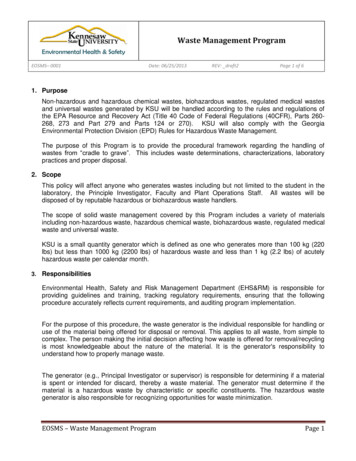
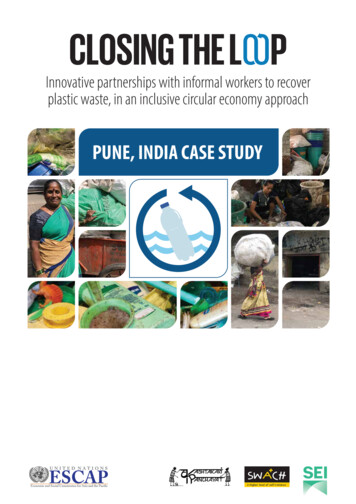
Urban, Rural & Built EnvironmentState of Environment Report Gujarat 2012almost same. organic waste constitutes almost 40 percent in both the cases while the highpercentage of plastic waste in the Gujarat indicates increasing use of plastic products.Due to the changing lifestyles there has been shift in waste composition specially paper,plastic and metal content has increased and organic content has reduced (Refer Table c,Annexure III). Current composition of organic waste, plastic waste, moisture content andcalorific value compares well with the composition of high income countries; whereas forcomposition of paper and card board, glass & ceramic waste constituents, it fits with middleincome countries. Waste composition for low, medium and high income countries and changein waste composition in India are given in annex.Understanding of waste characteristics/composition is essential requirement for thedetermination of appropriate treatment and disposal methods. Each type of waste requiresdifferent treatment before final disposal. Stones debris along with the construction anddemolition waste like brick/concrete blocks, cement, broken tiles, gypsum sheets and the likescan be crushed into smaller particles which can be then recycled to make paving blocks andconstruction blocks. Paper and cardboards can be recycled to make recycled paper and boards.Organic waste can be easily decomposed to form compost to be used as a soil enricher.Hazardous waste and biomedical waste have to be separately treated and disposed. IntegratedSolid Waste Management system tries to address this issue by proper segregation of the wastecollected so as to give them proper treatments along with maximum recycling and reuse.1.3.2 Waste GenerationGujarat cities on an average generate 345 gm/capita/day of waste as against the all Indiaaverage of 500 gm/capita/day. (Annepu, 2012) . Though some of the corporations have muchhigher per capita generation. The high rate of urbanization and cities being the driving forcehas resulted in generating huge amount of waste. Comparison of the average per capita wastegeneration in Gujarat with that of low, medium and high income countries reveals that it iseven lower than per capita generation in low income countries (410 to 685 gms/capita/day)(UNEP, 2011) (Refer section d, Annexure III); however large population results in largequantities of waste generation daily.Figure 4. 4 - Solid Waste Generated in Urban Centers of Gujarat5.304.267.33MCA10.47BC72.64DTotal solid waste generated from all theurban areas in Gujarat amounts to8566.54 tons per day. Seven MunicipalCorporations 3 contribute almost 72percent of the total Solid waste fromUrban Areas. Analysing the same acrossdifferent regions of the Gujarat (ReferFigure 4. 9 and 4.10), it is observed thatmaximum generation is through urbancenters of Central Gujarat which is of anorder of 53 percent followed bySaurashtra and North Gujarat.Source: Survey of ULBs by PAS, 2008-20093There are 8 Municipal Corporation in Gujarat as per census 2011. However, the reported data is for year 200820097
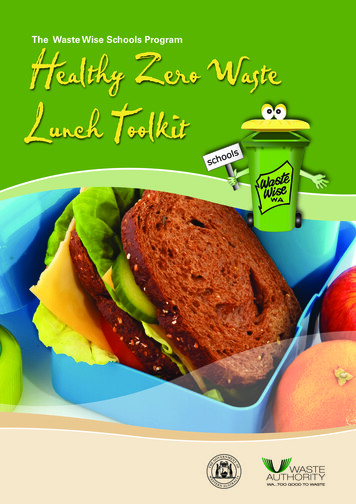
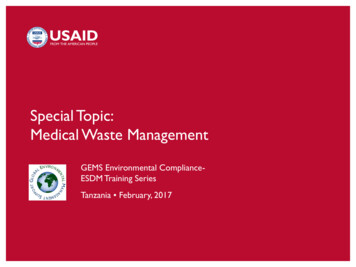
Urban, Rural & Built EnvironmentState of Environment Report Gujarat 2012Urban centers of North Gujarat and Kachchh together do contribute around 6 percent of total solidwaste generation.1.3.3 Waste CollectionPrimary collection at door step is the first step of solid waste management and determines theextent of coverage of service to the residents of the city. It is observed that all class of citieshave average waste collection efficiency ranging from 71 percent to 82 percent with class Band C cities being more efficient than others. However in some of major cities collectionefficiency is more than 95 percent.Maximum door to door collection is being done in South Gujarat, which covers almost 88percent of the total households while Kachchh covers least households under door to doorcollection. Figures on total generation and collection at household level for different classesas well as for regions of Gujarat are given in annex.Source: Survey of ULBs by PAS, th Gujarat77SaurashtraKachchh5575North Gujarat80Central Gujarat1009080706050403020100Figure 4. 6 - Household Level CoverageRegionwise(%) (Class wise)MunicipalCorporationFigure 4. 5 - Household Level Coverage (% )Source: Survey of ULBs by PAS, 2008-2009Figures suggest that percentage coverage of household collection of municipal solid waste hasbeen consistently increasing in Class B, C & D cities in last three years, where as in Class Acities have shown a minor decline in the year of 2009 this could be attributed to rapid growthof Class A cities and their inability to cope with demand of services.Data for selected corporations for household collection of wastes indicates that quantum ofwaste collected has increased many fold in Ahmedabad and Surat. Refer annex for householdcollection figures for 14 cities for the year 1999 & 2009.8
Urban, Rural & Built EnvironmentState of Environment Report Gujarat 2012Figure 4. 7 – Change in household level collection in Gujarat100806020074020082020090ABCDClassSource: Directorate of Municipalities, 2007-09, Survey of ULBs by PAS 200830002500TPD2000HH Collection (1999) as perSurvey Conducted by NIUA15001000500JunagadhSuratBhavnagarAhmedabad0HH Collection (2009) as perSurvey Conducted by PASFigure 4. 8 – Variation in household level collection of waste for few Select Cities over thedecadeSource: NIUA, 1999 & Survey of ULBs by PAS, 2008-091.3.4 Waste Treatment & DisposalOut of total waste generated 8566.54. TPD, 17.58 percent is put into treatment system, 63.21percent is thrown into open dumps and only 1.63 percent is disposed into Scientific LandfillSites (SLF) after due treatment and about 17.58 percent of the waste generated is left unattended.All the cities together have waste treatment facilities of an order of 2637.20 TPD of whichthey receive and treat 1505 TPD (only 5.6 percent of the total solid waste generated). Whichmeans only 57 percent of the installed capacity is utilized, which indicates a substantivequantity of untreated waste dumped into open.This highlights substantial need of implementation of more number of innovative andeffective waste treatment systems. Dumping areas which are receiving huge quantities of thiswaste need to be designed scientifically to reduce its impact on the environment. Of the totalwaste treated 89 percent is treated in Municipal Corporations, 8 percent in class C and Dtogether and remaining 3 percent in class A and B. This can be largely attributed to large9
Urban, Rural & Built EnvironmentState of Environment Report Gujarat 2012number of vermi composting and composting plants available with the towns 4. It alsohighlights the fact that capital intensive and highly technical system to treat and dispose wasteis feasible in Municipal Corporations.Figure 4. 9 – Status of Urban Solid Waste Management in Gujarat (Class 4010001400MCABCDTotal Solid waste generated in ULB (TPD)Total Solid Waste Collected from from HHs by Door to Door Collection (TPD)Capacity of all the Installed Treatment Facility (TPD)Quantity of waste input in Treatment Systems (TPD)Quantity of waste received in Open dumps (TPD)Quantity of waste received in Scientific Land fill site(TPD)Source: Survey of ULBs by PAS, 2008-2009Only four Municipal Corporations own compliant scientific landfill sites; two in Surat, one inRajkot and one in Vadodara and one in Ahmedabad 5.Looking at treatment capacity, urban centers of North Gujarat are have maximum treatmentfacility available i.e. almost 42 percent of total waste generation and Katchchh has minimaltreatment facility of only 10 percent of total waste generation. Though North Gujarat hasmaximum treatment facility, input to the treatment plants is only 23 percent of total capacitywhich leads to significant amount of open dumping, i.e. 80 percent of total waste generation.Class wise and Region wise details of solid waste treatment & disposal is given in Annex. ForDistrict wise details too please refer to Annex.4These were funded by Government of Gujarat, through GUDC project on Municipal Solid Waste ManagementAs reported by AMC, Ahmedabad has capacity wise Asia's Biggest Secured Engineered Landfill Site at‘Gyaspur’, being Operational Since 14.10.2009 with a capacity of 1.15 million tons of Phase I. It has Alsoearmarked land of 164 acres for future need of 30 years for more 5 phases.510
Urban, Rural & BuiltState of Environment Report Gujarat 2012EnvironmentFigure 4. 10 – Summary: Status of Urban Solid Waste Management in Gujarat (Region wise)5000.00 Central GujaratKachchhNorth GujaratSaurashtraSourth GujaratTotal Solid waste generated in ULB (TPD)Capacity of Installed MSW Treatment SystemsQuantity of waste input (in all the Treatment Systems TPD)Quantity of waste rejected after treatment (e.g., inert matter) (TPD)Quantity of waste received in Open Dumps(TPD)Source: Survey of ULBs by PAS, 2008-2009Figure 4. 11 and 4.12 clearly show that though North Gujarat and Saurashtra have better installedcapacity for the treatment of waste the net used capacity is high in South Gujarat. It also highlightsthe fact that there have been investments in treatment facilities made in North Gujarat which is notyielding results. Thus it is important to revisit the infrastructure created to analyse its actualutilization. The reasons for this could be low technical knowledge, inappropriate technology ormerely incomplete structures or systems installed.Figure 4. 11 - Municipal Solid Waste:Generation v/s Installed CapacityIn urban Centers of GujaratSource: Survey of ULBs by PAS, 2008-20092008-2009Figure 4. 12 - Municipal Solid Waste:Installed Capacity v/s UtilisationIn urban Centers of GujaratSource: Survey of ULBs by PAS,11
Urban, Rural & BuiltState of Environment Report Gujarat 2012Environment1.4 Status of Urban Liquid WasteIn December 2008 India published its first National Urban Sanitation Policy to achieve theMDG goal by 2015. The policy aims at “All Indian cities and towns become totallysanitized, healthy and liveable and ensure and sustain good public health and environmentaloutcomes for all their citizens with a special focus on hygienic and affordable sanitationfacilities for the urban poor and women.”This policy provides a guiding principle for states to design their programs and strategies toachieve 100 percent sanitation in all cities. It induces the cities to prepare city sanitation planthrough a sanitation task force and consider all aspects and sections of the citizens inachieving open defecation free and environmentally safe cities. This highlights the need oftoilets and drainage system in urban centers. The vulnerable section of the cities includingslums need to be the priority to reduce the health and environment risk due to impropersanitation.1.4.1 Toilet Coverage and Coverage of Sewage Network:Urban liquid waste or sewage from cities is mainly organic waste from toilets, septic tanksand storm drains. Average toilet Coverage in terms of percent of total households in Gujaratis about 82 percent for the urban centers with maximum at Corporations and least in Class Dtowns. Out of 166 urban centers of all the class including corporations, 67 urban centers (40percent) (Figure 4. 13) are sewered and rest do not have piped sewage network.Table 4. 1 – Toilet Coverage and Coverage & Efficiency of Waste Water Collection Networkin Urban Centers of GujaratClassMCABCDTotal Number ofCities/TownsCoverage of toilets(% of total households)7841881338244836478Coverage of wastewaternetworkservices(%oftotalhouseholds )WW collected bysewage : Survey of ULBs by PAS, 2008-200912
Urban, Rural & BuiltState of Environment Report Gujarat 2012EnvironmentFigure 4. 13 – Sewage Network in the Urban centers of Gujarat (Class wise)70No. of Cities/Towns605040Non ource: Survey of ULBs by PAS, 2008-2009Municipal Corporations register maximum coverage in terms of individual householdsconnected with sewage network followed by Class B & Class A cities. Very less percentagefor Class C & D towns is attributed to the fact that these towns do not have establishedsewage network in place. Collection efficiency for the Corporations ranges from 64.9 percent(Ahmedabad) to 100 percent (Vadodara). Figure 4. 14 explains the situation in differentregions of Gujarat. Saurashtra and North Gujarat are have very few sewered cities whereasKachchh cities have a better drainage system laid. This could be due to new infrastructurelaid post earthquake.Figure 4. 14 - Sewage Network in the Urban centers of Gujarat (Region wise)70No. of Cities/Towns60504027302010015Kachchh610Non Sewered162710Sourth Gujarat Central Gujarat North Gujarat49Sewered15SaurashtraRegionSource: Survey of ULBs by PAS, 2008-2009Figure 4. 15 - Waste Water Generated in Urban Centers of Gujarat (% of Total wastewatergenerated in the state))13
Urban, Rural & BuiltState of Environment Report Gujarat 2012Environment4.454.887.76MC9.42ABCD73.48Source: Survey of ULBs by PAS, 2008-2009The total urban domestic sewage generated in the state of Gujarat amounts to 2288 MLD ofwhich 73 percent is contributed by 7 Municipal Corporations. About 70 percent of the totalsewage generated can be managed by available treatment facilities with total treatmentcapacity of 1639.2 MLD. Figure indicates that Class C towns can treat 95 percent of theirwastewater generation with total treatment capacity of 106 MLD against total waste watergeneration of 112 MLD. But distributions of STPs are skewed. Out of 44 cities in the Class Conly 5 cities have primary treatment facility.MLDFigure 4. 16 – Treatment Capacity for Urban Liquid Waste in 23 1167.7MCATotal Waste Water Generated (MLD)Installed Capacity of STPs (MLD)BCDTotal Waste Water Collected (MLD)Waste water Treated (MLD)Source: Survey of ULBs by PAS, 2008-2009Whereas Municipal Corporations have treatment capacity of an order of 86 percent of totalwaste water generation. Class B and Class D towns are in a deplorable state havinginsignificant treatment facilities. Class B towns have treatment capacity of only 4 percent oftotal waste water generation while class D towns do not own any kind of treatment facility atall. (Figure 4. 17).14
Urban, Rural & BuiltState of Environment Report Gujarat 2012EnvironmentMLDFigure 4. 17 - Status of Urban Liquid Waste treatment in Gujarat180016001400120010008006004002000Estimated quantity of untreatedWaste Water (MLD)Treated Waste Water (MLD)MCABCDClassSource: Survey of ULBs by PAS, 2008-2009On an average 53 percent of all the waste water generated in Gujarat is being treated.Municipal Corporations treat almost 70 percent of all the waste water generated by themwhile class A and class C cities/towns treats almost 12 and 16 percent of total wastegenerated by them respectively.Analysing the figures region wise suggests that Kachchh has maximum numbers ofcities/towns connected with piped sewage network, of an order of 84 percent whileSaurashtra registers least number of cities
categories mentioned in Schedule I of the BioMedical Waste Rules. - (MoEF, Bio-Medical Waste (Management and Handling) Rules, 1998).Biomedical waste is mainly attributed to waste from hospitals, medical clinics and laboratories. Biomedical waste differs from other waste because of its infectious nature which asks for specialized treatment.