Transcription
Creating a Hertzsprung-Russell DiagramSubject: Science, MathGrade Level: 6th-8thRational or Purpose: This activity introduces concepts of absolute and apparentmagnitude of stars. It will help students group similar stars to see the relationship ofcolor and magnitude.Materials: (For each student) Scissors Tape or glue Colored pencils: red, orange, yellow, blue Metric rulerDocuments: Stars of Constellation Orion H-R Diagram Sheet Conclusions WorksheetLesson Duration: 45-50 minutesSources:Hertzsprung-Russell diagram. (2007, September 3). In Wikipedia, The FreeEncyclopedia. Retrieved 01:52, September 20, 2007Science TEKS:6th Grade Science: (2B), (2C), (2D), (2E), (3A), (3D), (4A), (4B), (7B), (13A)7th Grade Science: (2B), (2C), (2D), (2E), (3A), (3D), (4A), (4B)8th Grade Science: (2B), (2C), (2D), (2E), (3A), (3D), (4A), (4B), (10B), (10C),(13A), (13B)Background Information:Two major characteristics of stars are their color and their brightness or magnitude.Absolute magnitude is the brightness of the star if it was a set distance away from earth,about 32.6 light years. Apparent magnitude is the brightness of the star as seen fromearth. Magnitude is given the value of a number, the smaller the number, the brighterthe star. Color depends on and is determined by the star’s surface temperature. Hottertemperatures are blue in color while cooler temperatures are red in color. Truebrightness depends on the star’s diameter or size. The larger the star is the brighter it is,and the smaller the star is the less bright it is.Teaching Module developed by Karri HickmanEnvironmental Science Institute (http://www.esi.utexas.edu)
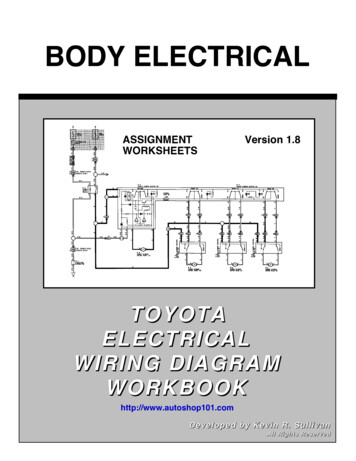
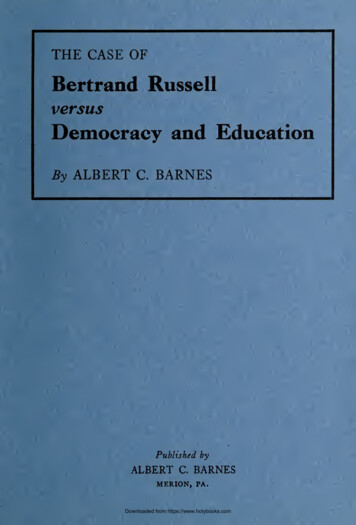
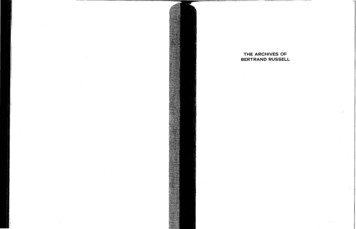
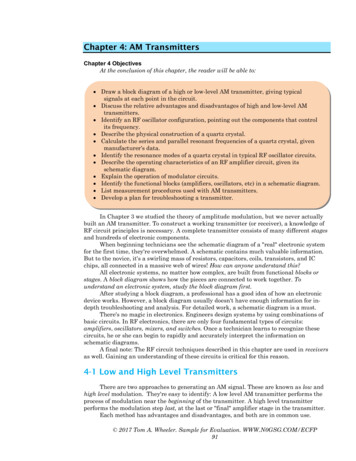
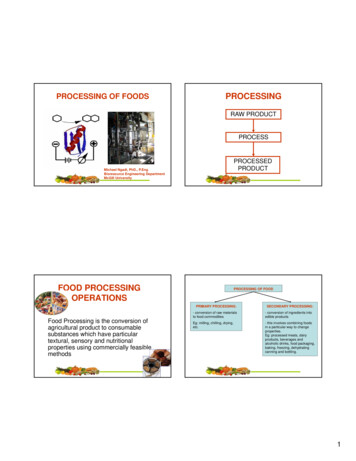
Star color or the temperature is often plotted on a graph against true brightness. Twoastronomers used this information and created the Hertzsprung – Russell diagram.Sometimes luminosity is also plotted on the diagram. Luminosity is a measure of howmuch energy leaves a star in a certain period of time. Generally, the more luminous astar is, the brighter the star is. The luminosity of a star is not only affected bytemperature but also by size. The most luminous stars would be those that are largeand hot and the least luminous would be small and cool. In some cases, there areexceptions to this rule.Activity:Students will be able to practice measurement and graphing skills. They will discoverthe relationships between different types of stars, and they will create their ownHertzsprung - Russell diagram.Procedure:1. Take a look at the figure of the constellation Orion. The circles represent thestars of the constellation Orion. The diameter of the stars represents theirmagnitude.2. Trace the stars on another sheet of paper.3. Color each star with the appropriate color and then cut them out.4. Measure the diameter of each star and place them in the H-R Diagram Graphaccording to their size and color.5. Tape or glue the stars to the diagram.6. If you have more than one star that looks alike in diameter and color, group themin a small area on the graph.7. Use the graph to answer the questions.Teaching Module developed by Karri HickmanEnvironmental Science Institute (http://www.esi.utexas.edu)
Teaching Module developed by Karri HickmanEnvironmental Science Institute (http://www.esi.utexas.edu)
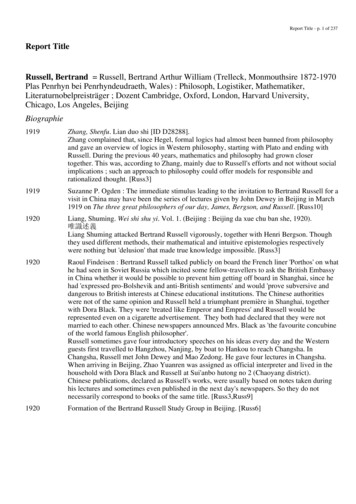
bluewhiteyelloworangeStar ColorTeaching Module developed by Karri HickmanEnvironmental Science Institute (http://www.esi.utexas.edu)red
NameDate:Class Section:The Hertzsprung – Russell Diagram1. Look at your graph. Do you see a pattern of stars on your graph? This patternof stars is called the main sequence. Label it on your diagram. Describe thepattern made by the stars on your graph.2. List all the types (color and size) of stars that are found in the main sequence.3. Which stars (three groups) on your graph are not part of the main sequencestars?4. Describe the relationship between star color and true brightness for stars in themain sequence.5. Is the Sun a main sequence star? Why or why not?Environmental Science InstituteThe University of Texas at Austin
Write in the following temperatures for the corresponding colors on yourdiagram:Red3,500 KOrange5,000 KYellow6,000 KWhite11,000 KBlue25,000 K6. What is the approximate surface temperature of our yellow sun? Its size?7. What is the color of the stars shown on the diagram that has the highest surfacetemperature?8. What is the color of the stars that have the lowest surface temperature?9. How is it possible for white dwarfs to have a lower luminosity than the sun eventhough the sun is much cooler than the white dwarfs?10. How are red giants and blue giants similar? How are they different?sEnvironmental Science InstituteThe University of Texas at Austin
the relationships between different types of stars, and they will create their own Hertzsprung - Russell diagram. Procedure: 1. Take a look at the figure of the constellation Orion. The circles represent the stars of the constellation Orion. The diameter of the stars represents their magnitude. 2. Trace