Transcription
AbstractBecause MOOCs bring big data to the forefront, they confront learningscience with technology challenges. We describe an agenda for developing technology that enables MOOC analytics. Such an agenda needs toefficiently address the detailed, low level, high volume nature of MOOCdata. It also needs to help exploit the data’s capacity to reveal, in detail,how students behave and how learning takes place. We chart an agendathat starts with data standardization. It identifies crowd sourcing as ameans to speed up data analysis of forum data or predictive analyticsof student behavior. It also points to open source platforms that allowsoftware to be shared and visualization analytics to be discussed.AUTHORSUna–May O’Reilly, Ph.D.Massachusetts Instituteof TechnologyKalyan Veeramachaneni, Ph.D.Massachusetts Instituteof TechnologyTechnology for Mining the Big Data of MOOCsMassive Open Online Courses (MOOCs) are college courses offered on theInternet. Lectures are conveyed by videos, textbooks are digitized, and problem sets,quizzes and practice questions are web–based. Students communicate with one anotherand faculty via discussion forums. Grading, albeit constrained by somewhat restrictiveassessment design, is automated.The popularity of MOOCs has made a high volume of learner data available foranalytic purposes. Some MOOC data is just like that which comes from the classroom.This can include teaching material, student demographics and background data, enrollmentinformation, assessment scores and grades. But very important differences arise betweenMOOC and classroom in how behavioral data is collected and what is observable. Theplatform records, unobtrusively, through input, capture every mouse click, video playercontrol use, and every submission to the platform such as problem solution choice selection,solution composition or text entry for a forum discussion. The level of recorded detail ofbehavior in a MOOC vastly surpasses that recorded in conventional settings.Very directly, this data can provide a count of problem attempts and video replays.It can reveal how long a student stayed on a textbook page or the presence of very short,quick patterns of resource consultation. It can inform an individualized or aggregatedportrait of how a student solves problems or accesses resources. It presents opportunities toCORRESPONDENCE identify and compare different cohorts of students in significant quantities, thus enabling usto personalize how content is delivered. It allows us to study learner activities not exclusiveEmail to problem-solving, such as forum interactions and video-watching habits (Thille et al.,2014). It also facilitates predictive analytics based on modeling and machine learning.unamay@csail.mit.eduThis data also contains large samples. Large sample sizes enable us to rigorouslyconfirm or deny long held hypotheses about how learning takes place, whether there existlearning styles, whether there are effective ways to learn or teach types of material or whetherthere are effective concept correction strategies to help a student who has made an error.Volume Nine Winter 201429
Beyond comparative studies, from a predictive modeling standpoint, we can build and validatepredictive models at a scale never done before. For example, we can now build a reliablepredictor for which students will exit the course before completion (Taylor, Veeramachaneni,& O’Reilly, 2014). In short, MOOC big data is a gold mine for analytics.The enormous potential of MOOC big data prompts the questions: what are theappropriate ways to fully tap into it? What technology can be brought to practice to analyzeit more efficiently and broadly? The process of answering these questions reveals challenges.The data is high volume and low–level in nature. Complete answers to any research questionneed to analyze the data from multiple entities, i.e., courses, platforms, institutions. Theperspectives of multiple parties – students, instructors and education researchers – need tobe explored.We have decided to focus our research agenda on the challenges that arise fromMOOC data characteristics and analytics needs. We have embraced increasing the number ofcontributors to MOOC analytics and accelerating analytics accomplishments as our centralmission. We are focusing on developing community–oriented means of sharing software andanalytic development efforts.We start by proposing data standardization as a cornerstone. It will resolve thedifferent formats of data resulting from different platforms. It will prevent MOOC data fromfollowing the path of healthcare data, which, even if privacy issues are completely resolved, isfragmented by different formats. It will also make the task of extracting variables for analysesmore efficient, collaborative and sharable. We next propose easy–to–use, web–based platformsthat democratize different aspects of data analytics: MOOCviz lets anyone share visualization software and theiranalytic renderings. FeatureFactory helps learning scientists enumerate possible variables fortheir models. LabelMe–Text helps learning scientists engage the crowd to get helptagging forum posts before they use machine learning to automate alabeler from the tagged examples.MOOCdb – A Cornerstone for Shared AnalyticsLarge sample sizes enableus to rigorously confirmor deny long held hypotheses about how learningtakes place, whether thereexist learning styles,whether there are effective ways to learn orteach types of material orwhether there are effectiveconcept correction strategies to help a student whohas made an error.In order for a data oriented platform or framework to allow anyone to use it, it needsto either deal with many formats of data or be able to expect that all data is in a commonformat. The former proposition imposes a lot of extra work versus the latter. It leads to differentversions of software. It bulks logic in software to dealing with format differences and it requiressoftware updates every time a new format emerges. Thus, to make the latter proposition viable,we have pioneered a standardized schema for MOOC data (i.e., a data model) that is platformagnostic. It is called MOOCdb (Veeramachaneni, Halawa, et al., 2014).The MOOCdb data model originally organized MITx data generated from the MITxplatform that has now transitioned to edX. It offers advantages beyond what we emphasizehere, among them removing the need to share data, independence from platform specificsand facilitating a data description that outsiders can refer to when contributing expertise indata privacy protection or database optimization. During the past year, we have adapted itto also capture the data subtleties and idiosyncrasies of both edX and Coursera platforms. Aperiodically updated technical report explains the data model, all the fields and how they areassembled for each platform. Complete documentation for MOOCdb and its data model will beperpetually updated via the wiki site http://moocdb.csail.mit.edu/wiki.The MOOCdb data model is based on some basic core actions that studentstake on any online learning platform. Students usually interact with the platform in fourdifferent modes: Observing, submitting, collaborating and giving feedback. In observingmode students are simply browsing the online platform, watching videos, reading material,reading books or watching forums. In submitting mode, students submit information tothe platform. This includes submissions towards quizzes, homework, or any assessmentmodules. In collaborating mode students interact with other students or instructors on30Volume Nine Winter 2014
forums, collaboratively editing wiki or chatting on Google hangout or other hangout venues(Veeramachaneni, Halawa, et al., 2014).To date, much of the analyses on MOOC data have been conducted with techniquestransferred from conventional learning analytics or modestly adapted from them.1 In thefirst three stages of their study, Breslow et al. (2013) followed a conventional methodologyadapted for MOOC relevant questions. They worked with coarse–grained variables. That is,they studied the aggregate of certificate earners (choosing not to further subdivide students),they operationalized achievement to use the course grade (choosing not to consider specificproblem set grades or time sequences of assessment grades) and they referenced factors suchas age, gender and highest degree earned (choosing not to reference behavioral factors suchas instructional component access). MOOCdb standardization will further leverage suchwork because it supports the extraction of quantities that can be composed into fine grainedvariables. It allows anyone to formulate (and answer) learning science research questionsthat are adaptations of conventional methods considering finely subdivided students, theirachievements and their access of MOOC’s instructional components.Infrastructure for Sharing Data VisualizationsTransforming data into meaningful visualizations is a core part of any data science. InMOOC data science, different institutions, local research communities, user groups and othersorts of organizations, each have multiple stakeholders who have different needs that requiredata to be transformed in a different way and visualized. Ideally, they want to support eachother as much as possible in this context by sharing software, demonstrations and opinions ondesign and interpretations of data.Visualization infrastructure can provide one means of supporting this. HarvardX andMIT’s Office of Digital Learning enable visualizations of their MOOC data2,3 via complementarywebsite entitled Insights. These visualizations use world maps to show enrollment, certificateattainment by country, gender, education levels and age composition (Ho et al., 2014; Nesterkoet al., 2013). Visualizations referencing clickstream or forum data are currently not available4likely because plotting these streams is significantly more complicated. A streamlined workflowthat reduces development time through software sharing and data standardization wouldreduce these complications.We start by proposingdata standardizationas a cornerstone. It willresolve the differentformats of data resultingfrom different platforms.It will prevent MOOCdata from following thepath of healthcare data,which, even if privacyissues are completelyresolved, is fragmentedby different formats.The Insights website is also used as a distribution point and makes a modest attemptto encourage other visualizations that reference the data. For example, along with the datathat populate visualizations, Insights makes source code and documentation available fordownload,5 though only as separate, non–integrated files. The website exemplifies a strongbut minimal starting point for providing visualization infrastructure. Ideally, even beyondsupporting better–integrated software sharing, an infrastructure needs to support thecontribution of new visualizations. These should be able to come from others, i.e., not onlythe site’s creators. Opening access to the community, so they can contribute, will allow manydifferent questions to be answered by data visualizations expressed in multiple ways. It willaddress the reality that different people perceive different visualizations as useful.People analyzing visualizations for their usefulness tend to zero in on either on theaesthetics of the visualization, e.g., a style choice like bar or pie chart, color or interactionIn the first paper in RPA on MOOCs, Breslow et al. (2013) note: Our first challenge has been choosing, or in some casesadapting, the methodological approaches that can be used to analyze the data. If educational researchers studying conventionalbrick and mortar classrooms struggle to operationalize variables like attrition and achievement, it is doubly difficult to do so forMOOCs (p. 14).1MITx Insights is a collection of interactive data visualizations for all MITx offerings, updating at frequent, regular intervals.These visualizations are released along side a complementary set of visualizations from the HarvardX Research Committee. (url:http://odl.mit.edu/insights/)2HarvardX Insights is a collection of interactive visualizations of learner data, which dynamically update at frequent, regularintervals. (url: n their reporting, the team notes: “The MITx and HarvardX Research teams intend for future interactive visualizations toinclude more nuanced descriptions of student participation and learning in our open online learning environments.”4It is highly structured and organized so whether it will support different visualizations is an open question (see e–literate for anopinion).5Volume Nine Winter 201431
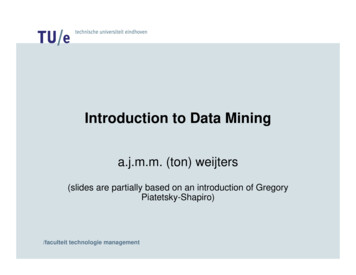
mode, or on the way the data was organized and aggregated before it was visualized.Such remarks motivate a fundamental goal for visualization infrastructure: to support aproliferation of many views of same data. This goal has driven us to develop a platform calledMOOCviz that we now describe.For example, we can nowbuild a reliable predictor forwhich students will exit thecourse before completion.MOOCviz – Sharing Software and Outcomes of VisualizationThe MOOCviz platform (Figure 1) is designed to serve the diverse needs of a broadgroup of stakeholders and facilitates the sharing of software, demonstrations and opinions ondesign and interpretations of data. It enforces source code organization, allows source codeto be contributed to a repository and it provides a means of web–based discussion around avisualization, all fundamental tenets for a community oriented infrastructure.Transforming data to create visualization typically requires three steps: source dataextraction, variable formation (typically aggregation) and rendering. Each of these steps issomewhat specialized according to each situation. They embed some assumptions and integratesome heuristics to transform and shape the data to create an interesting and informativevisualization. Anyone with access to MOOC data in MOOCdb schema can develop a brandnew visualization, modularize their software into the aforementioned three steps, extract,aggregate and render, and then upload the modules into MOOCviz’s software repository alongwith their first demonstration of the new visualization for other members to use and view.Figure 1. Current state of the MOOCviz platform. Users can select the course for which they wouldlike to see the visualization (see [3]). The visualization is rendered in panel [1] and is described belowthe panel (see [2]). The workflow that generated the visualization from MOOCdb is shown below thedescription. users can click on any of the icons in the workflow and corresponding software or data isshown in panel parked as [4]. Users can upload the visualization for a new course by using the "NewOffering" functionality (see [5]). [6] allows usersto download the entire code from data extraction,aggregation to visualiztion.In order to help a viewer choose between different visualizations, it will use popularity to rank multiple visualizations and onlyshow the most popular one.632Volume Nine Winter 2014
The MOOCviz platform software will eventually be shared under an open sourcelicense, and an organization or an instructor will be able to download and install it to createan independent instance, which they can populate with visualizations of their own data inMOOCdb format. Any member of the community will be able to enhance the platform’s opensource software and customize it to support specific use cases; e.g., cross–course comparisonsor a single course report with multiple visualizations.A MOOCviz platform offers: A central, shared gallery of participant–generated visualizations for a listof courses for which they have been rendered. The ability for the participants to download the software that generatesvisualizations and execute it over their own course data that is formattedin MOOCdb schema. They will also be able to automatically package theresulting rendered visualization and upload it to the gallery, adding to thelist of courses. A means to contribute software for new visualizations to the gallery viathe MOOCviz web–based interface. A means of commenting on any existing visualization by posting in thecomments section underneath it. Discussions are free form. They likelywill extend beyond the interpretation or thoughts provoked by thevisualization to the ways that the data have been transformed inextraction and aggregate steps. We expect that discussions will stimulateideas for new visualizations.Infrastructure for Supporting Feature EngineeringScaling feature engineering involves three processes: proliferation of an ideationprocess, the process in which candidate features are posited; support for an operationalizationprocess, in which a mapping is formed between the data sources and the feature; and a featureextraction process, in which software is written to realize instances of these features.The study of stopout, that is, predicting when students stop engaging course materialbefore completion, provides an example (Taylor et al., 2014). If the outcome set is whetheror not a student stops out, what predicts a stopout could include frequency of forum posts,grades to date, most recent problem set score, time spent watching videos, etc.In order for a dataoriented platform orframework to allowanyone to use it, it needsto either deal with manyformats of data or be ableto expect that all data is ina common format.We have been formulating predictive and explanatory features for stopout. In thecourse of doing so, we have observed that the set of possible features for an outcome is likelymuch larger than we ourselves can propose (Veeramachaneni, O’Reilly, & Taylor, 2014). Thisis because our own experiences (or lack thereof), biases and intellectual context can go onlyso far and may be imposing limits on our investigations. This is a shortcoming not unique tous alone.When working on stopout prediction (Taylor et al., 2014), we first tried to address thisshortcoming by setting up meetings with students and instructors of a MOOC. At the meeting,we would solicit in person via a somewhat informal protocol, a group’s input for predictors ofstopout. We asked our helpers to fill out a form listing variables that would predict a studentstopping out. We would then operationalize these variables via extraction and some modestarithmetic and add them to our predictor set (Veeramachaneni, O’Reilly, et al., 2014).). Theseexercises begged a general question: how can any MOOC data science group access a widerswath of the MOOC community to expand their feature/predictor list? As well, consideringour mission to enable technology for MOOC analytics, how can we provide a general means ofcrowd access to the MOOC data science community at large?FeatureFactory – Engaging the MOOC Crowd to Provide HypothesesTo address both these questions, we are developing a second web–based collaborativeplatform called FeatureFactory. Our current version of this platform is shown in Figure 2.FeatureFactory offers two modes of engagement:Volume Nine Winter 201433
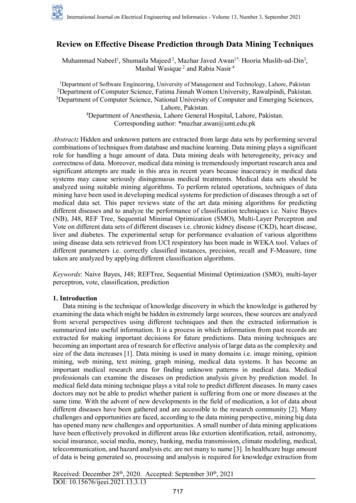
The solicit mode is used by MOOC data science, education technology,or learning science research teams. A team describes the outcome it iscurrently studying or trying to predict. They give examples of what features orexplanations are sought and it solicits help from the MOOC crowd. In the second mode, helping, the crowd proposes, explanations or variables,and suggests means to operationalize them. They provide comments onproposal or vote them up or down in popularity. The software savvy amongthem write and share software scripts written to operationalize the mostpopular or compelling proposals.The MOOCdb data modelis based on some basiccore actions that studentstake on any online learning platform. Studentsusually interact with theplatform in four different modes: Observing,submitting, collaboratingand giving feedback.Like MOOCviz, we intend to open source license and share the FeatureFactory platformsoftware, so that an organization can create its own independent instance for local use. Anorganization can also customize their instance by modifying the platform source. They can usetheir platform in contexts when they need to garner assistance from the MOOC crowd.Figure 2. Current state of the FeatureFactory platform. In this illustration we show a screen shot ofthe website. First the rationale behind the FeatureFactory is described (see [1]), the current prediction problem of interest is described and the role participants can play is described (see [2]). Participants can submit a new idea using "Add an idea" (see [3]). Ideas collected so far are revealed under"Existing ideas and scripts" (see [4]). Participants can view the code (if available), comment on theidea and vote on the idea. All input from participants is collected in the back end in a database.34Volume Nine Winter 2014
Infrastructure for Annotating TextA central component of MOOC data is discussion forums. They are of great interestbecause they provide a lens on inter–student communication that, in turn, relates to learningscience theories of engagement and achievement and self–efficacy. Most such languageunderstanding tools rely on annotations of the content by humans (Gillani, 2013; Gillani &Eynon, 2014) and then employing machine learning to automatically annotate the text. Theannotations range from qualifying the sentiment of the post, to tagging the posts by theirtypes (content related, social affective, administrative, and other) to type of post (help seeking,help providing, neither) and many others. These tags help analyze the posts to understandthe mood of the class, group posts by categories when presenting to the instructors, teachingassistants and others, categorizing students based on their post types so interventions can bedesigned, generating predictive variables for models on a per student basis and understandingthe social discourse in the course (Rosé et al., 2014; Yang, Sinha, Adamson, & Rosé, 2013).A working paper by Stump, DeBoer, Whittinghill, and Breslow (2013) provides adetailed account of how a protocol to annotate MOOC discussion forum posts was developed.The authors employed two students and used themselves to annotate the posts using a pre–determined set of labels derived from a categorization scheme. To facilitate their workflowthey passed around an encrypted csv file that recorded labels. They then evaluated the qualityof human annotations via a number of metrics that relate to inter–rater reliability. Theyfinally filtered out ambiguously labeled posts. While they had over 90,000 forum posts, theyfound it impossible to examine and label all of them. They had to settle for referencing 4,500labeled posts. It is obvious that interpreting an entire set of posts would be preferable. But theprocess is slowed by the involvement of humans and hindered by the awkwardness of an adhoc workflow. Concurrently, discussion arose outside the project arguing for an alternativeannotation scheme (Gillani, 2013; Gillani & Eynon, 2014). This implies that annotation needsto become much easier because it will need to be done many ways by multiple research teams.MOOCdb standardizationwill further leveragesuch work because itsupports the extractionof quantities that canbe composed into finegrained variables.This context led us to consider what MOOC specific technology we could design to dealwith such a large scale set of text and to support labeling according to the different annotationschemes of different studies. First, a web–based framework can support crowd based labelingfor larger scale labeling. Second, the process and the workflow for processing labels can bestreamlined. Third, much of the labeling can be automated. Machine learning can be used onthe set of labeled posts to learn a rule for labeling the others, based upon features in the post.To address these needs, we are developing a web–based platform called Label Me–Text.LabelMe–Text – Engaging the MOOC Crowd to Help with ForumAnnotationWe developed an online platform where users would post their tagging projects and acrowd of helpers can participate in MOOC data science by selecting a project and tagging thecontent based on some instructions. We call the online collaborative platform that serves thispurpose LabelMe–Text's.7 LabelMe’s current incarnation is shown in Figure 3. It works in thefollowing ways:Transforming datainto meaningfulvisualizations is a corepart of any data science. Users requiring annotation of natural language can create an annotation projectby providing a csv file for the content, instructions and examples for tagging. Taggers (LabelMe–Text's crowd) can participate by selecting a project, followingthe instructions and tagging the content. A database consisting of tags for the content for the project is initialized andpopulated as taggers work. A number of analytic services are provided aroundthis database such as evaluation of inter rater reliability, summary of tags,and summary of activity for a project (how many taggers helped, time series ofnumber of tags).A framework called LabelMe already exists in the Computer Vision community (Russell, Torralba, Murphy, & Freeman, 2007).We used the same name, but identify it with suffix – text, by calling it LabelMe–Text.7Volume Nine Winter 201435
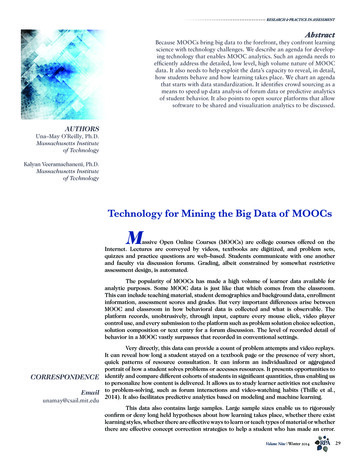
A service can be called upon to filter the tagged data based on the reliabilitymeasures just mentioned. It then uses methods based upon latent semanticanalysis to learn a tagging model. Taggers (LabelMe–Text's crowd) are given credit for every tag they have providedand the number of their tags that pass the filters to be used in model learning.Transforming data tocreate visualizationtypically requires threesteps: source data extraction, variable formation(typically aggregation)and rendering.Like MOOCviz and FeatureFactory, LabelMe–Text is open source software. Its eventualrelease will to support organizations that wish to download and create a local version of if forinternal use.Figure 3. Crowd can select a project posted by a researcher by clickin on "Projects" markedusing [B]. In this screen shot two such projects appear where it is marked as [A].A central component ofMOOC data is discussion forums. They are ofgreat interest becausethey provide a lens oninter–student communication that, in turn,relates to learning sciencetheories of engagementand achievement andself–efficacy.Figure 4. Once users select the project, they then proced to tagging/annotating a post/sentencedynamically selected by the platform from the pool of posts/sentences that need to be tagged. Thesentence is displayed (see [A]), the choices for tags are displayed underneath it (see [B]) and instructions for tagging are presented as well (see [D]). The user can select the tag and hit "Submit Labels"(see [C]). All inputs from the participants/users are stored in a structured format in the back end in adatabase.ConclusionThis paper considers the complexity MOOCs bring into learning science in view ofthe novel nature of the data they collect. It identifies certain technology challenges that needto be resolved before we can exploit the big data in MOOCs to its full potential. We call forenabling technology and for setting a course towards standardization and web–based platformsthat help a large community of people to collaborate on developing analytics. We advocateframeworks that are deliberately open source so that, when they are released, everyone will beable to customize, refine and advance them.36Volume Nine Winter 2014
AUTHORS NOTE:We would like to thank the following student teams and students who, by contributingsubstantial efforts toward platform development, have been helping us fulfill our vision asdescribed in this paper: Kiarash Adl (FeatureFactory), Preston Thompson, Colin Taylor,Brian Bell, Sherwin Wu (MOOCviz), Roy Wedge (LabelMe), Franck Dernoncourt (MOOCdb),Quentin Agren (MOOCdb), Sherif Halawa (MOOCdb). We would also like to acknowledgediscussions with Juho Kim. We are grateful for funding from Quanta Computer. We alsothank our reviewers.ReferencesBreslow, L., Pritchard, D. E., DeBoer, J., Stump, G. S., Ho, A. D., & Seaton, D. T. (2013). Studying learning in theworldwide classroom: Research into edX’s first MOOC. Research & Practice in Assessment, 8(1), 13–25.Gillani, N. (2013). Learner communications in massively open online courses. OxCHEPS Occasional Paper, 53, 1–51.Gillani, N., & Eynon, R. (2014). Communication patterns in massively open online courses. The Internet and HigherEducation, 23, 18–26.Ho, A. D., Reich, J., Nesterko, S., Seaton, D. T., Mullaney, T., Waldo, J., & Chuang, I. (2014). HarvardX and MITx: Thefirst year of open online courses (HarvardX Working Paper No. 1).Nesterko, S. O., Dotsenko, S., Han, Q., Seaton, D., Reich, J., Chuang, I., & Ho, A. D. (2013). Evaluating the geographicdata in MOOCs. In Neural Information Processing Systems.Rosé, C. P., Carlson, R., Yang, D., Wen, M., Resnick, L., Goldman, P., & Sherer, J. (2014, March). Social factors thatcontribute to attrition in MOOCs. In Proceedings of the first ACM conference on Learning@ scale conference(pp. 197–198). ACM.Russell, B., Torralba, A., Murphy, K., & Freeman, W. T. (2007). LabelMe: A database and web–based tool for imageannotation. International Journal of Computer Vision, 77(1–3), 157–173.Stump, G. S., DeBoer, J., Whittinghill, J., & Breslow, L. (2013). Development of a framework to classify MOOC discussionforum posts: Methodology and challenges. TLL Working Paper, 2013.Taylor, C., Veeramachaneni, K., & O’Reilly, U. M. (2014). Likely to stop? Predicting stopout in massive open onlinecourses. arXiv preprint arXiv:1408.3382.Thille, C., Schneider, E., Kizilcec, R. F., Piech, C., Halawa, S. A., & Greene, D. K. (2014). The future of data-enrichedassessment. Research & Practice in Assessment, 9(2), 5-16.Ve
Because MOOCs bring big data to the forefront, they confront learning science with technology challenges. We describe an agenda for develop-ing technology that enables MOOC analytics. Such an agenda needs to efficiently address the detailed, low level, high volume nature of MOOC data.