Transcription
Creating an Automated Stock Trading System in ExcelAutomated Stock Trading ngsystemCopyright (c) 2008-2018, ConnectCode Pte Ltd.All Rights Reserved.ConnectCode accepts no responsibility for any adverse affect that may result from undertaking ourtraining. No statements in this document should be construed or thought to represent investment adviceof any type since the sole purpose of the explanation is to illustrate the technique.Microsoft and Microsoft Excel are registered trademarks of Microsoft Corporation. All other productnames are trademarks, registered trademarks, or service marks of their respective owners
Table of Contents1.2.3.4.Introduction . 2Download Stock Trading Prices . 32.1Download Data from Yahoo Finance . 32.2Automating the download of Stock Prices . 4Moving Average Trends . 73.1Simple Moving Average . 73.1.1 10 Days Moving Average . 73.1.2 14 Days Moving Average . 83.1.4 Charting the Moving Average . 83.2Using the Moving Average . 93.3Wilders Moving Average . 93.4True Range . 103.5Average True Range . 113.6Directional Movement . 123.7Directional Movement Indicator . 143.7.1 Positive/Negative Directional Movement Indicator . 153.8Average Directional Movement Index . 163.9Using the Indicators . 17What Next? . 4-1Pg iiAutomatic Download of Stock QuotesVersion 1.1
1.IntroductionThe aim of this course is to allow you to use the various Stock Technical Indicators and create anAutomated Stock Trading System using Microsoft Excel. We assume that you have some basicknowledge of Excel and is interested in putting into practice the financial concepts of a technical stocktrading system.We will start from downloading Stock data and move into the calculation of the different TechnicalIndicators. The Technical Indicators include Moving Average, Directional Movement, DirectionalMovement Indicator, Average Directional Movement Index and Average True Range. The focus is ontwo aspects. The first is the understanding of the specific Technical Indicators and the second is theimplementation of the indicators in Excel.We do not guarantee that you will get rich by going through these materials but we are confident thatyou will become a better technical trader as you will be able to apply many of these TechnicalIndicators to analyse your portfolio.Pg 2-2Creating an Automated Stock Trading SystemVersion 1.1
2.2.1Download Stock Trading PricesDownload Data from Yahoo FinanceLaunch your browser and navigate to http://finance.yahoo.com. Search for the stock you require byentering the stock quote, such as “’BAC”, into the search bar. Click on the “Historical Data” link andthen the “Download Data” link as shown.When prompted, click on “Open” to download the data to Excel.You should see the following stock data in Excel.Pg 2-3Creating an Automated Stock Trading SystemVersion 1.1
2.2Automating the download of Stock PricesThe methods above are useful when you are exploring what kind of data to download to Excel.However, it will be laborious to go through all the steps to download the price of a specific Stocksymbol. This section will show you how to automate the download of the Stock Prices. We will beusing a simple programming language called Visual Basic for Applications (VBA). If you will like to findout more about VBA, you will be interested to know that spreadsheetml.com offers a VBA course onour website. Otherwise, please be assured that we will be going through the steps, one at a time toallow you to construct the models without prior knowledge of VBA.Launch Excel and create a new workbook. Call this workbook AutomatedDownloadData.xls.In Microsoft Excel 2003: Go to Tools- Macro- Visual Basic EditorIn Microsoft Excel 2007: Go to Developer- Visual BasicRight click on VBAProject (your Excel Filename) and select Insert- Module. A default “Module1” willbe inserted. Click on Module1 and paste the VBA code below on the right-hand side of the VisualBasic Editor. The following VBA codes allow you to download data from Yahoo Finance based on aspecified Stock symbol, Start Date and End Date.Sub GetStock(ByVal stockSymbol As String, ByVal StartDate As Date, ByVal EndDate As Date)On Error GoTo ErrHandler:Dim freq As StringDim crumbAs StringDim cookieAs StringDim responseAs StringDim strUrl As StringDim DownloadURL As StringDim period1, period2 As StringDim httpReq As WinHttp.WinHttpRequestSet httpReq New WinHttp.WinHttpRequestfreq "1d"DownloadURL "https://finance.yahoo.com/lookup?s " & stockSymbolWith httpReq.Open "GET", DownloadURL, False.setRequestHeader "Content-Type", "application/x-www-form-urlencoded; charset UTF-8".send.waitForResponseresponse .responseTextcookie Split(.getResponseHeader("Set-Cookie"), ";")(0)End Withperiod1 (StartDate - DateValue("January 1, 1970")) * 86400period2 (EndDate - DateValue("January 1, 1970")) * 86400Dim counter As LongDim startCounter As LongDim result As StringDim dataResult As StringDim startResult As StringPg 2-4Creating an Automated Stock Trading SystemVersion 1.1
crumb Chr(34) & "CrumbStore" & Chr(34) & ":{" & Chr(34) & "crumb" & Chr(34) & ":" &Chr(34)startCounter InStr(response, crumb) Len(crumb)While Mid(response, startCounter, 1) Chr(34)result result & Mid(response, startCounter, 1)startCounter startCounter 1Wendcrumb resultDownloadURL oad/" & stockSymbol &"?period1 " & period1 & "&period2 " & period2 & "&interval " freq "&events history&crumb " & crumbstartResult ""startCounter 0While (startResult "Date" And startCounter 8)With httpReq.Open "GET", DownloadURL, False.setRequestHeader "Cookie", cookie.send.waitForResponsedataResult .responseTextEnd WithstartResult Mid(dataResult, 1, 4)startCounter startCounter 1WendIf (startResult "Date") ThennoErrorFound 0GoTo ErrHandlerEnd IfdataResult Replace(dataResult, ",", vbTab)Dim dataObj As New DataObjectdataObj.SetText dataResultdataObj.PutInClipboardSet currentWorksheet ThisWorkbook.ActiveSheetSet currentRange ction.EntireColumn.Insert , CopyOrigin: Cut Destination: Columns("F:F")Range("A1").SelectnoErrorFound 1ErrHandler:If noErrorFound 0 ThenApplication.ScreenUpdating TrueMsgBox ("Stock " stockSymbol " cannot be found.")End If'Resume NextEnd SubSub Download()Call GetStock("BAC", "02/01/2017", "09/05/2017")End SubPg 2-5Creating an Automated Stock Trading SystemVersion 1.1
Click on Save and then File- Close to return to Microsoft Excel. In Excel, try out the downloading ofdata by going toExcel 2003: Go to Tools- Macro- Macros , select the Download macro and click runExcel 2007-2016: Go to Developer- Macros, select the Download macro and click run.and press the Enter key. This will initiate a download of Stock Prices from Yahoo! Finance.In the whole block of code above, the most important part is the following.DownloadURL oad/" & stockSymbol &"?period1 " & period1 & "&period2 " & period2 & "&interval " freq "&events history&crumb " & crumbWith httpReq.Open "GET", DownloadURL, False.setRequestHeader "Cookie", cookie.send.waitForResponsedataResult .responseTextEnd WithIt basically says that we will be downloading data from nance/download/" & stockSymbol & "?period1 " & period1& "&period2 " & period2 & "&interval 1d&events history&crumb " & crumb stockSymbol is the variable containing a stock symbol such as “BAC”.period1 and period2 specifies the start date and end date to download data.The “cookie” and “crumb” (extracted from response) required is extracted with the followingVBA codes.DownloadURL "https://finance.yahoo.com/lookup?s " & stockSymbolWith httpReq.Open "GET", DownloadURL, False.setRequestHeader "Content-Type", "application/x-www-form-urlencoded; charset UTF-8".send.waitForResponseresponse .responseTextcookie Split(.getResponseHeader("Set-Cookie"), ";")(0)End WithSave this workbook as we will be using it for our next section.Pg 2-6Creating an Automated Stock Trading SystemVersion 1.1
3.Moving Average TrendsMany successful investors and traders make use of trends to profit from the market, and MovingAverage is one of the most important methods for identifying market trends. The stock prices forsuccessive periods are used for the calculation of a moving average. Moving average reduces theeffects of short term volatility and allows the investors or traders to see the underlying trends of amarket.The aim of this section is to allow you to calculate simple moving average using Excel and make useof Moving Average Crossover to determine buy / sell signal and resistance level in a stock. After that,the simple moving average will be expanded with Welles Wilder method of moving average,Directional Movement and Average Directional Movement Indicators. Welles Wilder is the foundingfather who had introduced many of the modern trend concepts in his book New Concepts in TechnicalTrading System.3.1Simple Moving AverageA moving average reduces the effect short term price volatility. For example, a 10 day simple movingaverage of the closing price is calculated by averaging the closing price of the last 10 days.Simple Moving Average Sum(Closing Price of Last 10 Days)/10Applying this simple concept, let's go to our Excel file to calculate the following 3.1.110 Day Moving Average14 Day Moving Average20 Day Moving Average30 Day Moving Average10 Days Moving AverageOpen the AutomatedDownloadData.xls in Excel. Save it as a new workbook call itMovingAverage.xls. Run the Download macro if the data has not yet been downloaded. Remember tosort the data based on Date from Oldest to Newest (or in Ascending order for Excel 2003).Next, we are going to calculate a 10 Day Moving Average. Follow the steps below:1.Click on the Cell H11.2.Type in “ ROUND(AVERAGE(E2:E11),2)”. This will calculate the average (of ten values ofthe closing price) from row 2 to row 11 of column E and round them to 2 decimal places.3.Drag this cell downwards to the end of the Stock Prices. For Excel 2003, copy this cell (weare actually copying the formula of this cell) drag a range downwards to the last value of theStock Prices, and paste it.4. Go to Cell H1, and type in “10 Day SMA”Pg 3-7Creating an Automated Stock Trading SystemVersion 1.1
3.1.214 Days Moving AverageNext, we are going to calculate the 14 Day Moving Average. Follow the steps below:1.Click on the Cell I15.2.Type in “ ROUND(AVERAGE(E2:E15),2)”. This will calculate the average (of fourteenvalues of the closing price) from row 2 to row 15 of column E and round them to 2 decimalplaces.3.Drag this cell downwards to the end of the Stock Prices. For Excel 2003, copy this cell (weare actually copying the formula of this cell), drag a range downwards to the last value of theStock Prices, and paste it.4. Go to Cell I1, and type in “14 Day SMA”3.1.320/30 Days Moving AverageRepeat the above steps for column J and column K for the 20 days/30 days moving average.3.1.4Charting the Moving AverageSelect the 10 Days SMA column andExcel 2003: Go to Insert- Chart, and select Line as the Standard Types, and click the Next buttonrepeatedly until the dialog closes.Excel 2007-2016: Go to Insert- Line. Choose the first line graph. You will be getting a graph likebelow.You will be able to change the X-Axis to date. We will leave that as an Exercise for you.Repeat the above steps for the 14 / 20 / 30 Days SMA. Alternatively, you may create a chart todisplay the moving average together with the actual closing price, in a single graph in order tocompare them. At this point, you will be able to apply the concepts of the Moving Average trendsmentioned in the various Financial Technical Indicators papers.Pg 3-8Creating an Automated Stock Trading SystemVersion 1.1
3.2Using the Moving AverageCompare a 10 day versus a 20-day moving average. One uses 10 values to compute the averagewhile the other uses 20 values.A 20-day moving average gives you less fluctuation and sees the underlying trend more clearly.However, it does not mean that the 20-day average is better. Imagine that you are going to calculatethe moving average for a new day, the 20-day moving average includes more values in its averaging,and thus, might be slower to respond to changes compared to the 10 day one. So if a trend isreversing, you will be able to see it faster in the 10 day moving average. However, sometimes, thereverse trends in the 10 days moving average might be a false signal.If you overlap the different moving averages in a single graph, notice 3.3A support level usually occurs when two moving averages cross / intersects each other.When the shorter (faster changing) moving average crosses above the longer (slowerchanging) one, it usually means a rising trend of the prices.When the shorter (faster changing) moving average crosses below the longer (slowerchanging) one, it usually means a declining trend of the prices.Moving average is actually a mean of the price, thus when the actual price deviates too farfrom its moving average, it will typically start moving back (tends) towards the movingaverage.Wilders Moving AverageA new trading day simple moving average is calculated by dropping off the earliest trading day's price.This can cause a problem if the recent price data shows little changes. This is not acceptable to sometraders or analysts. On the other hand, it is also often argued that the recent prices are often the mostimportant in identifying trends.Wilders devised a simple mechanism to overcome the above problem. This is done by taking intoaccount previous days moving average and also placing more weight on the recent prices.Launch Excel and load the MovingAverage.xls workbook. Remove the charts and save the workbookas Wilders.xls.Wilder's Current Day Moving Average (Previous Day Wilder's Moving Average * (n-1) Current Day Price)/nWe are going to calculate a 14 Days Wilder’s Moving Average.1.Copy the value from Cell I15 to the Cell L15. We are initializing the first Wilder’s MovingAverage with the value of a Simple Moving Average.2.Click on Cell L16. Type in “ ROUND((L15*13 E15)/14,2)”.3.Drag Cell L16 downwards to the end of the Stock Prices. For Excel 2003, copy this cell (weare actually copying the formula of this cell), drag a range downwards to the last value of theStock Prices, and paste it.4. Go to Cell L1, type in “Wilder’s MA”Pg 3-9Creating an Automated Stock Trading SystemVersion 1.1
3.4True RangeIf in a new trading day, a stock starts it's trading at a higher or lower price than the previous day'sclosing price, then a gap is said to have occurred. Welles Wilder feels that this gap needs to be takeninto account when measuring fluctuations.The True Range of a stock price (as defined by Wilder) will need to take into account the gaps. Hethus suggests True Range to be calculated as the Greatest number among the following values: Difference between the current High and the current LowAbsolute difference between the current High with the previous Closedifference between the current Low with the previous CloseAbsoluteOpen the Wilders.xls file, launch the Visual Basic Editor, and key in the following into Module1.Function TrueRange(ByVal high As Double, ByVal low As Double, ByVal previousclose As Double)As DoubleDim returnValue As Double diffHighLow1 Math.Abs(high - low) diffHighLow2 Math.Abs(high - previousclose) diffHighLow3 Math.Abs(previousclose - low)If (diffHighLow1 diffHighLow2) ThenreturnValue diffHighLow1 ElsereturnValue diffHighLow2End IfIf (diffHighLow3 returnValue) ThenreturnValue diffHighLow3End IfTrueRange returnValueEnd Function1.2.3.4.Click on the Cell M3.Key in “ TrueRange(C3,D3,E2)”.Drag this cell downwards to the end of the Stock Prices.Click on Cell M1 and type in “Wilder’s True Range”If you chart the Wilder’s Moving Average and Wilder’s True Range, the following is what you will begetting.Pg 3-10Creating an Automated Stock Trading SystemVersion 1.1
3.5Average True RangeThe Average True Range is calculated as the average of the True Ranges using Wilder's method ofmoving average. The Average True Range is not used to predict prices but for determining the dailyactivity level of a stock. Low Average True Range indicates a stock is trading within narrow rangeswithout much swing while High Average True Range indicates period with sharp swings of prices.1. Click on the Cell N3.2. Key in “ TrueRange(C3,D3,E2)”. We initialize the first True Range to be our first AverageTrue Range. Some technical analysts will initialize the first value with a 14 Day SimpleMoving Average of the True Range.3. Click on the Cell N4. 4. Type in “ ROUND((N3*13 M4)/14,2)”.5. Drag this cell downwards to the end of the Stock Prices.6. Click on Cell N1 and type in “Wilder’s Average True Range”You can proceed to chart out the Average True Range versus the True Range.Pg 3-11Creating an Automated Stock Trading SystemVersion 1.1
3.6Directional MovementWilder compares the stock trading range of the current day and previous day, and use them tomeasure trend. If the current High is higher then the previous day High then a Positive DirectionalMovement is said to have occurred. If the current Low is lower then the previous day Low then aNegative Directional Movement is said to have occurred. If both Positive and Negative DirectionalMovement occurred, then the bigger of the two is taken. During days when the trading range is withinthe previous day range, it is considered to have no Directional Movement.Using the Wilders.xls file, launch the Visual Basic Editor. Key in the following into Module1. PDMstands for Positive Directional Movement while NDM stands for Negative Directional Movement.Function PDM(ByVal high As Double, ByVal low As Double, ByVal previousHigh As Double, ByValpreviousLow As Double) As DoubleDim highdifference As DoubleDim lowdifference As Doublehighdifference 0lowdifference 0If (high previousHigh) ThenEnd IfIf (low previousLow) ThenEnd Ifhighdifference high - previousHighlowdifference previousLow - lowIf (highdifference lowdifference) ThenPDM highdifferenceElsePDM 0End IfEnd FunctionPg 3-12Creating an Automated Stock Trading SystemVersion 1.1
Function NDM(ByVal high As Double, ByVal low As Double, ByVal previousHigh As Double, ByValpreviousLow As Double) As DoubleDim highdifference As DoubleDim lowdifference As Doublehighdifference 0lowdifference 0If (high previousHigh) ThenEnd IfIf (low previousLow) ThenEnd Ifhighdifference high - previousHighlowdifference previousLow - lowIf (lowdifference highdifference) ThenNDM lowdifferenceElseNDM 0End IfEnd FunctionClick on Save and then File- Close and Return to Microsoft Excel.1. Click on the Cell O3.2. Key in “ PDM(C3,D3,C2,D2)”.3. Drag this cell downwards to the end of the Stock Prices. This will give us the PositiveDirectional Movement. For Excel 2003, copy this cell (we are actually copying the formula ofthis cell), drag a range downwards to the last value of the Stock Prices, and paste it.4.5.6.7.Click on Cell O1 and type in “Wilder’s PDM”Click on the Cell P3.Key in “ NDM(C3,D3,C2,D2)”.Drag this cell downwards to the end of the Stock Prices. This will give us the PositiveDirectional Movement. For Excel 2003, copy this cell (we are actually copying the formula ofthis cell), drag a range downwards to the last value of the Stock Prices, and paste it.8. Click on Cell P1 and type in “Wilder’s NDM”Pg 3-13Creating an Automated Stock Trading SystemVersion 1.1
3.7Directional Movement IndicatorPositive Directional Movement Indicator is the ratio of the Average Positive Directional Movement tothe Average True Range. Negative Directional Movement Indicator is the ratio of the AverageNegative Directional Movement to the Average True Range. Thus whichever Directional MovementIndicator is larger; it will mean that the trend of the price is in the direction.First we must calculate the Wilder’s Average for both the PDM and NDM.1. Copy the value in the Cell O3 to Cell Q3. This is the first value we used for initializing theWilder’s Average. Some technical analysts will initialize the first value with a 14 DaySimple Moving Average of the PDM.2. Select Cell Q4. Key in “ ROUND((Q3*13 O4)/14,2)”.3. Drag this cell downwards to the end of the Stock Prices. This will give us the Wilder’sAveragePositive Directional Movement. For Excel 2003, copy this cell (we are actually copying theformula of this cell), drag a range downwards to the last value of the Stock Prices, and pasteit.4. Click on Cell Q1 and type in “Wilder’s Average PDM”If you chart the Wilder’s PDM with Wilder’s Average PDM, the following is what you will get.1. Copy the value in the Cell P3 to Cell R3. This is the first value we used for initializing theWilder’s Average. Some technical analysts will initialize the first value with a 14 DaySimple Moving Average of the NDM.2. Select Cell R4. Key in “ ROUND((R3*13 P4)/14,2)”.3. Drag this cell downwards to the end of the Stock Prices. This will give us the Wilder’sAverage Positive Directional Movement. For Excel 2003, copy this cell (we are actuallycopying the formula of this cell), drag a range downwards to the last value of the StockPrices, and paste it.4. Click on Cell R1 and type in “Wilder’s Average NDM”Pg 3-14Creating an Automated Stock Trading SystemVersion 1.1
If you chart the Wilder’s NDM with Wilder’s Average NDM, the following is what you will get.3.7.1Positive/Negative Directional Movement Indicator1. Click on the Cell S3.2. Key in “ ROUND((Q3/N3)*100,2)”.3. Drag this cell downwards to the end of the Stock Prices. This will give us the PositiveDirectional Movement Indicator. For Excel 2003, copy this cell (we are actually copying theformula of this cell), drag a range downwards to the last value of the Stock Prices, and pasteit.4.5.6.7.Click on Cell S1 and type in “Positive DMI”Click on the Cell T3.Key in “ ROUND((R3/N3)*100,2)”.Drag this cell downwards to the end of the Stock Prices. This will give us the NegativeDirectional Movement Indicator. For Excel 2003, copy this cell (we are actually copying theformula of this cell), drag a range downwards to the last value of the Stock Prices, and pasteit.8. Click on Cell T1 and type in “Negative DMI”Chart out the Positive DMI, Negative DMI and the Closing Price. Use it to analyze trends observedand published by the different Technical Traders or by Wilder himself. Or refer to Section 3.9 for ananalysis of the trends.Pg 3-15Creating an Automated Stock Trading SystemVersion 1.1
3.8Average Directional Movement IndexDirectional Index (DX) is calculated as the ratio of the absolute difference between the values of thetwo Directional Movement Indicators to the sum of the two Directional Movement Indicators. Thisallows us to measure the strength of a trend. The DX will be a larger value when the price is movingtowards one direction. The Average DX can be calculated using Wilder's Moving Average. This allowsthe fluctuations in the Directional Index to be reduced.1. Click on the Cell U3.2. Key in “ ROUND((ABS(S3-T3)/(S3 T3))*100,2)”.3. Drag this cell downwards to the end of the Stock Prices. This will give us the DirectionalMovement Index. For Excel 2003, copy this cell (we are actually copying the formula of thiscell), drag a range downwards to the last value of the Stock Prices, and paste it.4. Click on Cell U1 and type in “DX”5. Copy the value on Cell U3 to the Cell V3. This value is used to initialize our Wilder’s Average.Some technical analysts will initialize the first value with a 14 Day Simple MovingAverage of the Directional Movement Index.6. Click on Cell V4 and key in “ ROUND((V3*13 U4)/14,2)”. This will give us the Wilder’sAverage of DX. For Excel 2003 (or Excel 2007-2016), copy this cell (we are actually copyingthe formula of this cell), drag a range downwards to the last value of the Stock Prices, andpaste it.7. Drag this cell downwards to the end of the Stock Prices. This will give us the AverageDirectional Movement Index.8. Click on Cell V1 and type in “ADX”Pg 3-16Creating an Automated Stock Trading SystemVersion 1.1
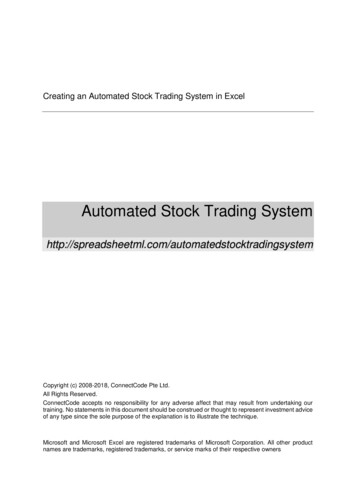
3.9Using the IndicatorsWe now have three very useful indicators, the Positive DMI, Negative DMI and Average DirectionalIndex (ADX). If the Positive Directional Movement Indicator crossover above the NegativeDirectional Movement Indicator, it meant that the price is on the upward trend, whereas when thePositive Directional Movement Indicator crossover below the Negative Directional MovementIndicator, it meant the price is on the downward trend. The Average Directional Index is used toindicate how strongly the price is moving towards one direction. So, if the chart shows AverageDirectional Index increasing, it means the price is increasing in trend in a particular direction indicatedby the Positive Directional Movement Indicator or Negative Directional Movement Indicator (whicheveris larger).Pg 3-17Creating an Automated Stock Trading SystemVersion 1.1
4.What Next?We hope you have enjoyed the training so far and have gained a better understanding of severaluseful Technical Indicators. These Technical Indicators are definitely useful in the creation of anAutomated Stock Trading System. Please also be assured that we are in the process of adding newmaterials to our website at http://www.spreadsheetml.com.If you have any comments or suggestions to help improve this document, please contact us atinfo@spreadsheetml.com.Pg 4-1Creating an Automated Trading SystemVersion 1.1
Automated Stock Trading System using Microsoft Excel. We assume that you have some basic knowledge of Excel and is interested in putting into practice the financial concepts of a technical stock trading system. We will start from downloading Stock data and move in