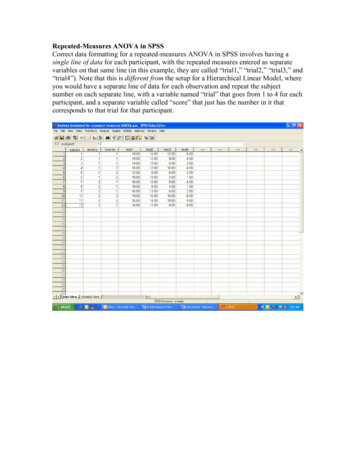
Transcription
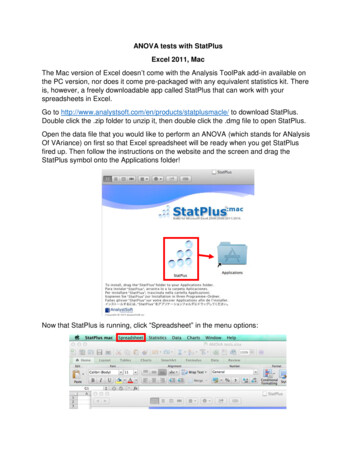
ANOVA tests with StatPlusExcel 2011, MacThe Mac version of Excel doesn’t come with the Analysis ToolPak add-in available onthe PC version, nor does it come pre-packaged with any equivalent statistics kit. Thereis, however, a freely downloadable app called StatPlus that can work with yourspreadsheets in Excel.Go to le/ to download StatPlus.Double click the .zip folder to unzip it, then double click the .dmg file to open StatPlus.Open the data file that you would like to perform an ANOVA (which stands for ANalysisOf VAriance) on first so that Excel spreadsheet will be ready when you get StatPlusfired up. Then follow the instructions on the website and the screen and drag theStatPlus symbol onto the Applications folder!Now that StatPlus is running, click “Spreadsheet” in the menu options:
From the “Spreadsheet” menu, select Microsoft Excel 2011 to let StatPlus know this isthe program that contains the data you’d like to statistically test.Before we begin our analysis, make sure your data is logically arranged in yourspreadsheet. In the example below, each row of data represents the responsesmeasured from four different treatments: A, B, C, and D. While this is perfectly logical,this is not the data format StatPlus ANOVAs prefer!Instead, arrange your data so that each treatment is a separate column like theexample below.
To perform an ANOVA test, you need to click the “Statistics” menu. ANOVA is an optionlisted, and specifically we are performing a “One-way ANOVA” because we are onlytesting one experimentally manipulated variable.After clicking “One-way ANOVA,” a dialogue box will pop up that will allow you to selectwhat data you are going to perform an ANOVA on. Click the button to the right of thebox showing “Select numeric variables. [Required]” and then drag and select your data.
Drag and select columnsNow the correct data range should be showing in the Variables box.
Once you click “OK,” your ANOVA results will appear in a new Excel spreadsheet!Because the labels were highlighted in addition to the data when you selected yourVariables for the test, the labels appear under “Groups” in the ANOVA summary. If youdo not select labels, they will simply be called 1, 2, 3, 4, etc. The most importantnumbers to take away from these results are the F statistic and the p-level (or p-value).These values tell you whether there is a significant difference between any of thetreatment groups (but not which group is different).Go forth and test your data! And email me if you have any lingering questions!
ANOVA tests with StatPlus Excel 2011, Mac The Mac version of Excel doesn’t come with the Analysis ToolPak add-in available on the PC version, nor does it come pre-packaged with any equivalent statistics kit. There is, however, a freely downloadable app calle