Transcription
NIRVANA SYSTEMS’ TECHNICAL ANALYSIS TRAINING SERIESProfitingwith Indicatorsby Jeff Drakewith Ed Downs
Profitingwith Indicatorsby Jeff Drakewith Ed Downs
Profiting with Indicatorsby Jeff Drakewith Ed DownsThe charts and indicators used in this book were captured from OmniTrader. You canlearn more about OmniTrader by visiting www.omnitrader.com.Sales Information: For more information about OmniTrader, please contact ourSales Department by phone at (800) 880-0338 or (512) 345-2566 or by email atsales@omnitrader.com.All Rights ReservedCopyright 2003Nirvana Systems, Inc.7000 N. MoPac, Suite 425Austin, Texas 78731Phone 800.880.0338www.omnitrader.com
TABLE OF CONTENTSCHAPTER 1Introduction to Indicators . 7What is an Indicator? .8Leading vs. Lagging Indicators .8Indicator Classes .9CHAPTER 2Trending Indicators .11Moving Averages .12Simple Moving Averages (SMA) . 12Exponential Moving Averages (EMA) .13Weighted Moving Average .13Applying a Moving Average .14Using Two Moving Averages . 15Moving Average Oscillators .16Moving Average Convergence/Divergence .16The MACD Histogram .18The TRIX Indicator .19Trend Indicator Summary .20CHAPTER 3Volatility Indicators .21Chaikin Volatility .21Average True Range (ATR) .23
CHAPTER 4Momentum Indicators .25Oscillators .25Divergence .26The Momentum Indicator .27The Stochastics Oscillator .28Rate of Change (ROC) . 29The Relative Strength Index (RSI) .30More Momentum lndicators .31Additional Momentum Analysis .31Momentum Indicator Trendlines .31Applying Price Patterns to Momentum .32Momentum Indicator Summary .33CHAPTER 5Volume Indicators .35On Balance Volume (OBV) .36Accumulation Distribution .37Money Flow .37Volume Indicator Summary .38CHAPTER 6Which Indicators Should I Use? .39What Type of Trader are you? .39CHAPTER 7Applying Different Classes of Indicators .43Summary .48CHAPTER 8Tips on Profiting with Indicators .49Conclusion .51Appendix A- Disclaimer .53
Chapter1Introduction to IndicatorsTrading is a game of odds. Nothing is certain when it comes to the financialmarkets, and the only way in which we can consistently win in this game is totake action when the odds are in our favor.When looking at a listof candidates to trade oranalyzing a potential tradingopportunity on a particularchart, we can improve our oddsof winning by only taking thetrades with the “least technicalrisk”. Let’s face it—it can bea daunting task when lookingat a list of trade candidatesand deciding which onespresent the best opportunityfor success. Yet by applyingconfirmation techniques suchas chart patterns and indicatorswe can arrive at a select fewcandidates that present theleast technical risk. By tradingthese candidates only at the 7
proper time, we are increasing the likelihood of a profitable trade. Of course, the key toisolating these opportunities is to know which confirming tools to use when makingtrading decisions.Profiting with Indicators is designed to help you find the opportunities with the bestgain potential and least technical risk by properly applying indicators. While there aremany books and other materials available that tell you how to construct an indicator, thepurpose of Profiting with Indicators is to explain the practical application of usingindicators in your trading. Our focus is not on how to calculate an indicator (mosttrading software will already do this for you), but on how to make money by usingindicators to confirm trade candidates.However, before we begin discussing individual indicators, it’s important that we defineexactly what an indicator is.What is an Indicator?An indicator is a mathematical calculation, using price and/or volume data, whichis designed to “indicate” when a condition exists or when a condition has beenmet. Indicators can be plotted on the price chart or below the price chart. Forexample, moving averages are normally plotted on the price chart itself, whileoscillators are normally plotted below the chart. We’ll discuss this in more detailwhen we cover individual indicators.When using indicators for confirmation, it is important to understand what conditionthe indicator is looking for before applying it to your trading. While one indicator maybe looking to identify trend direction, another may be looking to identify the speed atwhich price is changing. However, regardless of the type of indicator, they are all tryingto do one thing—that is to help us determine future price direction.An Indicator is.A mathematical calculation that “indicates” when a conditionhas been met or exists.Leading vs. Lagging IndicatorsMost indicators can be classified into two different categories—lagging indicators andleading indicators. A lagging indicator is best used to identify trend direction. They gettheir name from the fact that they trail, or lag behind, price direction. Lagging indicators8
will miss sharp reversals, but many feel that the slightly minimized reward of a laggingindicator is offset by the minimized risk.A leading indicator, sometimes referred to as a predictive indicator, attempts to predicttrend reversal. Most leading indicators try to identify “overbought” or “oversold”levels, operating on the assumption that securities that are overbought will then fall inprice, while oversold securities will see price advance. Due to the predictive nature ofthese indicators, they tend to give false readings more often than lagging indicators.However, they are good at bringing our attention to the potential of a direction reversal.As a general rule of thumb, lagging indicators work best in markets that trend for longperiods, while leading indicators are more effective in trading range, or sideways,markets.Indicator ClassesThere are four main classes of indicators: trending indicators, momentum indicators,volume indicators, and volatility indicators. Each class of indicator is looking to identifydifferent conditions when they are applied. For example, a trend indicator is simplyattempting to identify the current trend direction, and a volume indicator attempts toidentify when abnormal volume is accompanying a price move. The table below givesus a working definition of each major indicator class.Indicator ClassAttempts to IdentifyTrending IndicatorsDirection of current trendand reversalsMomentum IndicatorsOverbought and Oversold levelsVolume IndicatorsAbnormal volumeVolatility IndicatorsAbnormal volatilityWhile these definitions give us an idea of how these classes of indicators are meant to beused, most indicators have multiple methods in which you can apply them to yourcharts. A popular application of the momentum class of indicators is to look fordivergence between the indicator and the price chart. Another method that can beapplied to momentum indicators is the classic overbought and oversold level method. 9
While each method attempts to identify the potential for a reversal, you might chooseone method over the other depending on the length of trade you are looking for. Wewill discuss the different methods of applying each class of indicator when we discussthat particular class.To begin our discussion of each indicator class, let’s start with the most commonlyused indicator—the trending indicator.10
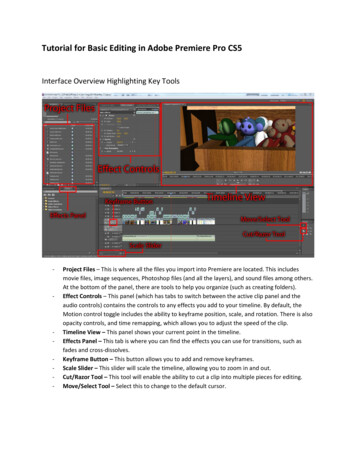
Chapter2Trending IndicatorsTrend Indicators attempt to identify the direction of trend and alert us to the potentialchange in trend. In order to do so, they attempt to eliminate the ‘noise’ that is inherentin bar and candle charts, and provide a visual representation of the trend that is moreeasily identifiable. The majority of trend indicators make use of moving averages almostexclusively, and due to this characteristic they are lagging indicators. In fact, another termused for trend indicators is trend following indicators.Some of the most commonlyused Trend Indicatorsinclude Typical Price,Median Price, VerticalHorizontal Filter, MACD,Trend Intensity Indexand Average DirectionalMovement. Yet far andaway the most commonlyused trend indicator is themoving average. Since this isthe case, let’s take a look atmoving averages in general,and then discuss some of themost popular types of movingaverages and their application.A Simple Moving Average applied to the chart of Pfizer. 11
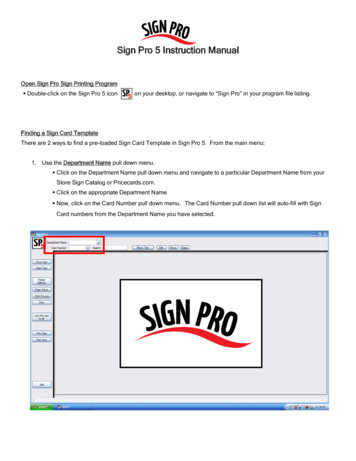
Moving AveragesMoving averages attempt to give us an objective measure of trend direction bysmoothing the price data. This is usually done by using the close price of data bars, buthigh and low price are used at certain times as well. The shorter the time period of themoving average, the more reactive it will be to the latest price change. This is to say thata 20-period moving average will follow the nuances of the price chart more closely thana 50-period moving average. This can be beneficial in identifying trend reversals morequickly, but it also leads to more false readings.While moving averages can be constructed using any number of periods, some of themost popular periods are 200-periods for long term trend indication, 45-65 periods formedium term and 20-periods for short term.The three most common types of moving averages are the Simple Moving Average, theExponential Moving Average, and the Weighted Moving Average. Let’s take a look ateach type.Simple Moving Averages (SMA)The Simple Moving Average is constructed by taking the sum of the values of the latestn periods and then dividing by n. For example, a 21-period Simple Moving Averagewould take the sum of the close price for the last 21-periods and divide by 21. Since theSimple Moving Average applies equal weight to each one of the values in thecalculation, it is the slowest of the three types of moving averages which we discuss.However, this does not nullify its value. Simple Moving Averages give us a good,conservative indication of trend direction.This chart for COH shows a21-period Simple MovingAverage following price in adownward and upwardtrend.12
Exponential Moving Averages (EMA)Exponential Moving Averages are constructed similarly to Simple MovingAverages, yet more weight is applied to the latest price. This is done by applying apercentage of the latest period’s closing price to the previous period’s moving averagevalue. Since Exponential Moving Averages apply more weight to the latest values, theywill turn more quickly than a SimpleMoving Average and follow pricemore closely.Here again we see the chart for COH,but this time it is displayed witha 21-period Exponential MovingAverage and the Simple MovingAverage. While it looks very similar,notice how the Exponential MovingAverage “hugs” price just a bit closerthan the Simple Moving Average.Weighted MovingAverage (WMA)A Weighted Moving Average is designed to put more weight on the latest dataand less weight on the past data, similar to the Exponential Moving Average. WeightedMoving Averages assign the most weight to the most recent data period, the second mostweight to the previous dataperiod, the third most weight tothe data period before that, andso on. Of the moving averagesthat we have discussed, theWeighted Moving Averagewill “track” a security moreclosely than the Simple MovingAverage and the ExponentialMoving Average. Due to theweighting of this type of movingaverage, some see it as a truerrepresentation of the currenttrend. Yet it tracks a security in a 13
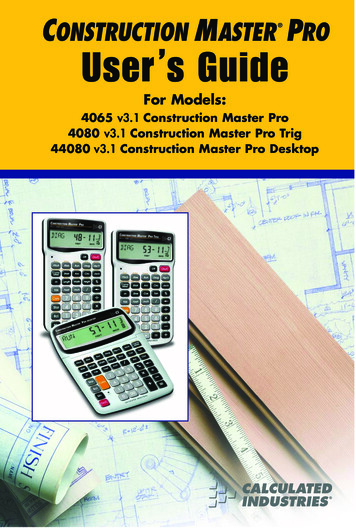
manner that is similar to the EMA as shown in this example.Applying a Moving AverageThe simplest application of moving averages to your trading would be to look for priceto penetrate the moving average. In the chart below, we see four examples of the pricepenetrating a 40 period SMA. In example A, we see where price penetrated the movingaverage twice. Price penetrated the moving average to the downside and then turnedaround and penetrated price to the upside on the next bar. This is known as a“whipsaw” and it is common with moving averages. We will discuss whipsaws in moredetail later. Example B shows price penetrating the moving average to the downsideand a strong downward trend follows. And finally, in example C we see pricepenetrating the moving average to the upside, indicating the beginning of a strongupward trend.The application of a moving average can be used for entries and/or exits. In thisexample, let’s say that we go long when price penetrates the moving average to theupside, and exit when price penetrates the moving average to the downside. We couldalso go short when there is a downside penetration and cover the short position on anupside penetration. This would have resulted in four trades, with three of them beingprofitable. However, this scenario only works effectively when a security trends well.14
During periods of consolidation, a moving average will give you multiple false signals.This is why the moving average should only be applied as a trend confirmation tool,and not as a systematic approach to trading.Using Two Moving AveragesAnother popular application of moving averages is to use multiple moving averages.Since moving averages are lagging indicators, the application of two moving averageswill result in later signals, but it will help reduce whipsaws. Let’s look at an example ofusing two moving averages. We have applied a 15-period Simple Moving Average and a40-period Simple Moving Average to the same chart as before. If we are to take aposition in the direction of the faster moving average (15-period) when it penetrates theslower moving average (40-period), we have only two positions; one short and one long.The whipsaw from the previous example is eliminated due to the lagging nature of amoving average.The use of two moving averages is common in trading. Moving averages smooth price,and by using two moving averages we can better eliminate the inherent noise associatedwith price charts and help reduce the negative effects of whipsaws. Yet regardless ofthe number of moving averages used, they will still fail in sideways markets.A 15-period Simple Moving Average and a 40- period Simple Moving Average plotted onthe chart for Pfizer. Using two moving averages helps to eliminate whipsaws. 15
Moving Average OscillatorsThe moving averages that we have covered to this point are applied directly to the pricechart. Yet moving averages can also be presented as an oscillator. An oscillatingindicator will fluctuate between two extreme levels, with the upper extreme beingconsidered an overbought level and the lower extreme being an oversold level.Overbought LevelOversold LevelThere are various interpretations of oscillators, and the majority of them are covered inthe momentum indicators section. In our discussion of trend indicators, we will look atapplications of moving average oscillators that are exclusive to these indicators, and alsolook at how they can help us identify trend strength and potential reversal points.Moving Average Convergence/DivergenceThe Moving Average Convergence/Divergence (MACD) indicator uses twoexponential moving averages, with the “classic” parameters being a 12-period EMA anda 26-period EMA. The difference of these moving averages is presented as anoscillator, and then a 9-period moving average of the difference is then applied. This isknown as the signal line due to the fact that a buy signal is generated when MACDcrosses the signal line to the upside, and a sell (or short) signal is generated when itcrosses the signal line to the downside. It’s important to note at this time that this typeof application of the MACD results in whipsaws in a sideways market, just as the othermoving average indicators we have looked at.The MACD Indicator. The faster line represents the MACD Line,while the slower line is the trigger line.16
The MACD is a responsive indicator, in that it reacts to recent price informationquickly. This makes it prone to whipsaws. Yet the MACD indicator is useful in otherways.On the chart for Hershey Co., we have marked three different ways in which you can useMACD. Example A shows divergence of the MACD from the trigger line. This ishelpful in indicating a strong upward move. While some may see the MACD crossingthe trigger line as a good long signal in this example, the next example shows why this isan unreliable method of applying MACD. In Example B we see a period of tightconsolidation, and that there are multiple false signals that would occur if we were to usethe signal line crossover method. Yet another useful characteristic of the indicator is tolook for the MACD to go horizontal at the zero line. This tells us that the security is ina period of consolidation, and it is not a good time to take a trade in either direction.The MACD indicator has additional interpretations as well, yet they fall more along thelines of momentum indicator methods so they are discussed in the momentum indicatorchapter. 17
The MACD HistogramThe MACD Histogram displays the difference between the MACD line and the signalline as a histogram. This makes the visual interpretation of the MACD much easierthan the regular MACD indicator. If the histogram is above the zero line, it signifies anupward trend, and of course if the histogram is below the zero line, then it signifies adownward trend. The MACD Histogram is an effective tool when confirming shortterm trading opportunities.In the chart above we have marked six points where the histogram crossed the zeroline. Point A Shows a move up through the zero line, but the true upward trend didn’ttake place until the histogram had fallen back slightly and then moved through the zeroline at Point B. Since the MACD Histogram is based on the same information as theMACD, it is also highly reactive to price and possesses all of the MACD’s strengths andweaknesses. Points C and D shows another example of a move through the zero line,but due to the consolidating market, these points resulted in false signals. This is a goodexample of the fact that although the MACD Histogram is displayed differently thana moving average, it is still based on moving averages and it is prone to the same falsesignals during periods of consolidation. At Point E, the stock begins a clearly bullishtrend. Point F shows a break of the zero line to the downside as the stock begins adownward trend.18
Some traders also look for peaks in the MACD Histogram for short-term confirmation,and others will consider the slope of the histogram as a trend indicator (i.e. slopingupward means a short term upward trend). Studying the MACD Histogram will helpyou determine which application best suits your style of trading.The TRIX IndicatorThe TRIX Indicator uses a triple smoothed moving average (a moving average of amoving average of a moving average), and it is less prone to whipsaws than many othertrend indicators. Presented as an oscillator, the application of the TRIX indicator ispretty straightforward. When the TRIX indicator is above the zero line, it means thatthe security is trending upwards. Conversely, when it is below the zero line it meansthat the security is trending downward.The chart of ADSK shows how effective this indicator can be in confirming entries.Points A, B and C show that a profitable trend occurred once the indicator crossed the 19
zero line. Yet before we rush out and apply the TRIX indicator to all of our charts, it’simportant to know that the nature of the triple smoothing can often result in late signalsand missed opportunities. Point D on the CL chart shows that the indicator crossedthe zero line after a short term trend had already completed for the most part. Thisillustrates why using this indicator in this manner is more conducive to long termtrading than short term trading.Trend Indicator SummaryWe have just looked at the most popular trend indicators. Of course, there are manymore trend indicators, all of which attempt to tell us the same information. Trendindicators are best used to help us identify the current trend and potential reversalpoints. Almost all trend indicators make use of a moving average, and this causes themto be classified as lagging indicators. The most important point to remember abouttrend indicators is that their value is severely limited in a sideways market. Regardlessof which type of trend indicator you choose to apply to your trading, it will only helpyou confirm entries in a trending market. If the market starts to move sideways, or in atrading range, you would be best suited using a different class of indicator forconfirmation. Even so, we know that in trading the money is in the trend, and mosttraders will always apply a trend indicator to their charts to help them identify thestrength of the current trend as well as trend reversals.20
Chapter3Volatility IndicatorsThe second class of indicators that we will cover is the Volatility Indicators. Theseindicators are meant to measure the typical behavior of a security’s movement, and alertus to the points when its behavior is abnormal. This can be in the form of eithercontraction or expansion, and it assists us in determining market tops and bottoms aswell as potential breakout moves.Volatility is one of the most overlooked measurable characteristics of technical analysis.While it would be difficult to construct a successful trading system using a volatilityindicator exclusively, adding a volatility indicator to your analysis arsenal will help youisolate situations where a reversal or continuation is more likely. We’ll discuss theapplication of volatility indicators later, but first we want to take a look at a couple of themost popular volatility indicators which are available in most technical analysisprograms: Chaikin Volatility and Average True Range.Chaikin VolatilityThe first volatility indicator that we will look at is Chaikin Volatility. This indicatormeasures volatility by looking at the difference in the Exponential Moving Averages ofthe high and lows of the last 10 bars (typically) and alerts you to a sudden increase in thedaily price range. A high indicator reading can be used to confirm the likelihood of areversal or breakout. 21
This chart for Dillards shows two examples. At Point A, we see an unusually highChaikinVolatility reading that accompanies a reversal. We have marked the resistancelevel that the security was at once volatility began to expand. Situations like this alert usto a high probability of a break in one direction or the other. However, Point B showswhere a high indicator reading doesn’t result in a reversal but a breakout. This gives usa good example of the usefulness of this indicator. While it can help in determininghigher odds of a reversal or breakout, it should be applied with other indicators froma different class to increase odds of entering a profitable trade. In other words, thisindicator tells us when the conditions are good for a reversal or breakout, but additionalanalysis is required.22
Average True Range (ATR)J. Welles Wilder developed the Average True Range Indicator and first presented it inhis classic book New Concepts in Technical Trading Systems. This indicator is alsocommonly referred to as Wilders Volatility. Its construction is a bit complicated, but itsapplication is similar to the straightforward approach we discussed with ChaikinVolatility. High Average True Range, or ATR, levels indicate that the odds are in favorof a reversal or breakout. Another use of ATRs is to look for a rise in the indicator tohelp determine market participation in the current move.ln this example, we see a high ATR reading occurring as Douglas Emmett, Inc. reversesto the upside. As you apply the ATR indicator to charts, you will see that the highreadings will often occur after a market top or bottom. While some may see this asa detrimental behavior of this indicator, it will tend to give fewer false readings thanChaikin Volatility, and it proves to be a useful tool in confirming reversals. 23
24
Chapter4Momentum IndicatorsMomentum indicators attempt to measure the velocity at which price changes. Whilethere are various indicators that fall into the momentum category, including Rate ofChange, Moving Average Convergence/Divergence, Stochastics and RSI, they are allattempting to tell us when there is a change in a security’s current momentum. Theseindicators are applied to give us an early indication of trend reversal, and are thusclassified as leading, or predictive, indicators.Although there are many different kinds of momentum indicators, they are all designedto tell us when a security is ready to reverse by one of the following methods:1.2.3.4.Overbought and oversold levelsIndicator divergence from price directionIndicator trendline penetrationIndicator moving average penetrationThe most common of these methods are the overbought/oversold indication, and thedivergence method. Let’s take a moment to define these two methods.OscillatorsMomentum indicators are presented as oscillators, in that they are constructed tooscillate between two extreme levels. This concept was touched on when we discussedmoving average oscillators, but let’s expand the discussion just a bit. 25
The higher extreme is known as the overbought level, and the lower extreme is knownas the oversold level. This illustration shows how the indicator, represented by the wavyline, is oscillating between the extreme levels. Once the indicator reaches or exceeds theupper level, the security is said to be overbought. In contrast, once it reaches or exceedsthe lower level, it is said to be oversold.OverboughtOversoldOverbought and oversold are used to show when a trend reversal is likely, but they arefar from definite levels. There will be times when a momentum indicator is at anoverbought level, yet the security that it has been applied to is continuing to trendupwards. The practical application of this method is to realize that the likelihood of areversal has increased, not that a reversal is imminent.DivergenceDivergence refers to thePricecase when an indicator’s1primary direction divergesfrom price direction. For3example, if the price of2the security is rising, yetthe value of an appliedindicator is falling, theindicator is said to bediverging from price.When we look forindicator divergence, weMomentum Indicatorare in effect looking for aforecast of price direction, and this illustrates the predictive nature of using this formof analysis with momentum indicators. Divergence tells us that momentum is eitherweakening or gaining strength.26
Similar to the overbought and oversold indication, it is only signifying that the chancesof a reversal are likely, not guaranteed.The previous illustration shows three examples of divergence. By looking at the slopeof a line drawn across the peaks in Examples 1 and 3, we see that price is rising while theindicator is falling, indicating bearish divergence. Example 2 shows divergence in thevalleys of the price and indicator chart, indicating bullish divergence. We’ll look at moreexamples of divergence as we explore some of the most commonly used momentumindicators.The Momentum IndicatorThe first momentum indicator that we will look at is the aptly titled MomentumIndicator. Momentum measures the rate of change in closing price over the past nperiods. This indicator is simple, yet effective when looking for trend reversals. In thischart we see an example of both bearish and bullish divergence. Notice that when weare looking for bearish divergence, we are comparing peaks, while we look at valleys forbullish divergence.The Momentum Indicator can also be used to identify overbought and oversold levels,but due to the nature of the indicator, the levels will vary from security to security. We 27
will see a more straightforward approach to identifying overbought and oversold levelsin our discussion of the next momentum indicator, Stochastics.The Stochastics OscillatorThe Stoch
used, most indicators have multiple methods in which you can apply them to your charts. A popular application of the momentum class of indicators is to look for divergence between the indicator and the price chart. Another method that can be applied to momentum indicators