Transcription
Farm Fatalities to Youth 1995-1997: A Comparison by Age Groups.Michael Goldcamp*, Kitty J. Hendricks, John R. MyersCenters for Disease Control and Prevention,National Institute for Occupational Safety and HealthMorgantown, WV.
Abstract:Although a myriad of research illustrates the safety issues related to farm fatalities inyouth populations, very little empirical evidence exists to describe farm fatalities to non-workingyouth and youth under 16 years of age. Research such as that conducted by Myers and Adekoya(2001) and Castillo et al. (1999) utilize surveillance systems such as the National TraumaticOccupational Fatalities (NTOF) Surveillance System and the Census of Fatal OccupationalInjuries (CFOI) to provide information on occupational farm fatalities to youth. However, sinceyouth are exposed to hazards both while working and playing on the farm, these studies excludeone critical component - non-occupational fatalities.Adekoya and Pratt (2001) utilize National Center for Health Statistics (NCHS) MortalityData to address fatal farm injuries. However, the data do not allow for a delineation betweenoccupational and non-occupational events. In addition, the coding system utilized with thesedata does not allow for inclusion of transportation or intentional fatalities, and fatalitiesoccurring within the farm home were not included.To address both occupational and non-occupational deaths on farms, includingtransportation and intentional deaths, this research will utilize death certificate data collected bythe National Institute for Occupational Safety and Health (NIOSH) from all 50 state vitalstatistics mortality registries. Records satisfying the following criteria were requested:underlying, immediate, or contributing cause of death from an external factor; age of thedecedent is less than 20 years of age; and the indicated location of death is a farm. The resultsinclude information for 368 fatalities occurring in the years 1995 through 1997.In addition to providing annual fatality rates and description of the general cause ofdeath, this research will further examine the variation between age groups. In particular, adistinction will be made between youth under 16 years of age and those 16 and over.Preliminary findings show an average annual fatality rate for all farm youth of 9.76fatalities per 100,000 youth. The most prevalent causes of death are; machinery (94), drowning(59), motor vehicle (49), nature/environment (25) and suffocation (24). Of all youth fatalitiesoccurring while at work, 34.0% (16) are to youth less than 16 years of age. This same age groupaccounts for 74.4% (221) of all non-work related fatalities.This paper will provide farm families and researchers more detailed information on farmhazards that contribute to the deaths of youth. As these youth may encounter hazards whileworking or playing in their daily environment, identification and elimination of these hazardswill increase overall safety on the farm.1
Introduction:According to estimates derived from the 1998 Childhood Agricultural Injury Survey(CAIS), the farm in the United States (U.S.) is both a playground and workplace forapproximately 1.9 million youth under 20 years of age living and working on farms. Given thenature of the work done on the farm and the dual role of the farm as a home and a workplace,youth are exposed to many unique hazards while working and playing. According to Adekoyaand Pratt (2001) there were 2,174 youth under 20 years of age fatally injured on farms between1982 and 1996, or an average of approximately 155 deaths annually. Although these authorsfound that the annual number of deaths appears to be decreasing, the number of deaths remainshigh. This indicates a continued need for research to identify the dangers that youth face on adaily basis so that effective prevention strategies can be implemented.Although research exists that describes general farm injuries and fatalities to youth(Adekoya and Pratt, 2001; Myers and Adekoya, 2001; Rivara, 1985), research on youth farmrelated fatalities has primarily addressed occupational fatalities (Janicak, 2000; Castillo et al.,1999; Conroy and Sciortino, 1997). By utilizing databases, such as the National TraumaticOccupational Fatalities (NTOF) (which is death certificate-based) and the multiple sourceCensus of Fatal Occupational Injuries (CFOI) surveillance systems, research has been able toprovide insightful information on these occupational injuries.Other sources of data includestate-specific vital records-based data systems which have been used for local studies. However,since youth are exposed to hazards both while working and playing on the farm, most of thepreviously mentioned studies exclude one critical component - non-occupational fatalities.Authors such as Myers and Adekoya (2001), Janicak (2000), Castillo et al. (1999),2
Conroy and Sciortino (1997), and Richardson et al. ( 1997) have studied fatal occupational farminjuries and the impact of variation in activity and age. In general, these authors tend to come tosimilar conclusions. When studying all farm events, regardless of age, tractors were the leadingcause of death on the farm in the U.S. (Jenkins and Hard, 1992; Richardson et at., 1997). Myersand Adekoya (2001) found that, between 1982 and 1994, the three leading causes of on-farmdeaths to youth ages 16 through 19 were machinery (29.5%), drowning(23.8%), and firearms(17.5%).Half of all occupational fatalities to youth 16 to 19 years of age involved vehicles,with 23% of vehicle fatalities involving tractors (Castillo et al., 1999). Overall, risk is similaracross age groups, but risk factors may vary within age groups.Adekoya and Pratt (2001) utilized National Center for Health Statistics (NCHS)Mortality Data to address fatal farm injuries. These data do not allow for a distinction betweenoccupational and non-occupational injuries. These authors found that approximately two thirdsof all farm fatalities occurred to youth under 15 years of age (1,432 of 2,174 fatalities from1982to 1996). In addition, the leading causes of death for younger youth were machinery, drowning,and animals. This research indicates a large number of fatalities in the under 15 age group, andsome variation in the likely causes of injury. However, one limitation of this research is that thecoding system utilized does not allow for inclusion of either transportation or intentionalfatalities. In addition, fatalities which occurred within the farm home were not included.Therefore, these data are likely to under-represent the number of youth fatalities on the farm.The intent of this research is to re-examine the fatality rate of youth on U.S. farms. Inaddition to examining fatality rates by cause of death, this research will further examine thevariation between age groups. In particular, a distinction will be made between youth 16 and3
over and youth under 16 years of age, and will include both occupational and non-occupationalfatalities.Methods:This research will utilize death certificate data collected by the National Institute forOccupational Safety and Health (NIOSH) from all 50 state vital statistics mortality registries.Records satisfying the following criteria were requested: underlying, immediate, or contributingcause of death from an external factor (International Classification of Diseases. 9th Revision.E800-E999); age of the decedent is less than 20 years of age; and the indicated location of deathis a farm. The results include detailed information for 368 fatalities occurring in the years 1995through 1997. These data contain fatalities incurred by individuals not typically included inother farm fatality studies (i.e., transportation and intentional incidents).Information from death certificates were automated using double-blind entry. An eventwas considered occupational if the Ainjury at work?@ item on the death certificate was markedAyes@. NIOSH staff used the narrative information on each death certificate to code each fatalityaccording to the International Classification of Diseases 9th Revision (ICD-9)(WHO, 1977)standards. Descriptive statistics were then calculated to determine the frequency of each causeof death and the percentage of the overall number of fatalities accounted for within each cause ofdeath. The narratives were also used to determine additional information about these deaths(e.g., whether a tractor was involved in a machinery-related death). Finally, Fisher s Exact testswere utilized to determine the statistical significance of variations in age among these fatalities.In addition to death certificate data, survey data obtained from the 1998 Childhood4
Agricultural Injury Survey (CAIS 1998) were used to determine the approximate population ofindividuals under 20 years of age living or working on U.S. farms for calculating age-specificfatality rates (Myers and Hendricks, 2001). This survey, conducted for NIOSH by the NationalAgricultural Statistics Service (NASS), United States Department of Agriculture (USDA),collected data through a regionally stratified random sample of approximately 26,000 farms.Each selected farm, contacted via telephone, was asked to provide demographic information,including the number of children under 20 years of age living or working on the farm. Theresulting estimated population was used to estimate the fatality rate, indicated as an annual rateper 100,000 youths.Results:Demographics:For the years 1995 to 1997, a total of 368 fatalities for youth under 20 years of age were5
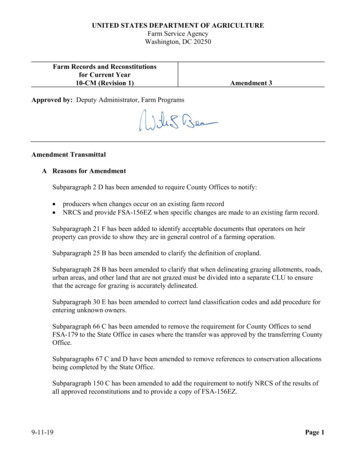
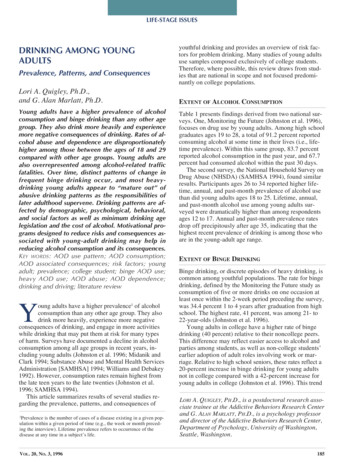
identified, however 6 of these records did not contain information useful to determining cause ofdeath and were subsequently dropped from the analysis. Generally the demographic variationamong these injuries follows trends common to previous findings. Males accounted for 300(82%) of these fatalities. As age increases, the ratio of male to female fatalities increases. Inthe 0-4 age group only 54% of the victims were male, while in the 16-19 age group, 92% of thevictims were male. Ninety-three percent of the fatalities studied were to white children. Themajority of the events (81%) were deemed to be non-occupational. Three hundred and twentythree of the fatalities occurred on the farm property, of which only 20 were within the farmhouse area. Over 40% of all fatalities occurred in the months June through August. Figure 1shows the temporal trend is similar for both children under 16 years of age and youth 16 to 19years of age.In terms of age of the victim, there is a somewhat bimodal distribution of fatality rates(See Figure 2). The highest annual fatality rates by age are generally for children 2 to 5 years ofage (ranging from 14.5 annual fatalities per 100,000 in 3 year olds, to 18.3 fatalities per 100,000in 4 year olds). Otherwise the fatality rates range from 5.0 (10 year old group) to 18.3 (4 yearold group) with the lowest rates occurring for youth 7 to 16 years of age. A total of 250fatalities occurred in children under 16 years of age (9.5 fatalities per 100,000) and 112 (10.5 per100,000) victims were 16 to 19 years of age. In general, the U.S. farm appears to be just asdangerous to younger children as to older youth.6
The vast majority of fatalities on farms (297, 80.7%) were deemed not to be due to thevictim s work. Forty-seven fatalities were identified as work-related on the death certificate(12.8%), while in 24 cases, the relation to work was unknown or missing. Of those 47 fatalitiesthat were work related, 16 victims were younger than 16 years of age. However, this variablemay not truly indicate whether or not the victim was working, or whether the death occurred as aresult of work being performed by others. Additionally, there is no indication whether or notthe victim may have been doing normal household chores, which may be considered work.This does, however, indicate that if one only studies fatalities which are recorded as work-relatedon the death certificate, the majority of on-farm fatalities occurring to younger victims on farmswill be missed.Causes of Death:As seen below (Table 1), the most prevalent causes of farm-related youth deaths7
according to ICD-9 classifications were machine-related (94, 26% of fatalities), drowning (59,16%), and motor vehicles (49, 14%). This is consistent with known risk factors associated withfarming (Adekoya and Pratt, 2001; Myers and Adekoya, 2001; Castillo et al., 1999).Table 1Frequency of Cause of Death, by ICD-9 CategoryFor all victims less than 20 years of age on U.S. Farms, .53Drowning5916.31.59Motor .59Explosion205.50.54Animal184.70.49Struck by Falling .24Fall82.20.22Air ng61.70.16Fire61.70.1633620.81000.089.76Flying Object/Caught InTOTAL*Rate refers to annual number of fatalities per 100,000 youth under 20 years of age.8
Examination of the differences in cause of death for youth 16 years of age and oldercompared to children under 16 shows significant variation for specific causes of death (Table 2).This is important because individuals less than 16 years of age are generally not accounted forin occupational farm fatality studies. To determine the significance of variation between agegroups, among these causes of death, Fisher s Exact test for significance is appropriate. Fisher sExact test allows for examination of 2 x 2 contingency tables with small numbers within cellsfrom large samples. Significant table probabilities indicate that the distribution is unlikely tooccur by chance.Utilizing Fisher s Exact test for significant variation (alpha 0.05), youth 16 years old andgreater appear more likely to die as a result of explosions, falls, homicides, being struck byfalling objects, and suicides than children under 16 years old. (Note: All suicides were foryouth 14 years of age and older.) Younger youth appear more likely to die as the result ofinjuries caused by animals, machines, or suffocation. For all other causes of death, includingdrowning and motor vehicle deaths, there is no significant variation between age groups.9
Table 2Fisher s Exact Results for FrequenciesFor all victims less than 20 years of age on U.S. Farms, 1995-1997.Under 16MachineDrowningMotor VehicleSuffocationSuicideExplosionAnimalStruck by Falling ObjectHomicideElectrocutionFallAir TransportNature/EnvironmentPoisoningFireFlying Object/Caught InTotal764237****810****7553433********25016 to 19181712****1410****9945343********112Table ****Not reportableFor clarification of certain ICD-9 codes, it is important to note the predominant source ofinjury within specific categories. Explosions generally refer to gunshot wounds, of which manyinvolve hunting activities. It should also be noted that the homicide deaths in this study includesituations in which the victim had no relation to the farm prior to death. Machine-related eventsinclude incidents involving farm tractors, trailers pulled by tractors on the farm, and equipment.Many of these machine deaths involve injuries sustained from being crushed by farm tractors orother mobile equipment.To more accurately compare the causes of fatalities between age groups, we calculatedannual fatality rates per 100,000 youth within each age group. The two highest annual fatalityrates (per 100,000) for both age groups (under 16 and 16-19) are for machine-related deaths anddrowning. The third highest fatality rate for youth 16 years of age and older is from suicide10
(1.31 annual fatalities per 100,000), while the third highest for children and youth under 16 isfrom suffocation (0.83 annual fatalities per 100,000). Table 3 provides rates by age for allcauses of death. Again, it appears that certain factors pose very similar risks to youth on thefarm, regardless of age, but this risk may take a different form (e.g., risk from a motor vehicleincident may vary from an older child driving a car to a younger child being improperlyrestrained within the car).Discussion:Data from this study indicate that, in general, youth of all ages face similar overall risk offatalities on farms. These data allow for a more robust determination of Aon farm@ fatalities toyouth and children. The inclusion of all children less than 16, and the inclusion of non-workrelated incidents, allows for examination of all risk factors to youth on the farm. The childplaying near the running tractor may be at similar risk as the youth driving the tractor whilemowing the field. By not accounting for the deaths of children under 16 years of11
Table 3Estimated Fatality Rates for Cause of Death by Age GroupFor all victims less than 20 years of age on U.S. farms, 1995-1997Cause of FatalityUnder 16Rate16 to r 100.94****N/A****N/AStruck by Falling 1940.38Fall30.1150.47Air *N/A****N/AFlying Object/Caught deExplosionAnimalNature/EnvironmentPoisoning**** Not reportableN/A Not Applicable*Rate refers to annual number of fatalities per 100,000 youth under 20 years of age.12
age, or deaths of youths not classified as work-related, we are missing a large number offatalities essentially caused by similar causes of death as those included in most previousoccupational studies. However, this research supports the findings of authors such as Salmi etal. (1989), Pickett et al. (1995), and the Centers for Disease Control and Prevention (CDC b,1999) that indicate a varied nature of death dependent on age and the need for differentprevention strategies based upon age.Although this study utilized death certificate data for any fatality occurring on, or relatedto, the farm, there are issues related to the quality of the data which need to be discussed. Forexample, as noted by Conroy and Sciortino (1997, p. 274), Aoccupational location is moredifficult to identify when workplace is an agricultural environment that has multiple uses@. Inother words, we cannot be sure that the determination of Ainjury at work?@ on the deathcertificate is accurate. Although it is clear that many of the fatalities in this study arerecreational (i.e., hunting incidents), there are a number of cases that appear to be work-relatedbut are not coded as such.Physical size, attention to tasks, experience, and visibility have all been cited as potentialfactors in the increased risk to youth on farms (CDC a, 1999). Given the nature of the causes ofdeath which are significantly different between the age groups, it appears that children under 16are likely to die as a result of their size, strength, and ability to assess danger. For example,these children are likely to be run over by tractors or killed by animals. In both instances, theirproximity to the hazard and their size and strength are likely to be contributing factors. Amongyouth 16 and over, causes of death may be related to underestimation of danger, such as the casewith the fatalities caused by gunshot wounds (explosions).13
Conclusion:The implication of these findings is that education of farm families as a whole isimportant. Youth must be made aware of the dangers they face, particularly when participatingin recreational activities specific to rural or farm environments. Parents must be made aware ofthe dangers their younger children face simply by being in proximity to various dangers. Asnoted by Pickett et al. (1995), younger children are injured or killed when they are: leftunsupervised during busy times, left in proximity to unguarded or moving machinery,accompany workers near moving farm machinery, or are asked to perform a task inappropriate totheir age.For the protection of younger children, restrictive play areas should be established andmaintained (CDC b, 1999). Each member of the farm family should be aware that, especiallyduring working hours, young children should not be allowed to play outside these areas. Inaddition, limiting access to hazards through actions such as placing a fence around a body ofwater could limit hazard exposure for the youngest members of the farm family. Other possiblesolutions may include increased availability or utilization of child care during the busy seasons(CDC b, 1999). For the older youth, increased supervision and education may lead to a greaterunderstanding of the hazards associated with farming and decrease risky behaviors.Although it is difficult to effectively study the risk to younger children on the farm, thisstudy shows that in many situations younger children face risk similar to that of older children.In certain areas younger children face a greater risk. Given the nature of farming, particularlythe family farm, many of these fatalities result from hazard exposure unique to the farm14
environment. Therefore, it is incumbent upon researchers addressing issues of agricultural workrelated injuries and fatalities to include all potential victims in their analysis. Only throughcareful and complete analysis will we be capable of addressing risk in a comprehensive andeffective manner.15
References:Adekoya, N. and S. Pratt. 2001. Fatal unintentional farm injuries among persons less than 20years of age in the United States: geographic profiles. Department of Health and HumanServices, Centers for Disease Control and Prevention, National Institute for Occupational Safetyand Health. Morgantown, WV.Castillo D., N. Adekoya, and John R. Myers. 1999. AFatal work-related injuries in theagricultural production and services sectors among youth in the United States.@ Journalof Agromedicine, Vol. 6(3) 27-41.CDC a. 1999. AChildhood work-related agricultural fatalities B Minnesota, 1994-1997.@Morbidity and Mortality Weekly Report. April 30, 1999, Vol. 48 (16) 332-335.CDC b. 1999. ADeaths among children aged 5 years from farm machinery runovers - Iowa,Kentucky, and Wisconsin, 1995-1998, and United States, 1990-1995.@ Morbidity and MortalityWeekly Report. July 23, 1999, Vol. 48 (28) 605-608.Cogbill, Thomas, Henry Busch Jr., and Gary Stiers. 1985. AFarm accidents in children.@Pediatrics Vol. 76(4) 562-566.Conroy C., and Stanley Sciortino. 1997. ADescribing patterns of occupational agriculturaldeaths: the effect of case definition.@ Journal of Safety Research. Vol. 28(4) 273-281.Janicak, C. 2000. AOccupational fatalities to workers age 65 and older involving tractors in thecrops production agriculture industry.@ Journal of Safety Research. Vol. 31(3) 143-148.Jenkins, L. and David Hard. 1992. AImplications for the use of E codes of the InternationalClassification of Diseases and narrative data in identifying tractor-related deaths in agriculture,United States, 1980-1986.@ Scandinavian Journal of Work and Environmental Health. Vol. 18Supplement 2 49-50.Marlenga, B., W. Pickett, and R.L. Berg. 2001. AAgricultural work activities reported forchildren and youth on 498 North American farms.@ Journal of Agricultural Safety and Health.Volume 7(4): 241-252.Myers, J. and N. Adekoya. 2001. AFatal on-farm injuries among youth 16 to 19 years of age:1982-1994" Journal of Agricultural Safety and Health, Vol. 7(2) 101-112.Myers, J. and K. Hendricks. 2001. Injuries Among Youth on Farms in the United States, 1998Department of Health and Human Services, Centers for Disease Control and Prevention,National Institute for Occupational Safety and Health. Morgantown, WV.
Pickett, William, Robert Brison, and John Hoey. 1995. AFatal and hospitalized agriculturalmachinery injuries to children in Ontario, Canada@ Injury Prevention. Vol. 1 97-102.Richardson, David, Dana Loomis, Susanne Wolf, and Eileen Gregory. 1997. AFatal agriculturalinjuries in North Carolina by race and occupation, 1977-1991.@ American Journal of IndustrialMedicine. Vol. 31 452-458.Rivara, Frederick. 1985. AFatal and nonfatal farm injuries to children and adolescents in theUnited States@ Pediatrics. Vol. 76(4) 567-573.Salmi, L. Rachid, Harold Weiss, Peggy Peterson, Robert Spengler, Richard Sattin, and HenryAnderson. 1989. AFatal farm injuries among young children.@ Pediatrics.World Health Organization. 1977. International Classification of Diseases: Manual on theInternational Statistical Classification of Diseases, Injuries, and Causes of Death. 9th Revision.Geneva, Switzerland.
Preliminary findings show an average annual fatality rate for all farm youth of 9.76 fatalities per 100,000 youth. The most prevalent causes of death are; machinery (94), drowning (59), motor vehicle (49), nature/environment (25) and suffocation (24). Of all youth fatalities occurring while at work, 34.0% (16) are to youth less than 16 years of .