Transcription
Introduction to Technical AnalysisAndrew Wilkinson1
Risk DisclosureFutures are not suitable for all investors. The amount you may lose may be greater than yourinitial investment. Before trading futures, please read the CFTC Risk Disclosure. For a copy,call (203) 618‐5800.Any strategies discussed, including examples using actual securities and price data, arestrictly for illustrative and educational purposes only and are not to be construed as anendorsement, recommendation or solicitation to buy or sell securities or commodities.Past performance is not a guarantee of future results.Interactive Brokers LLC is a member of NYSE, FINRA, SIPC.2
Technical versus Fundamental Technical Analysis of internals PriceVolumePatternSupportResistanceRecognition Fundamental Analysis of externals Economy Management SWOT StrengthsWeaknessOpportunitiesThreats Buy/ Sell recommendation3
Technical versus Fundamental Fundamental analysis leads to price predictions usingvaluation ratios Technical analysis uses trend and pattern recognition topredict prices4
What’s in a Chart? Charts show the price performance of an underlying asset orsecurity Get overview with at least a 6 month picture Consider your timeframe carefully Charts express prices as lines, bars or candlesticks5
Chart Types Trader Work Station (TWS) displays prices as a: Line Joins closing prices between each specified timeframe Bar Uses an open/high/low/close convention Candlestick More weight attached to session direction Volume and Open Interest Analyst pays attention to the volume associated with move within a given session6
What’s the Aim? Define the big picture trend – if there is oneCompare health of underlying to a benchmarkSearch for shorter‐term opportunitiesUnderstand the likelihood of immediate up or down movementDefine rangeEstablish entry or exit pointsDetermine warning signs of a breach of trend or a pattern reversal7
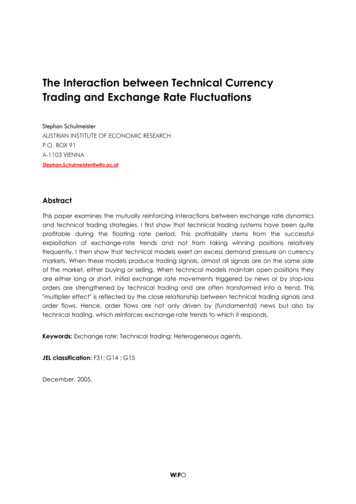
Trendlines Straight line joining two or more price points Support line depicts upward trend Resistance depicts an area above current price that investorsmay find hard to breach Both can be horizontal lines Investors may eyeball the trend8
TrendlinesABA – 1450‐1250 200 target is 1250‐200 1050B – 950 – 750 200 target is 750‐250 5509
S&P 500 index – overhead resistance10
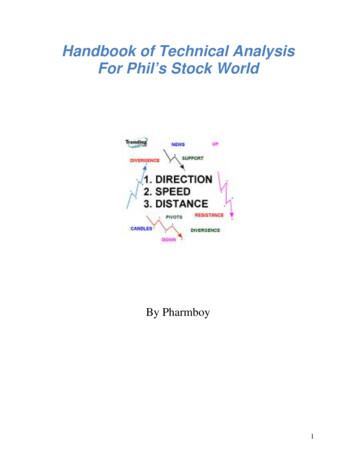
Chart Patterns Trendlines show prevailing up or down trend Parallel lines depict ‘trading channel’ Patterns emerge Continuation Reversal TriangleHead & shouldersWedgePennant & flags11
TrianglesContinuationReversalContinuation12
Wedge13
Pennants and FlagsFlags and pennants work best on intra-daycharts and sometimes need the technicianto use a loose interpretation14
Studies TWS has a variety ofcommonly used technicalindicators Within a chart, select“Charts” and “Add Study” For brief description of anystudy, use the search boxon the IB website15
Moving Averages One of the simplest forms of analysis Compares average price for x days against a shorter period of y days Buy when more sensitive shorter moving average rises faster than longerperiod Sell when shorter moving average falls faster than longer period Different securities, indices and instruments require different length ofdata (one size does not fit all) Common periods are 5, 9, 21, 50, 90 and 20016
17
ADX/DMI Strength of trend indicator Uses two filters (DMI and DMI‐) The net of these two values is smoothed to create AverageDirectional Index This index rises to confirm trending prices ADX returns values 0‐100 Optimal performance when ADX is between 20‐4018
19
MACD Moving Average Convergence Divergence Employs exponential moving averages Subtracts longer moving average from shorter moving average tocreate MACD Uses an even shorter exponential moving average to create ‘signalline’ MACD passing up and down through signal line generates buy and sellsignals MACD minus signal also creates histogram – also a reliable technicalindicator20
21
Parabolic SAR Stop and Reverse May depict the current “trend” Initially established as a point at which prevailing positionshould be closed Rising dots below price are long exits Falling dots above price are short exits22
23
Pivot Points TWS creates two resistance points above priceTwo support prices below priceBoth use previous days high, low and closing pricesPivot point is calculated using a five‐point systemSome traders use these to cluster buy and sell orders for day tradingNeed to know when either is giving way24
25
Relative Strength Indicator (RSI) Looks at a set of user‐defined data and compares number of up barsversus down bars to create an index Indicator oscillates between 0‐100 and confirms market strength Overbought readings range between 80‐100 Oversold readings range 0‐20 Warning: Some of the best moves occur in these ranges! Useful for finding divergence between price and RSI to show false moves26
27
Stochastic Oscillator Creates two lines ‐ %k and %d %k ‐ looks at most recent closing price and compares to the lowestreading from a specified range and divides by overall period range %d – moving average of %k Buy and sell indications occur when %k crosses %d Again useful for confirmation of price action at lows (highs)28
29
On Balance Volume Volume is a key component to trend development Creates a single line below the chart to show cumulative volumeallowing for price direction Daily volume is ADDED when price closes up Volume total is SUBTRACTED when prices fall Use to gauge whether higher volume is supporting up or down trend Drawback is price settlement30
31
Accumulate/Distribution Enhanced version of OBV Doesn’t consider daily price change Focus on location of close relative to range of closes before adding orsubtracting day’s volume total AD line should follow prices Cumulative buying should see line rise Selling en masse should see line decline Looking for divergence between declining prices and accumulation ofvolume32
33
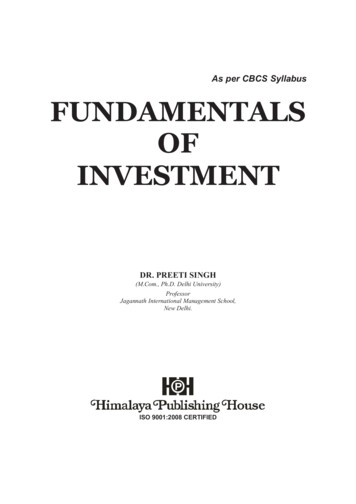
Fibonacci Numbers Series of mathematical relationshipsTechnician believes that history will repeat itselfPrices move in predictable waves after a move has been establishedKey retracement points: 23.6%38.2%50%61.8%76.4%34
Fibonacci Numbers35
Conclusion Technical analysis is the study of prices Chartist identifies patterns to make predictions Patterns can be numerically evaluated and give rise tonumerous studies Valuable work, but you must be prepared to apply variousstudies to different asset classes and time frames36
Questions?37
Technical versus Fundamental Technical Analysis of internals . commonly used