Transcription
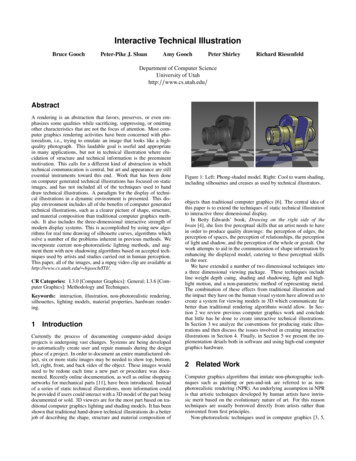
Interactive Technical IllustrationBruce GoochPeter-Pike J. SloanAmy GoochPeter ShirleyRichard RiesenfeldDepartment of Computer ScienceUniversity of Utahhttp: www.cs.utah.edu AbstractA rendering is an abstraction that favors, preserves, or even emphasizes some qualities while sacrificing, suppressing, or omittingother characteristics that are not the focus of attention. Most computer graphics rendering activities have been concerned with photorealism, i.e., trying to emulate an image that looks like a highquality photograph. This laudable goal is useful and appropriatein many applications, but not in technical illustration where elucidation of structure and technical information is the preeminentmotivation. This calls for a different kind of abstraction in whichtechnical communication is central, but art and appearance are stillessential instruments toward this end. Work that has been doneon computer generated technical illustrations has focused on staticimages, and has not included all of the techniques used to handdraw technical illustrations. A paradigm for the display of technical illustrations in a dynamic environment is presented. This display environment includes all of the benefits of computer generatedtechnical illustrations, such as a clearer picture of shape, structure,and material composition than traditional computer graphics methods. It also includes the three-dimensional interactive strength ofmodern display systems. This is accomplished by using new algorithms for real time drawing of silhouette curves, algorithms whichsolve a number of the problems inherent in previous methods. Weincorporate current non-photorealistic lighting methods, and augment them with new shadowing algorithms based on accepted techniques used by artists and studies carried out in human perception.This paper, all of the images, and a mpeg video clip are available athttp://www.cs.utah.edu/ bgooch/ITI/.CR Categories: I.3.0 [Computer Graphics]: General; I.3.6 [Computer Graphics]: Methodology and Techniques.Keywords: interaction, illustration, non-photorealistic rendering,silhouettes, lighting models, material properties, hardware rendering.1 IntroductionCurrently the process of documenting computer-aided designprojects is undergoing vast changes. Systems are being developedto automatically create user and repair manuals during the designphase of a project. In order to document an entire manufactured object, six or more static images may be needed to show top, bottom,left, right, front, and back sides of the object. These images wouldneed to be redone each time a new part or procedure was documented. Recently online documentation, as well as online shoppingnetworks for mechanical parts [11], have been introduced. Insteadof a series of static technical illustrations, more information couldbe provided if users could interact with a 3D model of the part beingdocumented or sold. 3D viewers are for the most part based on traditional computer graphics lighting and shading models. It has beenshown that traditional hand-drawn technical illustrations do a betterjob of describing the shape, structure and material composition ofFigure 1: Left: Phong-shaded model. Right: Cool to warm shading,including silhouettes and creases as used by technical illustrators.objects than traditional computer graphics [6]. The central idea ofthis paper is to extend the techniques of static technical illustrationto interactive three dimensional display.In Betty Edwards’ book, Drawing on the right side of thebrain [4], she lists five perceptual skills that an artist needs to havein order to produce quality drawings: the perception of edges, theperception of spaces, the perception of relationships, the perceptionof light and shadow, and the perception of the whole or gestalt. Ourwork attempts to aid in the communication of shape information byenhancing the displayed model, catering to these perceptual skillsin the user.We have extended a number of two dimensional techniques intoa three dimensional viewing package. These techniques includeline weight depth cuing, shading and shadowing, light and highlight motion, and a non-parametric method of representing metal.The combination of these effects from traditional illustration andthe impact they have on the human visual system have allowed us tocreate a system for viewing models in 3D which communicate farbetter than traditional rendering algorithms would allow. In Section 2 we review previous computer graphics work and concludethat little has be done to create interactive technical illustrations.In Section 3 we analyze the conventions for producing static illustrations and then discuss the issues involved in creating interactiveillustrations in Section 4. Finally, in Section 5 we present the implementation details both in software and using high-end computergraphics hardware.2 Related WorkComputer graphics algorithms that imitate non-photographic techniques such as painting or pen-and-ink are referred to as nonphotorealistic rendering (NPR). An underlying assumption in NPRis that artistic techniques developed by human artists have intrinsic merit based on the evolutionary nature of art. For this reasontechniques are usually borrowed directly from artists rather thanreinvented from first principles.Non-photorealistic techniques used in computer graphics [3, 5,
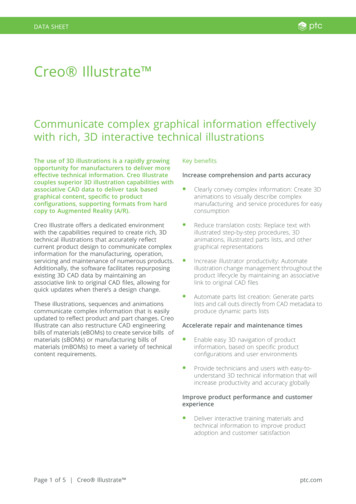
Figure 2: Three line conventions suggested by Martin [14]. Left:single weight used throughout the image. Middle: heavy lineweight used for outer edges, other lines are thinner. Right: varyline weight to emphasize perspective.6, 7, 12, 13, 16, 22, 26] vary greatly in their level of abstraction.Those that produce a loss of detail, like watercolor or pen-and-ink,produce a high level of abstraction. However, several previous papers use a low level of abstraction which preserves precise shapeproperties and are thus well suited to technical illustration, but lackinteraction.Although there is a wealth of computer graphics research dealing with the display of three dimensional images, there has beenlittle exploration into utilizing artistic techniques to aid in the conveyance of shape information in an interactive setting. Markosian etal. [13] developed algorithms for probabilistically calculating onlythe silhouettes for polyhedral models in real time. There are also3D paint programs which allow the user to experiment with nonphotorealistic methods [19, 23] but these methods restrict interaction and require users trained in traditional drawing and paintingtechniques. In contrast, our methods incorporate user interactionwith automatically generated 3D technical illustrations based ongeometric models.3 Static Illustration PrinciplesHuman-drawn technical illustrations are usually stand-alone images from a single viewpoint presented on a non-stereo mediumsuch as pen on paper. In this section we discuss the components ofsuch illustrations that we use in a computer graphics context: linecharacter, shading and shadowing.3.1 Lines in Technical IllustrationPrevious foundational research [5, 6, 13, 21] established which linesshould be drawn in a computer generated image to maximize theamount of information conveyed while minimizing the number oflines drawn. They observed that illustrators use edge lines, consisting of surface boundaries, silhouettes, discontinuities, and creasesto separate individual parts and to suggest important features in theshape of each object. These static images represented edge lineswith black lines of uniform weight.There are many line weight conventions which the illustratorchooses among based on the intent of the image. Martin [14] discusses three common conventions, shown in Figure 2: a single lineweight used throughout the image, two line weights with the heavier describing the outer edges, and varying the line weight along asingle line emphasizing the perspective of the drawing with heavylines in the foreground. One way of achieving this effect in rastergraphics is to vary the line weight dependent upon the direction ofthe light source or in an user specified direction, giving a shadowedeffect. However, most illustrators use bold external lines, with thinner interior lines, which aid in the perception of spaces [4].Figure 3: Left: Illustrators sometimes use the convention of whiteinterior edge lines to produce a highlight. Image copyright 1995Macmillan [20]. Used by permission. Right: An image producedby our system, including shading, silhouettes and white creaselines.In almost all illustrations, edge lines are drawn in black. Occasionally, if the illustration incorporates shading, another conventionis used in which some of the interior lines are drawn in white, likea highlight. Lines drawn in black and white suggest a light sourceand denote the models orientation. For example, Figure 3 comparesan illustration produced by an artist and an image from our systemin which white creases are drawn.3.2 ShadingFor shading we use one of three modes. The first two are the diffuseand metallic shading presented by Gooch et al. [6]. In its simpliestform the cool to warm shading interpolates from a cool (blue-green)to a warm (yellow-orange) color based on the surface normal. Thiscool-to-warm diffuse shading is shown in Figure 4a. The thirdmethod is an adaptation of this cool to warm shading, simulatingthe more dramatic shading effects sometimes used by artists. Figure 4b illustrates the effect achieved when the reflected light fromthe left of the object produces a back-splash of light opposite the direct lighting source. This is accomplished by modifying the modelof [6] with a simple multiplier:(j cos j (1 ,))p;where and p are free parameters which, for this image, are set to0.76 and 0.78, respectively.3.3 ShadowingIllustrators only include shadows when they do not occlude detail inother parts of the object [14, 15, 20]. In 3D interactive illustrations,adding only a drop shadow on a ground plane, not the shadows thatan object may cast onto itself, provide helpful visual clues withoutoccluding important details on the object. It is probably not important that these shadows be highly accurate to provide valuableinformation about three-dimensional structure, especially the spatial layout of a scene [10, 25]. We provide the option to display oneof three types of shadow which will be discussed in Section 5.3, aswell as the option to make the shadow colored, as done by manyartists [18].
Figure 5: Left: Model with cool to warm shading with lights positioned up and to the right. Middle: After the camera position ismoved to view the side of the model. Right: After moving the object instead of the camera, allowing the surface to vary completelyfrom cool to warm.(a) Shading by Gooch et al.(b) Shading with splash backFigure 4: The dark banding in the light splash back model can communicate more curvature information and works well on organicmodels.4 Dynamic Illustration PrinciplesThe question remains, how do the 2D illustration rules change foran interactive 3D technical illustration? Adapting the shading andline conventions presented earlier is fairly straightforward as longas the line weight conventions have frame-to-frame coherence. Themore interesting issues depend upon changing the viewer’s positionversus moving the object. Since there are no relevant protocols intraditional illustration, we may want to base these 3D illustrationconventions on how one would move real objects. This has an effect on how the light changes with respect to the object, the lightposition can be specified as relative to the object or to the viewer.4.1 Viewer Versus Object MotionThe shading models presented in Section 3.2 are used to full advantage if the surface color varies completely from cool to warm.This involves moving the object and not the viewpoint or the lights.As seen in Figure 5, moving the object while holding the cameraand light positions constant presents more shape information andsurface detail. For this reason our interface rotates the object ratherthan the viewer, leaving the background, light, and viewer in place.When multiple objects appear in a scene, illustrators often usedifferent shading across each object, inferring that each object hasits own light, which does not affect other objects in the environment, similar to the virtual lights described by Walter et al. [24].For example, two objects in a scene may be lit differently to drawattention to different attributes of each object. If this were accomplished by adding two lights to the environment, the multiple highlights would be confusing.4.2 Material PropertiesMost material properties are nearly constant as the view direction orlighting changes. However, the metal shading presented by Goochet al. is the replication of the anisotropic reflection [8] due to thesurface of the object and the reflection of the environment. When areal metal part is rotated in one’s hand, the banding does not stick toFigure 6: Metal-shaded object with shadow and ground plane.White creases and black silhouette lines are also drawn.the object, but remains constant since the environment is not changing. However, in a non-photorealistic interactive environment itmay be too jarring to have the metal shading change abruptly. Using a metal texture would be more appropriate and a metal texture inan interactive environment would still properly convey the materialproperty.5 ImplementationAs outlined in the previous two sections, our system needs the capability to interactively display a custom shading model, silhouettes,and interior edges. In addition, this interaction must be possible forcomplex geometric models. In this section we describe a varietyof techniques for achieving these goals, and describe the tradeoffsinvolved in choosing a particular technique.5.1 Displaying Important Edges and SilhouettesTo draw silhouettes, we have implemented several methods of extracting and displaying edge lines from polyhedral models, whichwill be discussed in Section 5.1.1 and 5.1.2. They can be roughlybroken down into two categories. The first assumes no prior knowledge or preprocessing of the model and heavily leverages commodity graphics hardware. The second set of methods use preprocessing of the model and are purely software algorithms. Both hardware
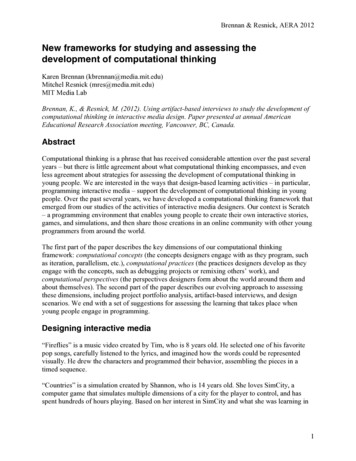
Figure 8: The arc in a Gauss map seen in 2D. The two bold linesegments are faces that share a vertex. The orientations of theirnormals can be represented as points on the circle. The arc betweenthose two points represents all orientations swept out between thetwo normals. In 3D the same reasoning applies, and the arc is anarbitrary segment on a great circle.(a)(b)Figure 7: Adding the silhouettes to the environment map insteadof calculating silhouettes from the geometry produces interestingartistic effects.and software algorithms clearly have a place. The set of hardwaremethods are useful because of ease of implementation. The software methods are advantageous due to their flexibility and lowercomputational complexity. All of the software methods assume thatthe models are either manifold or manifold with boundary.We can also extract boundary curves, edges adjacent to only asingle face, and creases, that is, the edge between two front facingpolygons whose dihedral angle is above some threshold. The user isprovided the option to draw these edges, dependent upon the modeland intent of the image. The computation and drawing of creases isdiscussed in Section 5.1.3.the slope of the triangles and a bias factor. This technique can beused to create something similar to a silhouette, effectively a halo.The depth values are pushed forward instead of back to allow linesto be rasterized over faces. Then wide lines are drawn. Where thereare large discontinuities in depth (silhouettes and boundaries), onlypart of the line is drawn. This method requires only two passes instead of the three listed above, but can be fairly sensitive to the parameters of the polygon offset function. Using OpenGL hardwaremakes the implementation simple, however, it limits the thicknessof the edge lines.Another hardware technique is to add the edge lines to a shading environment map as a preprocess. However, as shown in Figure 7(a), the lines lack crispness, and if the model varies greatlyin curvature, there may be large black regions. In order to includesilhouettes on the feet of the cow in Figure 7(b), we have to set thethreshold low enough to draw lines in these high curvature regions.This causes regions which have relatively low curvature to be filledin with black. Although this effect produces some interesting, artistic results, it may be inappropriate for technical illustration.5.1.25.1.1Hardware MethodsUsing multi-pass rendering [1] there are several ways to extractsilhouettes. The algorithm presented in the SIGGRAPH 1998OpenGL Course doesn’t capture internal silhouette edges and requires four passes of rendering. We recently found out that thereis concurrent work similar in spirit to our hardware methods [2].Below we provide algorithms which require two or three renderingpasses and capture internal silhouettes.In a polyhedral model a silhouette is an edge that is connectedto both a front facing and a back facing polygon. The following ispseudo code for the basic algorithm:draw shaded front facesdraw front faces in line mode:setting only stencildraw back faces in line mode:setting color if stencil was setdecrementing stencil if drawnTo draw lines over polygons, the PolygonOffset extension (orPolygonOffset function in GL 1.1) [17] needs to be used. This function effectively modifies the depth values of the first pass based onSoftware MethodsA straightforward technique for drawing silhouettes is to explicitlytest every edge in the model. We compute an edge structure basedon the face normals of the model, which are also used for back faceculling as in Zhang et al. [27]. An edge is a silhouette edge if andonly if: n( 1 ( v , e)) ( n2 ( v , e)) 0;where v is a vertex on the edge, and ni are the outward facing surface normal vectors of the two faces sharing the edge. This situationonly occurs when one face is front facing and the other is back facing. While this computation is simple, it can potentially becomea bottleneck with large models. Since we have to shade (or primethe z buffer for hidden surface elimination) this computation can bedone in parallel while the model is being rendered.We use a more complex preprocess and search algorithm whenclassifying edges becomes a bottleneck. This algorithm is similar inspirit to Zhang et al. [27], but requires looking at arcs on the Gaussmap instead of points. The Gauss map of an edge on a polyhedralmodel is a great arc on the sphere of orientations (Figure 8). Underorthographic projection, a plane through the origin in this spheredefines the view. All of the faces on one side of the plane are frontfacing, and on the other side they are back facing. If the “arc” corresponding to an edge is intersected by this plane, it is a silhouette
ModelS CrankL 7611Naive.027.165.082Gauss.0198.096.016Num Sil387312469273Table 1: Model information and timings, in seconds on 195MhzR10k for naive and hierarchical silhouette extraction methods under an orthographic view.Level01234Figure 9: All creases are drawn in white (Left), and then all of thesilhouette lines are drawn in black (Right), overlapping the creases.edge. To search for such edge/plane intersections, we store the arcsin a hierarchy on the sphere to quickly cull edges that can not besilhouettes. We have implemented a decomposition of the spherestarting with a platonic solid (octahedron or icosahedron) and allsuccessive levels are four to one splits of spherical triangles. Thismakes silhouette extraction logarithmic in the number of edges forsmooth models where the arcs tend to be short. An arc is stored atthe lowest possible level of the hierarchy. One problem with thishierarchy is that the edges of the spherical triangles on the sphereinterfere with the arcs and limit how far they can be pushed downthe hierarchy. The probability of being stored in a leaf node thatcan contain an arc of a given length decreases as the size of thetriangles shrink because the boundaries of these spherical trianglesbecome denser as you recurse. An ad hoc solution to this problem isto use multiple hierarchies, whose spherical triangles are different,and store an arc in the hierarchy with the spherical triangle with thesmallest area that contains it. A more attractive alternative wouldbe to use “bins” on the sphere that overlap and/or making data dependent hierarchies.Under perspective viewing, the region you have to check grows,based on planes containing the object and intersecting the eye.Building a spatial hierarchy over the model as in [27] would minimize this effect. One advantage of any software approach is that itmakes it easier to implement different styles of line drawing.5.1.3Line StylesAs discussed in Section 3.1, line width can appear to change byeither shading the lines based on the surface orientation, or by usingOpenGL 1D texture mapping hardware to shade lines. Using a 1Dtexture map, there can be a relationship between the surface and adistance to a light or to a plane in the scene.Fat boundary lines can be drawn with either the software or hardware methods. These lines are drawn after the rest of the model hasbeen drawn (shading, creases, silhouettes). While the earlier phasesare drawn, they set a stencil bit, indicating that the given pixel hasbeen draw for this frame. Finally, the boundary silhouettes aredrawn over again with wider lines. In hardware this requires a fulltraversal of the front or back faces, while using software extractionalgorithms only require a traversal of the silhouette edges whichhave been previously computed. All of these algorithms are moreefficient than the methods mentioned in the OpenGL course [1] because it required four rendering passes while these algorithms require only one extra pass, and that pass may only be of the silhou-No 322615Table 2: Hierarchy method showing the number of edges stored ateach level on a Gaussian sphere for 25k-polygon crank shaft modelfor non-overlapping and overlapping bins.ette edges.Creases are extracted independent of the view and are drawn aswhite lines. After adding shading and silhouettes, only the creasesthat are connected to two front facing faces, and are not alreadysilhouettes, are visible. To emulate the look of illustrations thecreases need to be drawn with the same thickness as the silhouettes,as shown in Figure 9.One problem when rendering rasterized wide lines is the “gaps”where the lines do not overlap. A solution to this is to render the endof the lines with large points, effectively filling in the gaps. There ismuch less of a performance loss with the software extraction methods, since they only need to redraw the actual silhouettes, not theentire model.5.1.4 DiscussionSilhouette finding using specialized graphics hardware likeOpenGL is simple to implement and not as dependent on “clean”models. However it is less flexible and does not allow the user tochange line weight. The software methods we discussed are morecomplex and depend on “clean” models which must have sharedvertices, otherwise internal boundaries can not be checked for silhouettes. However the software methods provide more flexibilityand, potentially, better performance.Table 1 presents the information of two extreme cases. Thesecases are based on orthographic views. Under perspective projection some form of bounding volume hierarchy would have to beemployed [27] to increase the efficiency. Both the simplified andthe finely tessellated versions of the crank shaft model have manysharp features, while the sphere has very small dihedral angles.The current implementation of the hierarchy method uses anicosahedron with 4 levels of subdivision, i.e., 1280 faces. On thesphere this method is extremely efficient. When using overlappingbins, all of the edges are stored in the leaf nodes. When using nonoverlapping bins only 84% of the edges are in the leaf nodes and2132 are on level 0. Table 2 shows the number of edges storedat every level of the hierarchy for non-overlapping and overlappinghierarchies. The overlapping method did a much better job, evenon the simplified crank model.Parallelizing the silhouette extraction with the rest of the rendering can cause the extraction time to be negligible. A separatethread can extract silhouettes while the polygons are being renderedto shade the model or initialize the Z buffer. This parallelization
Light SourceObject(a) Environment map used togenerate Figure 4(a).(b) Environment map used togenerate Figure 4(b).ReceivingPlaneFigure 10: Shaded sphere images used for environment maps.takes only three-thousands of a second for the sphere and five onehundredths on the large crank shaft model. If you are using software visibility algorithms this technique would probably prove tobe more effective.5.2 ShadingThere are several ways to apply NPR shading models using hardware [6, 1]. We chose to use environment maps because they provide the most flexibility in the shading model. This effectively allows us to evaluate a lighting model at every normal/reflection direction in the visible hemisphere in eye-space.We evaluated the whole shading equation in a Phong environment map. In using an environment map as shown in Figure 10,all normals in eye-space are mapped to a 2D texture. This shadingonly is valid in eye-space, but it is possible to extend these to viewindependent environment maps [9]. The cool-to-warm and light“splashback” terms mentioned in Section 3.2 are a function of thelight direction and could be implemented with this representation.However, the Phong term would have to be computed for each vieweven though a single light source could be implemented as a single1D texture map instead of a full 2D texture map.5.2.1Metal ShadingThe metal shading technique we use assumes a principle directionof curvature and striping occurs in an orthogonal direction. We firstcompute a table of random intensities where sample is: b (r a),where the base b is -0.1, r is a random number in [0,1] and a is 1.4.This causes the distribution be to biased towards white and black.We then filter each element in the table with each of its neighborsusing a 1-5-1 weighting scheme and clamp it to be in the range of[0,1]. We make it periodic so there is some coherence which willremain smooth as it wraps around the model.The table is then resampled into a 1D texture map. The texturemap is used as a cosine distribution because it is indexed via a dotproduct. The resampling makes sure the bands are uniformly distributed on a cylinder.We then render the model with this texture map. The texturematrix computes the dot product with a fixed axis orthogonal to theprinciple curvature direction, and remap the value into [0,1]. Thistechnique can be scaled in order to change the spacing of the stripes.By itself, this texture does not look convincing, therefore weadd Phong highlights computed by lighting a texture map in eyespace with several Phong light sources oriented in the directions ofa icosahedron’s vertices. A fairly large specular power, empiricallyFigure 11: Drawing the shadow of a sphere with a spherical lightsource directly onto a ground plane directly below it, traditionallyeach sample will render an ellipse. To get an accurate representation of the penumbra, this surface of the spherical light source needsto be sampled in 2 dimensions. With our method, each shadow is aconcentric circle, requiring less samples to get the same results.around 30-50, seemed to work best with a specular coefficient ofabout 0.3.5.3 ShadowingWe draw shadows in one of three modes: a single hard shadow, ashadow with a hard umbra and a hard penumbra, and a soft shadow,as shown in Figure 12. Both of the later two modes approximatea spherical light source at a fixed distance from the center of themodel in the direction of the light source used for shading.The easiest and fastest method to draw simple shadows is to explicitly draw an umbra and penumbra. We draw two hard shadows,one from the center of the spherical light source back in the direction used for shading, and the other forward.Soft shadows are problematic to do both accurately and efficiently, so we use an approximation to gain speed. Instead of using the conventional method to simulate an area light source, i.e.,sampling the area light source and accumulating the point approximations, we project multiple shadows from the center of the approximation sampling a 1D direction, the ground plane’s normal.This is done by projecting the same shadow onto a stack of planes,then translating the shadows to the ground plane and accumulatingthem, as shown in Figure 11.One thing to note is that with this method, each “sample” is aperspective remapping of the first, intersected on a different plane.We could render a single shadow, copy it into texture memory andthen remap it correctly to accumulate the other samples. This ismuch faster than projecting multiple jittered samples since there isa lower depth complexity for rasterization and a much lower burdenon the transformation if the texture mapping method were used.This method assumes that the silhouette from different points onthe spherical light source is the same, i.e., the projection is the same.The planes coming out of the receiver will not correctly model contact. However, you can render only the lower planes if contact occurs resulting in a less realistic shadow, but one without distractingspill-over.
6 Future Work and Conclusion(a) Hard penumbra and hard umbra.We have reported on an approach that produces interactive technical illustrations. This work incorporates established principlesfrom traditional art in a framewo
this paper is to extend the techniques of static technical illustration to interactive three dimensional display. In Betty Edwards’ book, Drawing on the right side of the brain [4], she lists five perceptual skills that an artist needs to have in order