Transcription
Technical Analysis from A to Zby Steven B. AchelisTechnical Analysis from A to ZSteven B. Achelis
Technical Analysis from A to Zby Steven B. AchelisPREFACEOver the last decade I have met many of the top technical analysis "gurus" as well asshared experiences with thousands of newcomers. The common element I've discoveredamong investors who use technical analysis, regardless of their expertise, is the desire tolearn more.No single book, nor any collection of books, can provide a complete explanation oftechnical analysis. Not only is the field too massive, covering every thing from FederalReserve reports to Fibonacci Arcs, but it is also evolving so quickly that anything writtentoday becomes incomplete (but not obsolete) tomorrow.Armed with the above knowledge and well aware of the myriad of technical analysisbooks that are already available, I feel there is a genuine need for a concise book ontechnical analysis that serves the needs of both the novice and veteran investor. That iswhat I have strived to create.The first half of this book is for the newcomer. It is an introduction to technical analysisthat presents basic concepts and terminology. The second half is a reference that isdesigned for anyone using technical analysis. It contains concise explanations ofnumerous technical analysis tools in a reference format.When my father began using technical analysis thirty years ago, many people consideredtechnical analysis just another 1960's adventure into the occult. Today, technical analysisis accepted as a viable analytical approach by most universities and brokerage firms.Rarely are large investments made without reviewing the technical climate. Yet evenwith its acceptance, the number of people who actually perform technical analysisremains relatively small. It is my hope that this book will increase the awareness and useof technical analysis, and in turn, improve the results of those who practice it."Information is pretty thin stuff, unless mixed with experience."-Clarence Day, 1920
Technical Analysis from A to Zby Steven B. AchelisACKNOWLEDGMENTSThe truth that no man is an island certainly holds true here. This book would not bepossible without the help of thousands of analysts who have studied the markets andshared their results. To those from whom I have compiled this information, thank you.There are two people who have helped so much that I want to mention them by name.Without John Slauson's editorial and research assistance, this book would not have beenpublished until the next century; And Denise, my wife, who has been an activeparticipant in my work for more than a dozen years.TERMINOLOGYFor brevity, I use the term "security" when referring to any tradable financial instrument.This includes stocks, bonds, commodities, futures, indices, mutual funds, options, etc.While I may imply a specific investment product (for example, I may say "shares" whichimplies an equity) these investment concepts will work with any publicly traded financialinstrument in which an open market exists.Similarly, I intermix the terms "investing" and "trading." Typically, an investor takes along-term position while a trader takes a much shorter-term position. In either case, thebasic concepts and techniques presented in this book are equally adept."Words are like money; there is nothing so useless, unless when in actual use."- Samuel Butler, 1902
Technical Analysis from A to Zby Steven B. AchelisPART ONE: INTRODUCTION TO TECHNICAL ANALYSISThis introduction was written for investors who are new to technical analysis. It presentsthe basic concepts and terminology in a concise manner. If you are familiar withtechnical analysis, you will probably find the Reference the appropriate starting point. Technical AnalysisPrice FieldsChartsSupport & ResistanceTrendsMoving AveragesIndicatorsMarket IndicatorsLine StudiesPeriodicityThe Time ElementConclusionTECHNICAL ANALYSISTechnical analysisShould I buy today? What will prices be tomorrow, next week, or next year? Wouldn'tinvesting be easy if we knew the answers to these seemingly simple questions? Alas, ifyou are reading this book in the hope that technical analysis has the answers to thesequestions, I'm afraid I have to disappoint you early--it doesn't. However, if you arereading this book with the hope that technical analysis will improve your investing, Ihave good news--it will!Some historyThe term "technical analysis" is a complicated sounding name for a very basic approachto investing. Simply put, technical analysis is the study of prices, with charts being theprimary tool.The roots of modern-day technical analysis stem from the Dow Theory, developedaround 1900 by Charles Dow. Stemming either directly or indirectly from the DowTheory, these roots include such principles as the trending nature of prices, pricesdiscounting all known information, confirmation and divergence, volume mirroringchanges in price, and support/resistance. And of course, the widely followed Dow JonesIndustrial Average is a direct offspring of the Dow Theory.Charles Dow's contribution to modern-day technical analysis cannot be understated. Hisfocus on the basics of security price movement gave rise to a completely new method ofanalyzing the markets.
Technical Analysis from A to Zby Steven B. AchelisThe human elementThe price of a security represents a consensus. It is the price at which one person agreesto buy and another agrees to sell. The price at which an investor is willing to buy or selldepends primarily on his expectations. If he expects the security's price to rise, he willbuy it; if the investor expects the price to fall, he will sell it. These simple statements arethe cause of a major challenge in forecasting security prices, because they refer to humanexpectations. As we all know firsthand, humans are not easily quantifiable norpredictable. This fact alone will keep any mechanical trading system from workingconsistently.Because humans are involved, I am sure that much of the world's investment decisionsare based on irrelevant criteria. Our relationships with our family, our neighbors, ouremployer, the traffic, our income, and our previous success and failures, all influence ourconfidence, expectations, and decisions.Security prices are determined by money managers and home managers, students andstrikers, doctors and dog catchers, lawyers and landscapers, and the wealthy and thewanting. This breadth of market participants guarantees an element of unpredictabilityand excitement.Fundamental analysisIf we were all totally logical and could separate our emotions from our investmentdecisions, then, fundamental analysis the determination of price based on future earnings,would work magnificently. And since we would all have the same completely logicalexpectations, prices would only change when quarterly reports or relevant news wasreleased. Investors would seek "overlooked" fundamental data in an effort to findundervalued securities.The hotly debated "efficient market theory" states that security prices representeverything that is known about the security at a given moment. This theory concludesthat it is impossible to forecast prices, since prices already reflect everything that iscurrently known about the security.The future can be found in the pastIf prices are based on investor expectations, then knowing what a security should sell for(i.e., fundamental analysis) becomes less important than knowing what other investorsexpect it to sell for. That's not to say that knowing what a security should sell for isn'timportant--it is. But there is usually a fairly strong consensus of a stock's future earningsthat the average investor cannot disprove."I believe the future is only the past again, entered through another gate."- Sir Arthur Wing Pinero, 1893
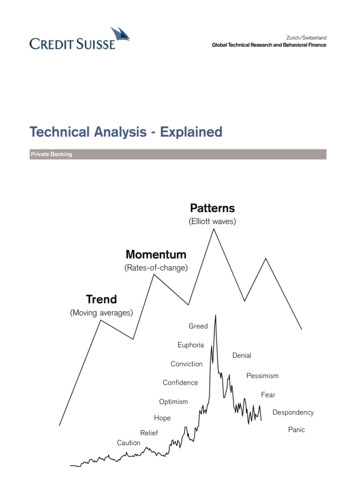
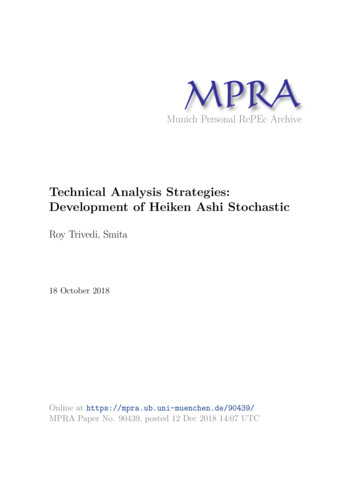
Technical Analysis from A to Zby Steven B. AchelisTechnical analysis is the process of analyzing a security's historical prices in an effort todetermine probable future prices. This is done by comparing current price action (i.e.,current expectations) with comparable historical price action to predict a reasonableoutcome. The devout technician might define this process as the fact that history repeatsitself while others would suffice to say that we should learn from the past.The roulette wheelIn my experience, only a minority of technicians can consistently and accuratelydetermine future prices. However, even if you are unable to accurately forecast prices,technical analysis can be used to consistently reduce your risks and improve your profits.The best analogy I can find on how technical analysis can improve your investing is aroulette wheel. I use this analogy with reservation, as gamblers have very little controlwhen compared to investors (although considering the actions of many investors,gambling may be a very appropriate analogy)."There are two times in a man's life when he should not speculate: when he can't affordit, and when he can."- Mark Twain, 1897A casino makes money on a roulette wheel, not by knowing what number will come upnext, but by slightly improving their odds with the addition of a "0" and "00."Similarly, when an investor purchases a security, he doesn't know that its price will rise.But if he buys a stock when it is in a rising trend, after a minor sell off, and when interestrates are falling, he will have improved his odds of making a profit. That's not gambling-it's intelligence. Yet many investors buy securities without attempting to control the odds.Contrary to popular belief, you do not need to know what a security's price will be in thefuture to make money. Your goal should simply be to improve the odds of makingprofitable trades. Even if your analysis is as simple as determining the long-,intermediate-, and short-term trends of the security, you will have gained an edge thatyou would not have without technical analysis.Consider the chart of Merck in Figure 1 where the trend is obviously down and there isno sign of a reversal. While the company may have great earnings prospects andfundamentals, it just doesn't make sense to buy the security until there is some technicalevidence in the price that this trend is changing.
Technical Analysis from A to Zby Steven B. AchelisFigure 1Automated tradingIf we accept the fact that human emotions and expectations play a role in security pricing,we should also admit that our emotions play a role in our decision making. Manyinvestors try to remove their emotions from their investing by using computers to makedecisions for them. The concept of a "HAL," the intelligent computer in the movie 2001,is appealing.Mechanical trading systems can help us remove our emotions from our decisions.Computer testing is also useful to determine what has happened historically under variousconditions and to help us optimize our trading techniques. Yet since we are analyzing aless than logical subject (human emotions and expectations), we must be careful that ourmechanical systems don't mislead us into thinking that we are analyzing a logical entity.That is not to say that computers aren't wonderful technical analysis tools--they areindispensable. In my totally biased opinion, technical analysis software has done more tolevel the playing field for the average investor than any other non-regulatory event. Butas a provider of technical analysis tools, I caution you not to let the software lull you intobelieving markets are as logical and predictable as the computer you use to analyze them.
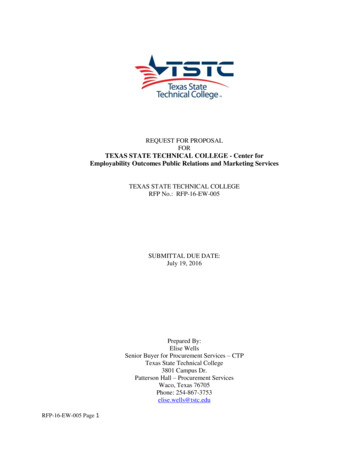
Technical Analysis from A to Zby Steven B. AchelisPRICE FIELDSPrice FieldsTechnical analysis is based almost entirely on the analysis of price and volume. Thefields which define a security's price and volume are explained below.Open - This is the price of the first trade for the period (e.g., the first trade of the day).When analyzing daily data, the Open is especially important as it is the consensus priceafter all interested parties were able to "sleep on it."High - This is the highest price that the security traded during the period. It is the point atwhich there were more sellers than buyers (i.e., there are always sellers willing to sell athigher prices, but the High represents the highest price buyers were willing to pay).Low - This is the lowest price that the security traded during the period. It is the point atwhich there were more buyers than sellers (i.e., there are always buyers willing to buy atlower prices, but the Low represents the lowest price sellers were willing to accept).Close - This is the last price that the security traded during the period. Due to itsavailability, the Close is the most often used price for analysis. The relationship betweenthe Open (the first price) and the Close (the last price) are considered significant by mosttechnicians. This relationship is emphasized in candlestick charts.Volume - This is the number of shares (or contracts) that were traded during the period.The relationship between prices and volume (e.g., increasing prices accompanied withincreasing volume) is important.Open Interest - This is the total number of outstanding contracts (i.e., those that have notbeen exercised, closed, or expired) of a future or option. Open interest is often used as anindicator.Bid - This is the price a market maker is willing to pay for a security (i.e., the price youwill receive if you sell).Ask - This is the price a market maker is willing to accept (i.e., the price you will pay tobuy the security).These simple fields are used to create literally hundreds of technical tools that study pricerelationships, trends, patterns, etc.
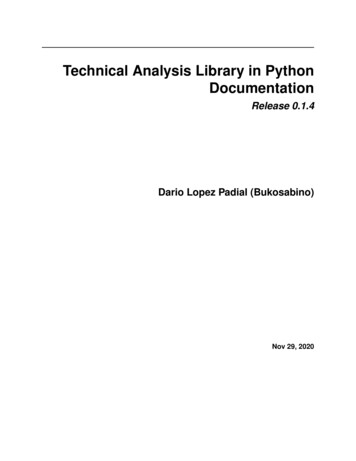
Technical Analysis from A to Zby Steven B. AchelisNot all of these price fields are available for all security types, and many quote providerspublish only a subset of these. Table 1 shows the typical fields that are reported forseveral security types.Table 1Futures Mutual Funds StocksOptionsOpenYesNoOftenYesHighYesClosed endYesYesLowYesClosed endYesYesCl
technical analysis that serves the needs of both the novice and veteran investor. That is what I have strived to create. The first half of this book is for the newcomer. It is an introduction to technical analysis that presents basic concepts and terminology. The second half is a reference that is designed for anyone using technical analysis. It contains concise explanations of numerous .