Transcription
EDM ForumEDM Forum CommunityeGEMs (Generating Evidence & Methods toimprove patient outcomes)EDM Forum Products and Events7-30-2015Augmenting Predictive Modeling Tools withClinical Insights for Care Coordination ProgramDesign and ImplementationTracy L. Johnson PhD, MADenver Health, tracy.johnson@dhha.orgDaniel BrewerDenver Health, Daniel.brewer@dhha.orgRaymond Estacio M.D.Denver Health, Raymond.estacio@dhha.orgTara Vlasimsky PharmD, BCPSDenver Health, Tara.Vlasimsky@dhha.orgSee next pages for additional authorsFollow this and additional works at: ed CitationJohnson, Tracy L. PhD, MA; Brewer, Daniel; Estacio, Raymond M.D.; Vlasimsky, Tara PharmD, BCPS; Durfee, Michael J. MSPH;Thompson, Kathy R. MS; Everhart, Rachel M. Ph.D.; Rinehart, Deborath J. PhD,MA; and Batal, Holly MD (2015) "AugmentingPredictive Modeling Tools with Clinical Insights for Care Coordination Program Design and Implementation," eGEMs (GeneratingEvidence & Methods to improve patient outcomes): Vol. 3: Iss. 1, Article 14.DOI: http://dx.doi.org/10.13063/2327-9214.1181Available at: 1/14This Learning Health System Case Study is brought to you for free and open access by the the EDM Forum Products and Events at EDM ForumCommunity. It has been peer-reviewed and accepted for publication in eGEMs (Generating Evidence & Methods to improve patient outcomes).The Electronic Data Methods (EDM) Forum is supported by the Agency for Healthcare Research and Quality (AHRQ), Grant 1U18HS022789-01.eGEMs publications do not reflect the official views of AHRQ or the United States Department of Health and Human Services.
Augmenting Predictive Modeling Tools with Clinical Insights for CareCoordination Program Design and ImplementationAbstractContext: The Center for Medicare and Medicaid Innovation (CMMI) awarded Denver Health's (DH)integrated, safety net health care system 19.8 million to implement a "population health" approach into thedelivery of primary care. This major practice transformation builds on the Patient Centered Medical Home(PCMH) and Wagner's Chronic Care Model (CCM) to achieve the "Triple Aim": improved health forpopulations, care to individuals, and lower per capita costs.Case description: This paper presents a case study of how DH integrated published predictive models andfront-line clinical judgment to implement a clinically actionable, risk stratification of patients. This populationsegmentation approach was used to deploy enhanced care team staff resources and to tailor care-managementservices to patient need, especially for patients at high risk of avoidable hospitalization. Developing,implementing, and gaining clinical acceptance of the Health Information Technology (HIT) solution forpatient risk stratification was a major grant objective.Findings: In addition to describing the Information Technology (IT) solution itself, we focus on theleadership and organizational processes that facilitated its multidisciplinary development and ongoingiterative refinement, including the following: team composition, target population definition, algorithm ruledevelopment, performance assessment, and clinical-workflow optimization. We provide examples of howdynamic business intelligence tools facilitated clinical accessibility for program design decisions by enablingreal-time data views from a population perspective down to patient-specific variables.Conclusions: We conclude that population segmentation approaches that integrate clinical perspectives withpredictive modeling results can better identify high opportunity patients amenable to medical home-based,enhanced care team interventions.AcknowledgementsDenver Health’s 21st Century Care project is supported by the Department of Health and Human Services,Centers for Medicare & Medicaid Services, Contract Number 1C1CMS331064. The contents of thispublication are solely the responsibility of the authors and do not necessarily represent the official views of theU.S. Department of Health and Human Services or any of its agencies. The analysis presented was conductedby the awardee. Findings may or may not be consistent with or confirmed by the independent evaluationcontractor. The Colorado Multiple Institutional Review Board determined this project to be QualityAssurance, not Human Subject Research.Keywordspopulation health, care coordination, value/costCreative Commons LicenseThis work is licensed under a Creative Commons Attribution-Noncommercial-No Derivative Works 3.0License.This case study is available at EDM Forum Community: 1/14
AuthorsTracy L Johnson, Denver Health; Daniel Brewer, Denver Health; Raymond Estacio, Denver Health; TaraVlasimsky, Denver Health; Michael J Durfee, Denver Health; Kathy R Thompson, Denver Health; Rachel MEverhart, Denver Health; Deborath J Rinehart; Holly Batal, Denver Health.This case study is available at EDM Forum Community: 1/14
Johnson et al.: Risk Stratification for Care Coordination Program DesigneGEMsGenerating Evidence & Methodsto improve patient outcomesAugmenting Predictive Modeling Tools withClinical Insights for Care Coordination ProgramDesign and ImplementationTracy L. Johnson, PhD, MA; Daniel Brewer; Raymond Estacio, MD; Tara Vlasimsky, PharmD, BCPS; Michael J. Durfee, MSPH;Kathy R. Thompson, MS; Rachel M. Everhart, PhD, MS; Deborath J. Rinehart, PhD, MA; Holly Batal, MD,MBAiABSTRACTContext: The Center for Medicare and Medicaid Innovation (CMMI) awarded Denver Health’s (DH)integrated, safety net health care system 19.8 million to implement a “population health” approach intothe delivery of primary care. This major practice transformation builds on the Patient Centered MedicalHome (PCMH) and Wagner’s Chronic Care Model (CCM) to achieve the “Triple Aim”: improved health forpopulations, care to individuals, and lower per capita costs.Case Description: This paper presents a case study of how DH integrated published predictive modelsDQG IURQW OLQH FOLQLFDO MXGJPHQW WR LPSOHPHQW D FOLQLFDOO\ DFWLRQDEOH ULVN VWUDWLŚFDWLRQ RI SDWLHQWV This population segmentation approach was used to deploy enhanced care team staff resources andto tailor care-management services to patient need, especially for patients at high risk of avoidablehospitalization. Developing, implementing, and gaining clinical acceptance of the Health Information7HFKQRORJ\ ,7 VROXWLRQ IRU SDWLHQW ULVN VWUDWLŚFDWLRQ ZDV D PDMRU JUDQW REMHFWLYH Findings: In addition to describing the Information Technology (IT) solution itself, we focus on theleadership and organizational processes that facilitated its multidisciplinary development and ongoingLWHUDWLYH UHŚQHPHQW LQFOXGLQJ WKH IROORZLQJ WHDP FRPSRVLWLRQ WDUJHW SRSXODWLRQ GHŚQLWLRQ DOJRULWKP UXOH GHYHORSPHQW SHUIRUPDQFH DVVHVVPHQW DQG FOLQLFDO ZRUNśRZ RSWLPL]DWLRQ :H SURYLGH H[DPSOHV RI how dynamic business intelligence tools facilitated clinical accessibility for program design decisions byHQDEOLQJ UHDO WLPH GDWD YLHZV IURP D SRSXODWLRQ SHUVSHFWLYH GRZQ WR SDWLHQW VSHFLŚF YDULDEOHV Conclusions: We conclude that population segmentation approaches that integrate clinical perspectiveswith predictive modeling results can better identify high opportunity patients amenable to medicalhome-based, enhanced care team interventions.iDenver HealthPublished by EDM Forum Community, 20151
eGEMs (Generating Evidence & Methods to improve patient outcomes), Vol. 3 [2015], Iss. 1, Art. 14IntroductionThe Center for Medicare and Medicaid Innovation(CMMI) awarded Denver Health’s (DH) integrated,safety net health care system 19.8 million tointegrate a “population health” approach intothe delivery of primary care. This major practicetransformation builds on the Patient CenteredMedical Home (PCMH) and Wagner’s Chronic CareModel (CCM) to achieve the “Triple Aim”: improvedhealth for populations, care to individuals, and lowerper capita costs.1,2,3,4 Briefly, it leverages HealthInformation Technology (HIT) to risk stratify patientsand employ enhanced care team staffing to tailorcare management services to patient need, especiallyfor patients at high risk of avoidable hospitalization.Developing, implementing, and gaining clinicalacceptance of the HIT technology solution for patientrisk stratification was a major grant objective.Risk stratification for care coordination purposesoften relies on predictive modeling and riskadjustment tools that were originally developedfor payment and are often imperfectly suited tothis expanded use. In Iezzoni’s Risk Adjustment forMeasuring Health Care Outcomes, risk adjustmentis defined as “accounting for patient-associatedfactors before comparing outcomes across differentpatients, treatments, providers, health plans, orpopulations.”5 For example, risk adjustment is usedto ensure fair compensation to prepaid health plansor providers that serve large numbers of high-riskpatients because such patients typically use moreservices than lower risk patients. However, financiallyoriented risk adjusters are designed to predict healthcare expenditures according to prevailing practicepatterns, which may include both necessary andpotentially avoidable service use. The emergingliterature on risk-stratified approaches to carecoordination has highlighted the need to homein on avoidable utilization—especially avoidablehospitalizations—not simply high utilization ms/vol3/iss1/14DOI: 10.13063/2327-9214.1181The observation that alternative risk adjusters andpredictive models were designed for, and thereforetend to identify, different populations takes onenhanced salience in this context, as some types ofutilization may be more easily modified than others.7To assess the technical performance of a predictivemodeling tool for payment purposes, the majorconsideration is the tool’s “predictive value” or itsrelative accuracy in predicting future hospitalizationand other high-cost utilization. A relatively robustliterature exists that uses statistical models toevaluate the predictive value of individual riskadjustment tools, including a few head-to-headcomparisons of the predictive performance ofalternate methodologies.8,9 As noted, however, itis important to parse avoidable from unavoidableutilization, which generally requires clinical input.Therefore, assessing the technical performance ofa predictive modeling tool for care coordinationpurposes must consider factors in addition to itspredictive value.10 Furthermore, one must alsoconsider the often substantial effort to integratethe IT solution with point-of-care program designconsiderations such as care coordination protocolsfor outreach and follow-up with identified patientsand other workflow considerations.11This paper presents a case study of how DHdeveloped and implemented a clinically acceptableand actionable risk-tiering approach by pairingthe use of published predictive models with frontline clinical judgment. In addition to describingthe IT solution itself, we focus on the leadershipand organizational processes that facilitatedits multidisciplinary development and ongoingiterative refinement, including the following: teamcomposition, target population definition, algorithmrule development, performance assessment, andoptimization of clinical workflow. We provideexamples of how dynamic business intelligence(BI) tools facilitated program design decisions by2
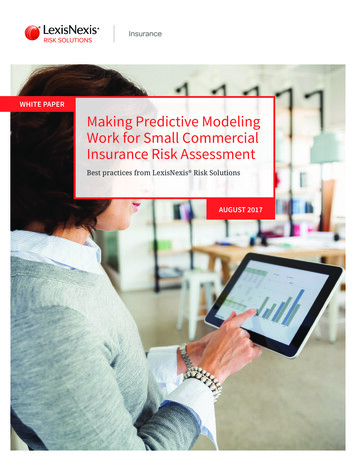
Johnson et al.: Risk Stratification for Care Coordination Program DesignVolume 3 (2015) Issue Number 1enabling real-time data views from a populationperspective down to patient-specific variables.We conclude that population segmentationapproaches that integrate clinical perspectives withpredictive modeling results can better identify “highopportunity” patients amenable to medical homebased, enhanced care team interventions.ContextDH is an integrated safety net system and thelargest provider of Medicaid and uninsured servicesin Colorado, serving approximately 200,000 usersannually. DH consists of eight federally qualifiedcommunity health centers, 15 school-based healthcenters, outpatient specialty services, a 525-bed,acute care hospital with an academic Level OneTrauma Center, a 100-bed nonmedical substanceabuse and detoxification facility, Denver’s 911emergency medical response system, the DenverPublic Health department, and an HMO managedcare plan serving commercial and public payers. Thisvertical and horizontal integration as well as a sharedelectronic health record translates into excellent datacapture that provides detailed utilization informationacross the continuum of care.The DH system provides health care services to nearlya third of residents in the city and county of Denver,Colorado. In 2013, the DH system recorded morethan 550,000 outpatient visits, including 295,000primary care visits. Approximately 65 percent ofDH patients have incomes below 185 percent of thefederal poverty level, 75 percent are members ofracial and ethnic minority groups, and approximately40 percent were uninsured in 2013 (prior to theimplementation of the Affordable Care Act).3XUSRVH RI WKH 5LVN 6WUDWLřFDWLRQ FrameworkDH’s 21 Century Care practice transformation effortbuilds on the patient-centered medical home tostPublished by EDM Forum Community, 2015provide individualized clinical and health informationtechnology (HIT) services with the overall goal ofadvancing the Triple Aim: improved health and careat a lower cost.12 Specifically, DH seeks to implementa population health approach to primary care byexplicitly defining and risk stratifying an accountablepopulation for which DH is—or should be—providingcomprehensive, patient-centered ambulatorycare services. This new model of care providesa graduated set of enhanced clinical and HITservices that are matched to risk tiers and allocatedaccording to individual needs within tiers, with moreand higher intensity services reserved for highertiered patients.For example, all patients are offered text messagereminders about appointments and recommendedpreventive services. For lower risk patients, thislow-touch, panel management approach may besufficient to support their good health. However,higher risk patients often need more frequent andmore comprehensive follow-up care as well assubstantial social and behavioral health support.Therefore, DH expanded its primary care staffingmodel to include new team members to optimizeclinical visits, to provide behavioral health and diseasemanagement services, as well as to offer complexcare coordination support. This enhanced care teamincludes patient navigators and clinical pharmacistsfor adults, pediatric nurse care coordinators, as wellas social workers and behavioral health consultants(BHCs). For the highest risk patients, DH also fundedthree high intensity clinics with small patient panelsthat focus exclusively on high-risk populations:children with special health care needs, medicallycomplex adults with recent multiple admissions, andadults with significant mental health diagnoses andrecent multiple readmissions.As illustrated in Figure 1, risk stratification is centralto 21st Century Care’s population health approach tothe allocation of tiered care coordination services.3
eGEMs (Generating Evidence & Methods to improve patient outcomes), Vol. 3 [2015], Iss. 1, Art. 14The stratification process is meant to dynamicallysort the population into four tiers of higher (Tier 4)and lower risk (Tier 1) patients. These tiers are a keyfactor in defining the target populations for specificclinical interventions, providing a higher level ofcare coordination resources to higher tier patientsand vice versa. The dynamic nature of the tiering isrequired both to capture new patients and to detectwhen individual circumstances change (e.g., low-riskpatients are reclassified as higher risk when theirhealth status changes).Figure 1 displays the original risk stratification thatwas submitted in our grant proposal as a proof ofconcept. For this initial tiering effort, DH did notperform its own risk stratification but outsourcedit to its actuary, Milliman. Nearly 130,000 patientswere placed into risk tiers using a financially orientedrisk-adjustment tool known as the Chronic Illness andDisability Payment System (CDPS), which is used bythe Colorado Medicaid agency to adjust capitatedpayments for health status.13 Using billing claims data,CDPS employs a regression-based methodology topredict future utilization according to an algorithmthat considers mainly patient age, gender, anddiagnoses. A numeric “risk score” is calculated thatexpresses individual risk in relation to the averagerisk of future spending (from a payer perspective).Risk-score threshold ranges defined tiers, and tiersizes were predetermined according to the estimatedclinical resource capacity available to each tier.As revealed in the average per member per month(PMPM) spending by tier in Figure 1, this initial proofFigure 1. Original Grant Risk Stratification Model: Tier 1 (Lowest Risk) Through Tier 4 (Highest Risk)with Associated Member Months (MM), Per Member Per Month (PMPM) Spending, Staffing Model,and ServicesPatients MMsTier 4Baseline PMPMs10,087Adult 73%Peds 27%31,372Adult 80%Peds 20%Tier 2397,463Adult 82%Peds 18%Adults: 3,449Peds: 1,410640,933Adult 27%Peds 73%High RiskHealth TeamsPN, RN CC,PharmD, BHC,HITAdults: 614Peds: 314Tier 1Enhanced Clinical & HIT ServicesMultidisciplinaryAdults: 7,801Peds: 4,552Tier 3Staśng ModelAdults: 137Peds: 76PNBHCHITHigh IntensityTreatment ClinicsComplex Case Management(High Risk CareCoordination)Chronic Disease ManagementHIT Panel Management eTouch ProgramsNotes: Baseline period is July 2010 through June 2011. This initial “proof of concept” tiering algorithm was implemented by Milliman using CDPSSUHGLFWLYH PRGHOLQJ WRRO WKUHVKROGV WR GHŚQH WLHUV 7LHU VL]HV ZHUH SUH GHWHUPLQHG DFFRUGLQJ WR HVWLPDWHG UHVRXUFH FDSDFLW\ 7KH DWWULEXWHG PDQDJHG FDUH SRSXODWLRQ ZDV LGHQWLŚHG WKURXJK PHPEHUVKLS ŚOHV ZKHUHDV WKH IHH IRU VHUYLFH SRSXODWLRQ ZDV VHOHFWHG DW D VLQJOH SRLQW LQ WLPH DW WKH EHJLQQLQJ RI WKH WLPH SHULRG DQG Ś[HG IRU WKH GXUDWLRQ OO DWWULEXWHG LQGLYLGXDOV ZHUH WLHUHG 00 0HPEHU PRQWKV 3030V 3HU PHPEHU SHU month, PN: Patient Navigator, RN CC: Nurse Care Coordinators, PharmD: Clinical Pharmacist, BHC: Behavioral Health Consultant, eTouch: Health7H[W 0HVVDJHV 3URJUDPV *UDQW WLHUV %HWD YHUVLRQ 1/14DOI: 10.13063/2327-9214.11814
Johnson et al.: Risk Stratification for Care Coordination Program DesignVolume 3 (2015) Issue Number 1of concept tiering resulted in excellent financialstratification for adults patients (Tier 1: 137 PMPM;Tier 2: 614 PMPM; Tier 3: 3,449 PMPM; Tier 4: 7,801 PMPM).However, clinical team members reviewed patientdiagnoses within tiers, conducted chart reviews, andjudged the resulting population segmentation to lacksufficient clinical relevance for primary care-based,care coordination purposes. For example, the healthservices research team produced lists of patientssorted by tier, by risk score, and by diagnoses. Theselists revealed that individuals with the same riskscore were often clinically heterogeneous. Tier 3,for instance, contained individuals with pulmonaryconditions (medium), eye conditions (low level),substance abuse (low level), psychiatric conditions(medium-, low level), and pregnancy (complete),among many other diagnostic profiles. Clinical teammembers felt that care coordination approacheswould be different for these disparate groups.Furthermore, although this risk stratification modelaccurately predicted high cost patients, it wasnot designed to distinguish avoidable from lessavoidable utilization. Chart reviews revealed that asubset of higher tier patients displayed utilizationpatterns that are relatively insensitive to change (atleast through primary care-based interventions),such as patients undergoing chronic dialysis oractive chemotherapy, as well as patients with recent,catastrophic events.In keeping with this initiative’s focus on meetingthe Triple Aim, subsequent tiering efforts sought tobetter identify high opportunity patients that wereboth potentially costly and amenable to medicalhome-based, enhanced care-team interventions.Note that care coordination programs directedat different aims might segment the populationdifferently.Published by EDM Forum Community, 2015Case Study: Developing a ClinicallyAcceptable, Risk-Tiering ApproachWe detail here the multidisciplinary and iterativerefinement of the 21st Century Care tiering algorithm,including three separate updates, known as versions1.0, 2.0, and 3.0, respectively. As displayed graphicallyin Figure 2, key steps in the algorithm developmentincluded the following: assembling a team, agreeingon and defining an accountable population,creating risk stratification algorithm rules to definepopulation segments, evaluating the financial andclinical performance, iteratively optimizing thealgorithm through care model design and workflowdevelopment, and implementing performancemonitoring. Although our population health modelencompasses the entire primary care population—adults and children—this discussion focuses on effortsto refine risk stratification rules for higher tiered adults.Assembling a TeamTiering algorithm development has been amultidisciplinary effort led by a health policy expertwith doctoral-level public health training and an ITbusiness analyst with experience in building largedata models with companion BI tools. The algorithmrules development team has evolved and grownat each iteration and includes adult and pediatricclinical directors and senior management, a clinicalpharmacy administrator, health services researchers,clinical operations staff, finance experts, and ITdevelopers. Clinical input was also obtained frompracticing primary care providers as well as thosewith quality improvement expertise. Collectively, thismultidisciplinary group provided the broad contentexpertise necessary to conceptualize and implementa risk-stratified, population health approach toprimary care service delivery. Explicit support for theeffort by DH’s CEO and the director of ambulatorycare services was also critical to the effort.5
eGEMs (Generating Evidence & Methods to improve patient outcomes), Vol. 3 [2015], Iss. 1, Art. 14Figure 2. Steps to Developing a Population Segmentation Strategy for Care CoordinationAssemblemultidisciplinaryteamDevelop riskEvaluateVWUDWLřFDWLRQ řQDQFLDO Chooserules toVWUDWLřFDWLRQ macroGHřQH & gmentsof tiers(risks/tiers)Developcaremodels foruse withintiersIdentifyindividualswho aregoodcandidatesfor ncemonitoring &evaluationIterate to optimize population segmentation & patient identiřcationInspired by Institute for Healthcare Improvement (IHI) BHLC Collaborative'HřQLQJ WKH 7DUJHW 3RSXODWLRQBroadly speaking, the target population for the21st Century Care practice transformation is theapproximately 130,000 publicly insured anduninsured patients (60,000 adults) who receive orcould benefit from primary care at a DH primarycare clinic. This target population includes currentprimary care patients, members of one of DH’smanaged care plans, as well as certain frequent usersof DH emergency, urgent care, and hospital serviceswho do not currently use primary care services.Arriving at this operational definition of the targetpopulation engendered much discussion iss1/14DOI: 10.13063/2327-9214.1181debate because, as an integrated delivery system,DH provides care to a wide variety of patients innumerous settings, including the following: primarycare clinics, specialty clinics, hospital and traumacenter, emergency department (ED), urgent care,sexually transmitted disease (STD) clinic, and travelclinic, among others. However, a population healthorientation requires thinking about populations inneed of primary care services—such as higher-riskpatients and out-of-care patients—not solely thosewho present for care. For example, data analysesrevealed that among the 3 percent of adult patientsthat accounted for 30 percent of DH facility charges,nearly half were not current primary care users.14 Thisself-reflection ultimately resulted in expanding the6
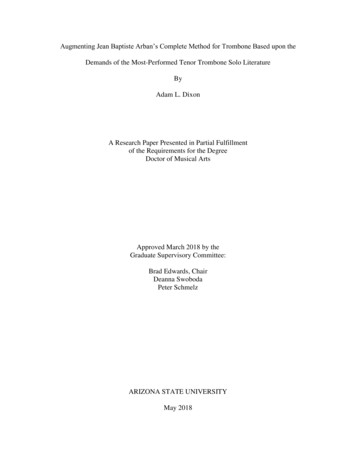
Johnson et al.: Risk Stratification for Care Coordination Program DesignVolume 3 (2015) Issue Number 1scope of who should be targeted for our primarycare transformation effort. DH managed-caremembers were included under the assumption thattheir enrollment signals an expectation that DHserve as their medical home. Similarly, the utilizationbehavior of individuals with repeated ED visits,urgent care visits, and hospitalizations suggest thatthese patients think of DH as their delivery system,and therefore DH should make proactive efforts toengage them in primary care.The 21st Century Care population is dynamicallydefined through monthly runs of a populationattribution and risk tiering algorithm. A portion of thealgorithm includes a daily (not monthly) assessmentof tier promotion events. The attributed populationis not a fixed cohort. Individuals move in and out ofthe 21st Century Care population and up and down intiers as the attribution algorithm is reapplied.'HYHORSLQJ 5LVN 6WUDWLřFDWLRQ OJRULWKP RulesAdult Tiering Algorithm 1.0(Implemented, November 2012–April 2013)Model Development SummaryThe task of bringing risk stratification in house anddeveloping a more transparent and clinically relevanttiering algorithm was a major interdisciplinaryeffort that spanned six months of bimonthly teammeetings. Although the Tiering 1.0 algorithm retainedCDPS risk scores to assign patients to an initial tier, italso contained a set of rules for promoting adults tohigher tiers, triggered by unusually frequent inpatientutilization or evidence of poor clinical control ofchronic disease.The process for developing these tier promotionrules illustrates the multidisciplinary nature of thiswork. DH clinical leaders identified high opportunityadult subpopulations thought to have potentiallyPublished by EDM Forum Community, 2015avoidable utilization, based on the literature andclinical experience. These clinicians then workedcollaboratively with health services research andIT staff to develop detailed data specifications.The latter group then conducted iterativemanualsimulations to quantify and describe each subgroup,including their inpatient and ED utilization trendsover time. Final tier promotion rules consideredthe subpopulation size, the existence of aligned,evidence-based interventions, and their utilizationrisk profile. While the bulk of the clinical andanalytical work related to patient tiering wascompleted within the six-month planning period,an additional three months were required for finalalgorithm testing and implementation by the ITteam.Financial AssessmentTo assess each algorithm’s predictive performance,Milliman actuaries calculated the PMPM payerspending by tier for those defined under the originalgrant tiering algorithm as compared to thosedefined by the Tiering 1.0 algorithm (Table 1). Asrevealed in the average PMPM spending by tier inTable 1, this revised tiering resulted in a less distinctfinancial stratification, particularly among the lowertiers: Tier 1: 386 PMPM; Tier 2: 621 PMPM; Tier 3: 1,064 PMPM; Tier 4: 8,829 PMPM.Clinical Assessment: Clinical Coherence and CareModel ImplicationsClinical performance was subjectively assessed byteam clinicians who considered the degree to whichthe population segments were clinically coherent,facilitating aligned interventions that could beimplemented for populations identified as high risk.Because tier assignments were made visible throughan automated process at the point of care on thepatient “face sheet,” the algorithm team was ableto obtain feedback from front-line clinical teams, aswell as rendering their own opinions. Assessment7
eGEMs (Generating Evidence & Methods to improve patient outcomes), Vol. 3 [2015], Iss. 1, Art. 14of the algorithm’s clinical performance differed bytier, with greater clinical satisfaction with the Tier 4redefinition than with the lower tier rule changes.Whereas the original grant tiering algorithmclassified adults as Tier 4 based on their CDPS riskscore, the Tiering 1.0 algorithm identified Tier 4adults according to multiple recent hospitalizations.These two methods identified different butoverlapping populations, and both versions identifiedindividuals with high per capita spending ( 7,801PMPM versus 8,829 PMPM). Because frequentreadmissions have been shown to be a potentialmarker for unmet behavioral health or social needs insafety net populations,15,16 our clinical experts judgedthat Tiering 1.0 rules better aligned Tier 4 statuswith patients with potentially avoidable utilization.This “super-utilizing” Tier 4 adult population wouldeventually be targeted for a high intensity clinicorganized under the ambulatory intensive caring unit(A-ICU ) model.17A second set of Tiering 1.0 rules assigned individualswith poorly controlled chronic conditions to eitherTier 2 or Tier 3 (depending on clinical control level) inorder to position them to receive pharmacotherapysupport and other enhanced care team services. Asa result, a large number of adults were promoted toTier 3 based on lab results indicating uncontrolleddiabetes or hypertension. Because the rules didnot consider severity of disease or persistence ofuncontrolled status, this clinical relevance cameat the direct expense of a flattened financialstratification, with much less tier differentiation inPMPM spending for Tiers 1–3, as compared to theoriginal stratification. (See Table 1.)The Tiering 1.0 algorithm also produced clinicallyunacceptable, unstable tier assi
Augmenting Predictive Modeling Tools with Clinical Insights for Care Coordination Program Design and Implementation Abstract Context: The Center for Medicare and Medicaid Innovation (CMMI) awarded Denver Health's (DH) integrated, safety net health care system 19.8 mil