Transcription
P L U G - I NT4Decision Making UsingExcel 2007LEARN IN G OUT C O ME S1. Describe the use of the IF function.2. Compare the functions of Goal Seek and Solver.3. List the advantages of using the Scenario Manager.IntroductionMost of the decision-analysis tools on the market focus on one specific analytical technique, like simulation or decision trees. They may be tailored to a specific industry need,such as insurance claims modeling. Furthermore, the cost of these tools can run into thetens of thousands, even millions, of dollars—such as SAS and Cognos. One integratedset of tools that combines the best analytical methods, can be applied to different problems, and is reasonably priced is Microsoft Excel 2007.The measure of any business intelligence solution is its ability to derive knowledgefrom data, as discussed in the core units of this book. This plug-in will examine a few ofthe advanced business-analysis tools that have the capability to identify patterns, trends,and rules and create “what-if” analyses. There are four areas in this plug-in:1. The IF function is used to conduct conditional tests on values and formulas.2. The Goal Seek function is used to find an unknown value that produces a desiredresult.3. The Solver function is used to calculate an optimum solution based on several variables and constraints.4. The Scenario Manager function is used to create and evaluate a collection of “what-if”scenarios containing multiple input values.Creating Formulas Using the IF FunctionThe IF logical function will return one value if a condition is TRUE and another value ifthe condition is FALSE. Use the IF function when you want to compare two items in yourworkbook. The IF function looks like this: IF(logical test,value if true,value if false)T4-2*Plug-In T4 Decision Making Using Excel 2007haa10778 plugint04.indd 27/23/07 4:38:34 PM
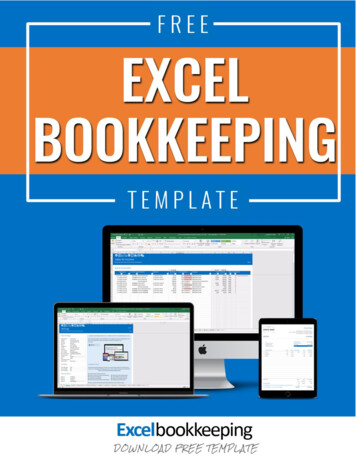
Logical test is any value or expression that can be evaluated to TRUEor FALSE. For example, A10 100 is a logical expression; if the value incell A10 is equal to 100, the expression evaluates to TRUE. Otherwise,the expression evaluates to FALSE. This argument can use any comparison calculation operator.Value if true is the value that is returned if the logical test is TRUE.For example, if this argument is the text string “Within budget” and thelogical test argument evaluates to TRUE, then the IF function displaysthe text “Within budget.” Note: Value if true can be another formula.Value if false is the value that is returned if the logical test is FALSE.For example, if this argument is the text string “Over budget” and thelogical test argument evaluates to FALSE, then the IF function displaysthe text “Over budget.” Note: Value if false can be another formula.To use the IF function follow these steps:1.2.3.4.Logical operators are used to comparenumbers in two or more cells to a constant. Equal to Less than Greater than Less than or equal to Greater than or equal to Not equal toNOTLogical NotANDLogical AndORLogical OrSelect the cell in which you want to enter the function.Click the Formulas tab, then click the Insert Function button.Click IF from the list of Logical functions and click OK.In the Function Arguments dialog box that opens, enter the Logical test argument.This argument states the condition you want to test for. Use cell references and/orvalues with logical operators. Figure T4.1 displays the list of logical operators.5. Enter the Value if true argument. This is the text string or value that will be displayedif the logical test argument is true.6. Enter the Value if false argument. This is the text string or value that will be displayed if the logical test argument is false.7. Click OK.FIGURE T4.1Logical OperatorsFor example, in a loan analysis worksheet, you want to write a conditional expressionthat examines the ratio of a loan amount to a purchase price. The logic for solving this isif the ratio is greater than 0.8, then there is an assessment fee of 300. Otherwise, the assessment fee is 0.To create a conditional expression, complete the following steps:*1. Open the workbook T4 LoanAnalysis Data.xls that accompanies this textbook.2. Click cell B14, the cell that will display Assessment if the ratio of loan amount to purchase price is greater than 0.8—the same criteria for displaying (or not) an assessment fee of 300.3. Type IF(B13/B4 0.8,300,0) and press Enter. The cell displays 300 because theloan-to-price ratio is 0.875.When you are unsure of a function and want help writing it, you can use the InsertFunction command. Executing the Insert Function command opens a dialog box thatlists functions by categories and helps you build the function.To write an IF function using the Insert Function complete the following steps:1. Click cell B16 to make it active.2. Click the Formulas tab, then click the Logical button and select IF. The Function Arguments dialog box opens (see Figure T4.2).3. Click the Logical test box and type B13/B4 0.8 (there are no spaces in this line).Notice that the moment you type 0.8, the label TRUE appears to the right of the value.Plug-In T4 Decision Making Using Excel 2007haa10778 plugint04.indd 3*T4-37/23/07 4:38:35 PM
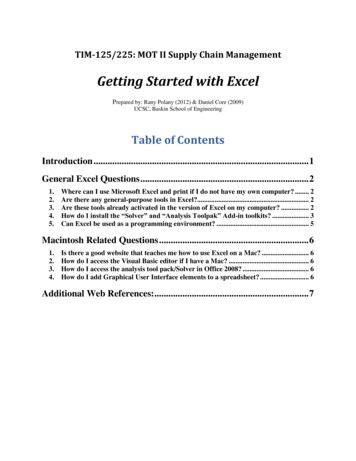
That indicates the current value of the expression basedon the condition you just completed.4. Click the Value-if-true box and type 300, which is thevalue to return if the condition is true.5. Click the Value-if-false box and type 0, which is thevalue to return if the condition is false (see FigureT4.3).6. Click OK to complete the function. Excel places thecompleted IF function into cell B16, calculates thevalue of the function, and displays 300.00 because theratio of the down payment to the purchase price isgreater than 0.8.FIGURE T4.2Function ArgumentsDialog BoxGoal SeekGoal Seek is an analytical function that allows a value in a formula to be adjusted toreach a desired result or answer. Goal Seek can eliminate unnecessary calculations thatcan be used to determine a single variable value in a formula. For example, a salesperson might participate in a bonus program that pays 3 percent of all sales dollars. Thesalesperson wants to receive a bonus of at least 2,500 and needs to know the target salesdollar amount needed.Create a worksheet with the following information (see Figure T4.4 for a layoutdesign):LabelCell AddressValueSales DollarsB1(unknown—leave blank)Bonus PercentageB23%Bonus AmountB3 B1*B2FIGURE T4.3Function ArgumentsDialog BoxWhen the Goal Seek command starts to run, it repeatedly tries new values in the variable cell to find a solution to the problem. This process is called iteration, and it continues until Excel has run the problem 100 times or has found an answer within .001of the target value specified. The iteration settings can beadjusted by clicking the Office button, then clicking ExcelOptions, clicking the Formulas button, and adjusting theMaximum Iteration options. It calculates so fast, the GoalSeek command can save significant time and effort overthe brute force method of trying one number after anotherin a formula.USING THE GOAL SEEK COMMANDThe Goal Seek feature is used to fill in the target value ofthe cell containing the Sales Dollars amount. The GoalSeek values read “Set cell B3, To value 2500, By changing cell B 1.”T4-4*Plug-In T4 Decision Making Using Excel 2007haa10778 plugint04.indd 47/23/07 4:38:36 PM
FIGURE T4.4Goal Seek WorksheetLeave blank.This is whatGoal Seek willsolve.Enter formulafor Goal Seekto solve.To use the Goal Seek command:1. Click the Data tab. In the Data Tools group click What-If Analysis and then click GoalSeek.2. In the Goal Seek dialog box, specify the cell that contains the desired value in the Setcell: box. Type in or select B3.3. Enter the desired value or answer in the To value: box. Type in 2500.4. Enter the cell whose value will be changed in the By changing cell: box. Type in orselect B 1.5. The Goal Seek dialog box should look like Figure T4.5.6. Choose OK.a. If a solution is found, the Goal Seek Status dialog box appears.b. The results are shown in Figure T4.6.7. Select OK.Goal Seek is used to adjust a single variable in a formula. Use the Solver feature toadjust multiple variables in a formula, as described in the next section.FIGURE T4.5Goal Seek FunctionPlug-In T4 Decision Making Using Excel 2007haa10778 plugint04.indd 5*T4-57/23/07 4:38:37 PM
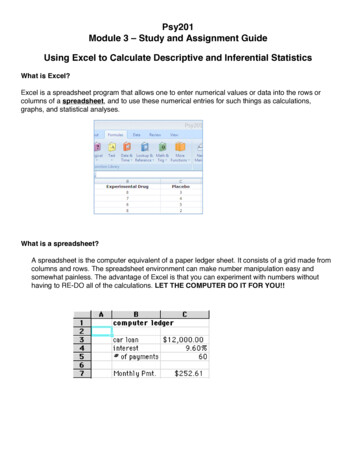
FIGURE T4.6Goal Seek ResultsSolverSolver is part of a suite of functions sometimes called what-if analysis tools used for optimizing problems that contain more than one variable. The Solver add-in utility is neededto analyze the scenarios in decision-making situations that involve consideration of valuesand constraints for several variables simultaneously. This powerful function uses multiplechanging variables and constraints to find the optimal solution to solve a problem.For example, consider a coffee shop that currently sells three beverages: (1) regularfresh-brewed coffee, (2) premium caffe latte, and (3) premium caffe mocha. The current price for regular coffee is set at 1.25, caffe latte at 2.00, and caffe mocha at 2.25,but the revenue potential is uncertain. What special emphasis (or marketing) shouldbe given to each of the beverages to maximize revenue? Although the premium coffees bring in more money, their ingredients are more expensive and they take more timeto make than regular coffee. Making some basic calculations by hand is easy, but thereneeds to be some structure to the sales data in a worksheet so that periodic changes canbe made and analyzed.INSTALLING SOLVERSolver comes with the standard Excel package, but it has to be installed. To install Solver,do the following:1.2.3.4.Click the Office button, and then click Excel Options.Click Add-Ins, and then, in the Manage box, select Excel Add-ins. Click Go.In the Add-Ins Available box, select the Solver Add-in check box, and then click OK.After you load the Solver Add-in, the Solver command is available from the AddIns tab.SETTING UP THE PROBLEMThe first step in using the Solver command is to build a “Solver-friendly” worksheet. Thisinvolves creating a target cell to be the goal of your problem—for example, a formulathat calculates total revenue—and assigning one or more variable cells that the Solvercan change to reach the goal.To use Solver, complete the following:1. Set up a worksheet similar to Figure T4.7 (this will follow the scenario presentedabove).2. The three variable cells in the worksheet are cells D5, D9, and D13. These are thecells whose values Solver needs to determine to maximize the weekly revenue.T4-6*Plug-In T4 Decision Making Using Excel 2007haa10778 plugint04.indd 67/23/07 4:38:38 PM
FIGURE T4.7The Total Revenueis the sum of D6,D10, and D14.Coffee Sales Data Sheetfor SolverThe Regularcups valuecomes from D5.Leave blank.This is whatSolver willsolve.The Premiumcups valuecomes fromD9 D13.3. In the bottom-right corner of the table is a list of constraints to use for forecasting.4. The worksheet must contain cells (G6 through G8)that include the formulas used as constraints. The limiting values for the constraints are listed in cells G11through G13: No more than 500 total cups of coffee (both regularand premium).No more than 350 cups of premium coffee (bothcaffe latte and caffe mocha).No more than 125 caffe mochas.FIGURE T4.85. The subtotals for cells D6, D10, D14 need to be calculated, as well as the Total Revenue (sum of D6, D10, and D14) in G4.6. The value for cell G6 should equal the value that will be calculated for D5, and thevalue for cell G7 will be the sum of the values from D9 and D13. The calculation ofG8 equals the sum of D5, D9, and D13.7. Click the target cell G4—the one containing the formulathat is based on the variable cells you want Solver todetermine.8. Click on the Add-Ins tab and then click the Solver button. The Solver Parameters dialog box opens, as shownin Figure T4.8. Select the Set Target Cell: box (unless italready contains the correct reference), and then clickcell G4 to insert G 4 as the target cell. The Equal To:option button, Max, is already selected. Do not changethis since the problem requests the maximum value forthe target cell.9. Select the By Changing Cells: box. Click the Collapse Dialog button to the right ofthe box to collapse the dialog box. Select each of the variable cells by holding downthe CTRL key and clicking D5, D9, and D13. This places commas between the threecell entries in the box: D 5, D 9, D 13 (refer to Figure T4.9).Solver Parameters DialogBoxFIGURE T4.9By Changing Cells Valuesin Solver ParametersDialog BoxPlug-In T4 Decision Making Using Excel 2007haa10778 plugint04.indd 7*T4-77/23/07 4:38:38 PM
10. This problem has three constraints. Click Add, in theSubject to the Constraints: section, to add the firstconstraint in the Add Constraint dialog box.a. The first constraint is the coffee shop can sell only500 cups of coffee in one week. To enter this constraint, after clicking in the Cell Reference: box,click cell G8, click in the operator drop-downlist, and with the insertion point in the Constraint:box, type or click cell G11.FIGURE T4.10Solver Parameters withConstraintsFIGURE T4.11Solver Results Dialog BoxFIGURE T4.12b. Click Add to enter the first constraint and begin thesecond constraint—the coffee shop can sell only350 premium coffees in one week. With the insertion point in the Cell Reference: box, click cell G7,click in the operator drop-down list, and in theConstraint: box, type or click cell G12.c. Click Add to enter the second constraint and begin the third—the coffee shop cansell only 125 caffe mochas in one week. Click cell D13, click in the operatordrop-down list, and in the Constraint: box, type or click cell G13.d. Click OK to add all three constraints to the Solver Parameters dialog box as shownin Figure T4.10.11. Click Solve to calculate the result.12. Solver displays a dialog box describing the results ofthe analysis. If Solver runs into a problem, an errormessage will be displayed. If Solver finds a solution, aSolver Results dialog box like Figure T4.11 will appear.13. To display the new solution in the worksheet, click theKeep Solver Solution option button in the Solver Results dialog box, and then click OK. Solver places anoptimum value in the target cell and fills the variablecells with the solutions that satisfy the constraints specified and provide the optimal result, as shown in Figure T4.12.Given theconstraints,Solverdetermined thecups needed tosell.Optimum Revenue forSolver ResultsT4-8*Plug-In T4 Decision Making Using Excel 2007haa10778 plugint04.indd 87/23/07 4:38:39 PM
EDITING A SOLVER FORECASTThe Solver tool is very useful in modifying the constraintsto evaluate new goals and possibilities. For example, if acoffee shop wants to earn exactly 800 per week from coffee drinks, use Solver to “solve” for the optimum combination of drinks. Setting a target value in Solver is a little likeusing the Goal Seek command to determine a value for anunknown variable, although Solver can use more than onevariable. To edit the Solver forecast to find the variables toreach a specific goal, follow these steps:1. Select the Add-Ins tab then select Solver. The SolverParameters dialog box appears, still displaying the variables and constraints of the last Solver problem. These will be adjusted to compute anew forecasting goal.2. Click the Value of: option button and type 800 in the box to the right. The Value of:option button sets the target cell to a particular goal to determine the variable mixneeded to reach the milestone. The dialog box should look similar to Figure T4.13.3. Click Solve to find a solution to the problem. When Solver has finished, click OK todisplay the new solution.4. Figure T4.14 shows the new solution that Solver generates.FIGURE T4.13Editing Solver ForecastNote: The results presented in Figure T4.14 are one possible solution that Solver mayreturn.Scenario ManagerA scenario is a set of input values and corresponding results from calculations that Excelcan save and report as needed. A worksheet can be used to conduct a “what-if” analysison a particular set of data. Several input values in a worksheet might change depending on different situations or circumstances. Values that produce different results can bestored as scenarios.FIGURE T4.14Solver SolutionModifying theconstraints,Solveradjusted thecups needed tosell.Plug-In T4 Decision Making Using Excel 2007haa10778 plugint04.indd 9*T4-97/23/07 4:38:40 PM
FIGURE T4.15Scenario Data TemplateExampleThe Total Costis what ScenarioManager willoptimize, givensome valueswill change.Excel’s Scenario Manager allows 32 different scenarios or groups of values to be defined. The Scenario Manager can then be used to selectively display the desired values orscenario in the worksheet. The Scenario Manager eliminates the need to have multiplecopies of the same worksheet representing different situations. For each group of inputvalues a scenario must be named and stored before it can be used.SETTING UP SCENARIOSEach group of input values or scenarios must be named and stored before it can be used.Scenarios are stored with the worksheet. To set up a scenario:FIGURE T4.16Scenario Values DialogBox ValuesT4-10*1. Open the file T4 Scenario Data.xls that accompanies this text (see Figure T4.15).2. Click on the Data tab, click the What-If Analysis button, and then select ScenarioManager.3. Click Add to display the Add Scenario dialog box.4. Enter Original in the Scenario name: box.5. In the Changing cells: box, type D9:D11 or use the Collapse Dialog button at theright side of the box to manually select the cells that hold the Number of Technicians, Regular Hours, and OverTime Hours values.6. Choose OK. The Scenario Values dialog box appears.7. The Scenario Values dialog box will display the valuesfor cells D9, D10, and D11 as 1, 300, and 0, respectively,as shown in Figure T4.16. Click OK. You will return tothe Scenario Manager dialog box.8. Once the original values has been saved, the what-ifscenarios need to be created.9. Click Add. In the Add Scenario dialog box, type SingleContractor Overtime.10. Click OK. In the Scenario Values dialog box for cellD11, enter 40. The values in cells D9 and D10 remainat 1 and 300, respectively.11. Click OK. Ensure that the Single Contractor Overtime scenario is selected, and clickShow. Excel reports that this project will need an additional 3,000, as shown in Figure T4.17.Plug-In T4 Decision Making Using Excel 2007haa10778 plugint04.indd 107/23/07 4:38:41 PM
FIGURE T4.17Single ContractorOvertime ScenarioClick Show to see thedifferent scenario.12. Create one more scenario. In the Scenario Manager dialog box, click Add again.13. The Add Scenario dialog box appears. In the Scenario name: box, type Two Contractors No Overtime.14. The Changing cells: (D9:D11) should already appear in the proper boxes; if not, enterthat range. Click OK to invoke the Scenario Values dialog box.15. Two outside contractors are brought in (by charging 200 for each additional technician). Enter 2 in the box for cell D9 and 0 in the box for cell D11. In cell D10’s box,type 300/2 since there will be two technicians to splitthe time. Click OK. A message box like that shown inFigure T4.18 will say that Excel converted the formulainto a value.16. Click OK to dismiss the message, and Excel returns youto the Scenario Manager dialog box.17. Select Two Contractors No Overtime and click Show.Excel displays 150 in cell D10 even though the totalhours are 300. This scenario gives a completion cost of 15,200.FIGURE T4.18Message Dialog BoxCompare the ScenariosCompare each scenario to determine the best solution, such as:ScenarioCostOriginal 15,000Single Contractor Overtime 18,000Two Contractors No Overtime 15,200Plug-In T4 Decision Making Using Excel 2007haa10778 plugint04.indd 11*T4-117/23/07 4:38:42 PM
MODIFYING A SCENARIOOnce scenarios have been defined, the data values in the scenarios can be modified, asneeded. To modify a scenario:1. Click on the Data tab, click the What-If Analysis button, and then select ScenarioManager.2. Select the desired scenario name.3. Click the Edit button.4. Modify the scenario information as desired.5. Close the Scenario Manager dialog box.CREATING A SCENARIO SUMMARY REPORTIncluded in the Scenario Manager is a feature called the Summary Report that createsa report that summarizes the result cells that are affected by a scenario. The SummaryReport appears in the form of a summary table that is placed on a new worksheet, whichcan be printed.To create a Scenario Summary Report:1. Click on the Data tab, click the What-If Analysis button, and then select ScenarioManager.2. Click the Summary . . . button. The Scenario Summary dialog box appears.3. Choose Scenario summary in the Report type group box.4. In the Result cells: box, type in D7,D12,D15,D16,D17. Result cells are the cells affected by the specified scenario.5. Choose OK.6. Excel produces a Scenario Summary Report like Figure T4.19.All three constraints youdefined are represented here.FIGURE T4.19Scenario Summary ReportT4-12*Plug-In T4 Decision Making Using Excel 2007haa10778 plugint04.indd 127/23/07 4:38:44 PM
*PLUG-IN SUMMARYTechnology can and does play a vitally important role in both supporting decision making and, in some instances, actually making decisions or recommendations. MicrosoftExcel 2007 spreadsheet software has an integrated set of tools combining the analytical methods that can be applied to different problems. The If function, Goal Seek, Solver, andScenario Manager analysis tools have the capability to identify patterns, trends, and rules andcreate “what-if” analyses.*MAKING BUSINESS DECISIONS1. Spotlight Video RentalsSpotlight Video is a premier video rental company in Denver, Colorado, offering the latestselections on DVD, game, and VHS releases. After DVDs and VHS tapes have been vieweda certain number of times, their quality deteriorates to the point that Spotlight Video considers them to be defective. Furthermore, some customers own DVD and VHS players thatare defective and can ruin Spotlight Video’s merchandise.Spotlight Video wants to maintain an inventory of DVDs and VHS tapes that are at least85 percent acceptable, although 95 percent is preferable. However, since it can’t keep customers’ machines from damaging the rentals, Spotlight Video has had to relax its criteriona little. You have been hired to create a spreadsheet that will evaluate each DVD and VHSbased on the following criteria: Number of times each title has been rented.Number of defects that have been reported.The percent of defects must be above 85 percent based on usage. If the percentage reported is below 85 percent, then Spotlight Video wants to flag this video as “REPLACE.”Spotlight Video has provided you with the data in a file called T4 SpotlightVideo Data.xls. You will want to create an IF function to write a conditional expression that examinesthe criteria mentioned above. Figure T4.20 displays a sample of the output that SpotlightVideo needs.2. Scheduling SolverAirPlains Airline is a new airline company that maintains a schedule of two daily flightseach way between Salt Lake City, Denver, and Chicago. AirPlains Airline must strategicallyposition itself as a low-cost provider in a volatile industry. Therefore, it must work towardfinding a minimum cost for assigning flight crews to a given flight schedule while satisfyingrestrictions dictated by the Federal Aviation Administration.Using Excel Solver, determine all the possible crew rotations based on the flight schedule below. You will want to find an approximate expected cost of each combination andthen solve the original crew scheduling problem by using these costs. Second, you willwant to calculate the crew constraints to determine the decision variables, constraints,and objectives.Plug-In T4 Decision Making Using Excel 2007haa10778 plugint04.indd 13*T4-137/23/07 4:38:45 PM
FIGURE T4.20Spotlight Video ReportSampleThe AirPlains Airline flight schedule is as follows:FromToDepartureArrivalSalt Lake CityDenver9:00AM12:00PMSalt Lake CityDenver2:00PM5:00PMSalt Lake CityChicago10:00AM2:00PMSalt Lake CityChicago3:00PM7:00PMDenverSalt Lake City8:00AM11:00AMDenverSalt Lake icago3:00PM5:00PMChicagoSalt Lake City8:00AM12:00PMChicagoSalt Lake Denver4:00PM6:00PMApply the following business rules (constraints) to your model:1. A crew that leaves a city in the morning has to return to the same city at night.2. The crew can return on another airplane. There are six airplanes in use.T4-14*Plug-In T4 Decision Making Using Excel 2007haa10778 plugint04.indd 147/23/07 4:38:45 PM
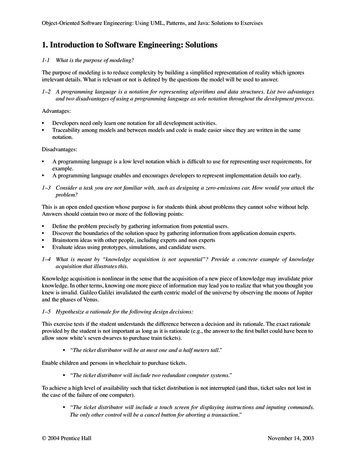
3. When a crew is flying, the cost is 200 per hour.4. When a crew is waiting or returning, the cost is 75 per hour.3. DVD SalesHans Hultgren, the sales manager for DVD Sales, wants to maximize his profit on the sale ofportable DVD players. He already has two portable models he plans to sell:ProductsRetail PriceWholesale CostPanasonic DVD–LS50 349.95 192.47Mintek MDP–1810 199.95 109.99Hans needs your help in calculating his maximum profit. First, he would like you to usethe Web to locate the retail price of two other portable DVD players not listed in the tableabove. The wholesale price of each unit is 55 percent of the retail price for both units youfind. Hans has two constraints:1. Hans has 200,000 to purchase new DVD players. The total wholesale cost of the fourtypes of DVD units must be less than 200,000.2. Hans must purchase a minimum of 100 units of each player from his wholesaler.You want to use Excel Solver to maximize the total profit for Hans with the constraintsmentioned above and limiting the number of units to positive integers.4. Maximizing ProfitHotSprings Spas manufactures and sells two spa models: the Steamboat and the Classic.HotSprings Spas receives spa bodies from another manufacturer and then adds a pumpand tubing to circulate the water. The Steamboat model demands 15.5 hours of labor and14.5 feet of tubing. The Classic model requires 10.5 hours of labor and uses 20 feet of tubing.Based on selling patterns, the owner, Deborah Liebson, has determined that the Steamboatmodel generates a profit of 400 per unit, and each Classic model generates 345 profit.While Deborah would like a large labor capacity and sufficient tubing and motors to buildany number of spas, her resources are limited. For the next production period, Deborah has2,650 labor hours, 3,450 feet of tubing, and 231 pumps available. Deborah needs assistancein figuring out how many Steamboat and Classic models to build in order to maximize herprofit. Given the constraints above, use Solver to assist Deborah in her what-if analysis.Deborah has provided you with a screen shot of a template you can use to get started(see Figure T4.21).Plug-In T4 Decision Making Using Excel 2007haa10778 plugint04.indd 15*T4-157/23/07 4:38:47 PM
FIGURE T4.21HotSprings SpaTemplate5. Budget ConstraintsJoanne Krol wants to purchase a newer model automobile to replace her rusty 1989 car.The bank where Joanne has a checking account, US Bank, is advertising an annual interest rate of 6.75 percent for a three-year loan on used cars. By selling her old car and usingsome cash she has accumulated, Joanne has 3,000 available as a down payment. Underher current budget, Joanne figures that the maximum monthly loan payment she can afford is 300. She wants to find out the maximum car price she can afford and keep themonthly payment no higher than 300. She cannot alter the interest rate or the three-yearterm. Use the Excel Goal Seek command to figure out the highest purchase price Joannecan afford.T4-16*Plug-In T4 Decision Making Using Excel 2007haa10778 plugint04.indd 167/23/07 4:38:47 PM
Plug-In T4 Decision Making Using Excel 2007* T4-5 To use the Goal Seek command: Click the Data tab. In the Data Tools group click What-If Analysis and then click Goal Seek. In the Goal Seek dialog box, specify the cell that contains the desired value in the Set cell: box.Type in or select B3. Enter the de