Transcription
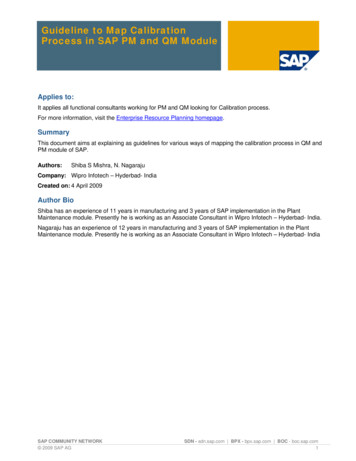
Psy201Module 3 – Study and Assignment GuideUsing Excel to Calculate Descriptive and Inferential StatisticsWhat is Excel?Excel is a spreadsheet program that allows one to enter numerical values or data into the rows orcolumns of a spreadsheet, and to use these numerical entries for such things as calculations,graphs, and statistical analyses.What is a spreadsheet?A spreadsheet is the computer equivalent of a paper ledger sheet. It consists of a grid made fromcolumns and rows. The spreadsheet environment can make number manipulation easy andsomewhat painless. The advantage of Excel is that you can experiment with numbers withouthaving to RE-DO all of the calculations. LET THE COMPUTER DO IT FOR YOU!!
Spreadsheet BasicsSpreadsheets are made up of 1. COLUMNS2. ROWS3. CELLSCOLUMNS:1. Vertical spaces going up & down.2. Letters are used to designate each COLUMN'S location.3. So here column C is highlighted.ROWS:1. Horizontal space going across.2. Numbers are used to designate each ROW'S location.3. Do here row 4 is highlighted.CELLS:1. Space where row & column intersect.2. Named according to COLUMN letter & ROW number.3. So here cell B6 is highlighted, where B column and 6 row.
How to use Excel to Calculate Descriptive StatisticsPsychologists can use Excel to organize, describe, present, and analyze data.Suppose you conducted an experiment testing the effects of a new memory drug (compared to aplacebo) on the ability to remember a list of words, and you collected data and used Excel toorganize, describe, and calculate some descriptive statistics. The independent variable (IV) is whatthe experimenter manipulates. In this case the IV is experimental drug vs. placebo. The dependentvariable (DV) is what the experimenter measures as a result of the manipulation of the IV. In thiscase, the DV is the number of words recalled.You might enter the data into Excel like this:Types of DataIt is important to note that there are 3 basic types of data that can be entered into Excel:1. Labels Text entries with no numerical value In this example, the Labels includethe two levels of the IndependentVariable: Experimental Drug andPlacebo.the names2. Constants Just a number (i.e. constant value) In this example, the constants are thenumerical data (i.e. Dependent Variable number words recalled - 8, 7, etc.)located in the columns beneath the labels.3. Formulas* A mathematical equation used tocalculate a value to display *ALL formulas MUST begin withan equal sign ( ). In this example, the following formula was entered into Cell B6, sum(B2:B5).This formula calculates the total of the four memory scores in the Experimental Drug Group
Using Excel to Calculate Descriptive StatisticsFormulas or FunctionsRemember that when creating formulas or functions, it is important that you BEGIN it with anequals sign ( ).Psychology students will find the Statistics functions very useful!Common functions that you will use in Psychology statistics or research methods classesinclude descriptive statistics such as:1. The Sum function2. The Average function3. The Standard Deviation functionA list of formulas or functions is available within Excel under the menu Formula, down toInsert Function.You can also manually insert formulas by typing them directly into the cell where you want theresult of the formula to appear.1. The SUM Function (SUM)The SUM FUNCTION takes all of the values in each of the specified cells and totals theirvalues.For example, in order to get the sum of all the words remembered in the Experimental Druggroup, we would type in the following formula into cell B6, SUM(B2:B5)
Formulas or Functions, cont’d2. The Average Function (AVG)The AVERAGE is a measure of central tendencyand gives you an idea of the typical score.The AVERAGE FUNCTION finds the average ofthe specified data.For example, in order to get the average of all thewords remembered in the Experimental Drug group,we would type in the following formula into cell B6, AVG(B2:B5).3. Standard Deviation Function (STDEV)The STANDARD DEVIATION is a measure of the spread of variance of the data and givesyou an idea of how different each score is from the average.The STANDARD DEVIATION FUNCTION finds the standard deviation of the specified data.For example, in order to get the standard deviation of all the words remembered in theExperimental Drug group, we would type in the following formula into cell B6, STDEV(B2:B5).
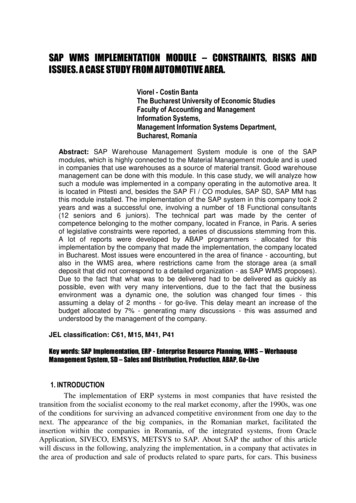
Making a Chart using Excel 2007 or Newer VersionAnother important feature of Excel that psychologists often utilize is the chart feature. A chart is alsocalled a graph. Excel has a chart program built into its main program.There are many types of charts such as the column chart or the line graph1. First, enter the data to be graphed. Returning to our earlier example, enter the data labels(Experimental Drug and Placebo) and the average memory score for each as shown below:2. Next highlight the data to be graphed, including the data labels (in other words highlightExperimental Drug, Placebo, and the averages 7.25 and 3.50)
3. When labels and averages have been entered and your cursor is immediately below the entereddata, press the F11 key on the top row of your keyboard. A chart will appear.4. To change the Chart Type:a. Select your chartb. Click on the Change Chart Type button on the left to see all of the available chart types,click on Column, then click OK5. On the Chart Tools tab, the third section from the left is named Chart Layoutsa. Near the bottom right portion of that area you will see a small button that will allow you tosee all available layouts.b. Click one time on the button to see the layouts.c. Select the layout that will allow you to add a title to the top of the chart, and label thehorizontal X-axis and the vertical Y-axis.Here is a sample of what the chart should look like:
Sample Chart of Example DataAverage # ofwords recalledAverage number of words recall as a function ofcondition (experimental drug vs. placebo)86420Experimental DrugConditionPlacebo
Using Excel 2007 or Newer to Analyze DataLet’s return to our example to make this easier to understand.Suppose that you, the researcher, are interested in the effects of an experimental drug (vs. placebo)on memory for a list of words. You hypothesize that those taking the experimental drug will exhibitbetter memory after 8 weeks than those taking the placebo. So you randomly assign people to one oftwo groups:1. Experimental Drug Group: this group of 4 people takes the experimental drug for 8 weeks.****** OR ******2. Placebo Group: this group of four people takes a placebo drug for 8 weeks.At the end of the 8 weeks, you give them a list of words to study and then measure how manywords they recall in 90 seconds and enter the data into Excel (as shown below):1. First, determine the Independent Variable and the Dependent Variable:A. The Independent Variable (IV) is the experimental condition (experimental drug vs. placebo).This IV is manipulated between-subjects (or independent samples), because 1 group onlyreceived the experimental drug & the other group only received the placebo.B. The Dependent Variable (DV) is the number of words recalled.2. Determine what statistical test you need to use:When we used Excel to compute the descriptive statistics, we discovered that the experimentaldrug group recalled more words on average (M 7.25) than the Placebo Group (M 3.50).Thus it would appear that our drug was effective at improving memory.
BUT WAIT!! You CANNOT just look at the averages and say, “there is a difference between7.25 and 3.50!”Instead, you must conduct a statistical analysis to determine if there is a significantdifference.In psychology, we accept a Significance Level (or p-value) of .05 or less in order to concludethat the means are statistically, significantly different. If the statistical test reveals that thesignificant level (p-value) is less than .05, this means that there is less than a 5% chance thatthe differences occurred by chance.Because the IV is manipulated between-subjects, you will need to calculate an inferentialstatistic called the independent samples t-test (i.e. two-samples t-test) in order todetermine if the significance level is .05 or less. If the significance level is .05 or less, then wecan conclude that there is a significant difference between the experimental drug groupaverage word recall of 7.25 and the placebo group average word recall of 3.50.3. Conduct the analysis:a. Click in a cell where you want the results of the statistical analysis to appear. In thisexample, the cell D7 was chosen.b. Click on the Formula Tab at the top of the Excel window.c. Select More Functionsd. Select Statistical, TTESTbcad
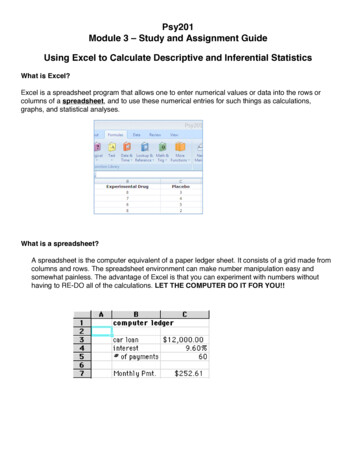
e. In the Functions Arguments Window, enter the data for the first level of the IV (i.e. data forthe Experimental Drug group) located in cells B3, B4, B5, and B6 into the textbox calledArray1. Entering “B3:B6” into the Array1 textbox tells Excel to use the constant valuesfound in cells B3, B4, B5, and B6.f. Enter the data for the second level of the IV (i.e. the data for the placebo group) located incells C3, C4, C5, and C6 into the textbox called Array2. Entering “C3:C6” into the Array2textbox tells Excel to use the constant values found in cells C3, C4, C5, and C6.g. Enter “1” into the textbox called Tails. This tells Excel to conduct a one-tailed test. Youuse a one-tailed test when you have a directional hypothesis. In this case, you have adirectional hypothesis because you expect the results to go in a specific direction - that theexperimental drug group will remember more words than the placebo.***For future reference: You use a two-tailed test when you have a non-directional hypothesis. If you expect memorydifferences between the groups, but make no predictions about which group would show enhanced memory performance,then you have a non-directional hypothesis. To conduct a two-tailed test, enter “2” into the textbox called Tails.h. Enter “2” into the textbox called Type. This tells Excel what kind of t-test to conduct. In thiscase we have a between-subjects manipulation of our IV, so we need to conduct anindependent samples (also called two-sample t-test). We are going to assume that wehave equal variances.***For future reference: You use a paired samples t-test when you have a within-subjects manipulation of the IV. Ifyou had a group of participants take the placebo for 8 weeks (then test their memory), and then had the same group takethe experimental drug for 8 weeks (and then test their memory again), you would have two memory scores perparticipants (one score after taking the placebo and one score after taking the experimental drug). This is a withinsubjects manipulation because all of the participants are exposed to all levels of the IV. To conduct a paired samples ttest, enter “1” into the textbox called Type.efgh
i. The formula result ( .001722369) appears in the window. This is the significant level.j. Click OK.ijk. The results of the formula will then appear in the Excel spreadsheet.4. Interpret the Result:The one-tailed, two samples t-test revealed a significance level of .0017.Remember the significance cut-off or alpha level that we use in the field of psychology is .05.Because .0017 is less than .05, there is less than a 5% chance that the differences in memoryperformance that we observed between the two groups occurred by chance.Therefore we can conclude that there is a significant difference between the word recall average bythe experimental group of 7.25 and the word recall average by the placebo group of 3.50.
Making a Chart using Excel 2007 or Newer Version Another important feature of Excel that psychologists often utilize is the chart feature. A chart is also called a graph. Excel has a chart program built into its main program. There are many types of charts such as the column chart