Transcription
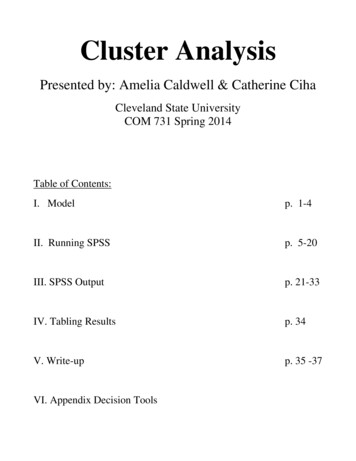
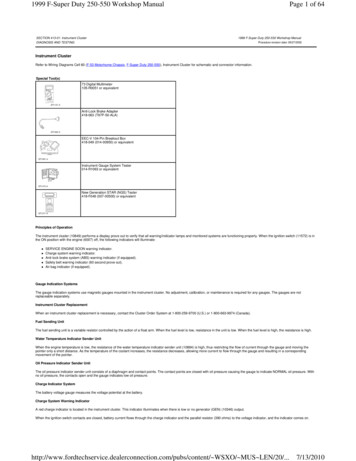
Article DOI: http://dx.doi.org/10.3201/eid2210.160097Daily Reportable Disease SpatiotemporalCluster Detection, New York City, New York,USA, 2014–2015Technical AppendixThis technical appendix includes1. Sample output produced for signals above the designated recurrence interval (RI)threshold2. Exceptions to case file specifications in main text Table 13. Explanation of analysis parameter settings (Technical Appendix Table 1)4. Summaries of first ten days of signals detecting true outbreaks (Technical AppendixTables 2 and 3)5. Explanation of choice of space-time permutation probability model6. Notes on system maintenance7. Data structure8. Annotated SAS code (SAS v.9.2, SAS Institute, Cary, NC, USA).Sample Output: First signal detecting a shigellosis (SHG) outbreak—Williamsburg, Brooklyn, New York City, November 2014The following is a sample of the output produced when a cluster identified by SaTScanexceeds the designated RI threshold. Output is generated automatically in secure archive foldersorganized by date of analysis and includes a map indicating the location of the cluster(s), clustersummary information, and a linelist of cases residing in the cluster. For ongoing clusters, a reportis only generated when at least one additional confirmed, probable, suspected, or pending casehad been added to the cluster since the last output. Output elements not shown here are (a) aPage 1 of 24
linelist of cases not in the cluster by primary address who have a secondary address that fallswithin the geographic bounds of the cluster, and (b) a linelist of cases in the cluster who have anadditional address or addresses within the geographic bounds of the cluster. These linelists areonly generated when supplemental events or addresses exist. Case coordinates in the map outputhave been randomized within the bounds of the cluster to protect confidentiality and do notreflect the true addresses of cases.Page 1 of 24
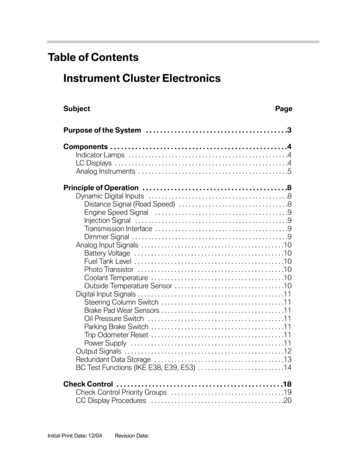
Publisher: CDC; Journal: Emerging Infectious DiseasesArticle Type: Dispatch; Volume: 22; Issue: 10; Year: 2016; Article ID: 16-0097DOI: 10.3201/eid2210.160097; TOC Head: DispatchSample automated table: Cluster summary informationCluster1Start date2014 Oct 20End date2014 Nov 13No. days incluster25Observed/expected6.53Radius, miles0.68Recurrenceinterval, days*333Sample automated table: Linelist of cases residing in the clusterCluster1Newevent Event IDYes XXXXXXXDisease Investstatus 2014 XBKXXXXXXXXXXXXXXBKXXXXXUnited HospitalFundneighborhood Census XXXXXXXXXXXXXBK, Brooklyn Conf, confirmed; Invest, investigation; NN, not needed.Exceptions to Case File Specifications in Main Text Table 11. Exceptions to the 1-y study period: for analyses with a longer maximum temporalwindow, the study period is extended accordingly so the temporal window of interest does notconstitute a disproportionately high fraction of the study period. For the 60-d maximum temporalwindow, the study period is extended to 1.5 y. For shigellosis, outbreaks occur cyclically andhave prolonged person-to-person transmission. The study period was extended to 2 y so that ascases in ongoing outbreaks shift as time passes from the temporal window of interest to thebaseline, they do not constitute a disproportionately high fraction of the study period. Includingtrue outbreak-associated cases in the baseline period of the case file can bias prospectiveanalyses, making it more difficult to detect an elevated number of diagnoses in an area with apast outbreak. To minimize this bias, for example, after a large legionellosis outbreak in theSouth Bronx (1), all cases citywide with event dates of July 8–August 3, 2015, were removedfrom the case file. Including nosocomial outbreak-associated cases in the temporal period ofinterest in the case file can make it more difficult to detect a simultaneous outbreak ofcommunity-associated cases. To minimize this bias, after an outbreak of legionellosis in aPage 3 of 54
Publisher: CDC; Journal: Emerging Infectious DiseasesArticle Type: Dispatch; Volume: 22; Issue: 10; Year: 2016; Article ID: 16-0097DOI: 10.3201/eid2210.160097; TOC Head: Dispatchnursing home, the 7 cases for patients residing in this home during the outbreak period wereremoved from the case file.2. Exceptions to including all reported cases: Including all cases assumes that the overallreporting volume is constant over time. This assumption can be violated by geographic changesin laboratory testing practices. For legionellosis, 1 case status (unresolved) is reserved for eventsfor which the only laboratory report is an antibody test; such events do not meet the casedefinition. Before excluding this case status, several false legionellosis signals occurred. Onehospital laboratory adopted a new culture-independent diagnostic test for a panel of pathogenscausing gastrointestinal illness. Before excluding cases where the only laboratory report wasfrom this panel, several clusters of Shiga toxin–producing Escherichia coli were attributable toreports from this facility using this diagnostic test, but the cases did not meet the case definition.Technical Appendix Table 1. Analysis parameter settings for routine reportable disease analyses in New York City using theprospective space-time permutation scan statistic.ParameterParameter settingNotesAnalysis typeProspective spaceFor timely cluster detection, prospective (rather than retrospective) analyses aretimeused, evaluating only the subset of possible clusters that encompass the last day ofthe study period. Such clusters do not necessarily require the existence of cases atthe very end of the study period.To detect acute, ongoing, localized disease clusters, space-time analyses(rather than purely temporal or purely spatial analyses), are used.Model typeSpace-timeThe space-time permutation probability model has several advantages overpermutationother models developed for count data, including requiring only case data and notrequiring the assumption that the probability of being diagnosed and reported as acase is independent of location of patient residence.Scan areasHigh ratesFor disease cluster detection, areas with high (rather than low) rates are ofinterest. Separate quality control measures are in place to detect unusual drop-offsin disease reporting.Time aggregation and1dThis setting must equal the interval between prospective analyses. For dailylengthanalyses, data must be aggregated into units of one day, corresponding with thedaily resolution of data in the case file.Maximum spatial50% of all casesThe option that imposes the fewest assumptions is to allow the cluster tocluster sizeduring the studyexpand in size to include up to 50% of all cases during the study period. Forcingperiodclusters to be smaller than 50% (or restricting in terms of geographic size by settinga maximum circle radius) can be arbitrary and lead to selection bias.Maximum temporal30 d*Thirty days is long enough to encompass most cases in point-source clusters,cluster sizewhich typically span a few days or weeks, depending on the pathogen. Thirty daysmay not be long enough for diseases with long incubation periods, extendedpropagated transmission, or intermittent common-source outbreaks.Maximum number of999The number of replications must be at least 999 for adequate power. ToMonte Carlominimize computing time across the many diseases being independently analyzedreplicationseach day, we chose not to increase to 9,999 replications.Secondary clusterNo cluster centersAny disease may have multiple active clusters at any moment, so secondaryreporting criteriain other clustersclusters should be reviewed. By reviewing clusters with no cluster centers in other(output parameter)clusters (rather than no, or more geographic overlap), secondary clusters with someoverlap can be detected.*Exceptions to the 30-d maximum temporal cluster size: The maximum temporal cluster size is extended to 60 d for Shiga toxin-producing E. coli,hepatitis A, typhoid fever, and paratyphoid fever. FoodCORE performance metrics define a cluster as two or more cases with an indistinguishablePFGE pattern in 60 d (U.S. Centers for Disease Control and Prevention. Foodborne Diseases Centers for Outbreak Response Enhancement:Salmonella, Shiga toxin-producing Escherichia coli, and Listeria (SSL) Metrics. 2015 [cited 2015 Sep 24]. http://www.cdc.gov/foodcore/sslmetrics.html).Page 4 of 54
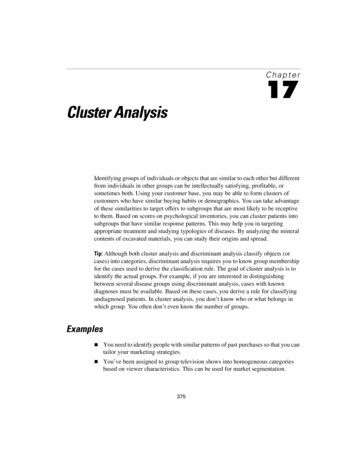
Publisher: CDC; Journal: Emerging Infectious DiseasesArticle Type: Dispatch; Volume: 22; Issue: 10; Year: 2016; Article ID: 16-0097DOI: 10.3201/eid2210.160097; TOC Head: DispatchTechnical Appendix Table 2. First ten days of signals detecting a legionellosis outbreak ― South Bronx, New York City, July 2015*Observed,Cluster startDays inRadius,all caseExpected, all Observed/RecurrenceSignal date, 2015date, 2015clustermilesstatuses†case statuses expectedinterval, dFriday, Jul 17Jul 981.5780.839.66500Saturday, Jul 18Jul 1261.0560.3119.261,000Sunday, Jul 19Jul 1271.0560.3119.121,000Monday, Jul 20Jul 1281.0560.3119.121,000Tuesday, Jul 21Jul 8132.12122.225.42500Wednesday, Jul 22Jul 9132.38132.175.991,000Thursday, Jul 23Jul 8152.40172.845.981,000Friday, Jul 24Jul 8162.47214.454.721,000Saturday, Jul 25Jul 8172.01225.474.021,000Sunday, Jul 26Jul 8182.47214.724.451,000*NYC DOHMH. Health Alert Network. Alert #21: Increase in Legionnaires' disease in the Bronx. New York City Department of Health and MentalHygiene: New York. 2015 [cited 2015 Sep 24]. /AlertUpdateAdvisoryDocuments/HAN LegionellaSouthBronx.pdf.†The number of observed cases in the most likely cluster can increase or decrease on consecutive days, depending on how the cluster’s spatial andtemporal extent change as cases are newly diagnosed, reported, and interviewed to determine an onset date.Technical Appendix Table 3. First ten days of signals detecting a shigellosis outbreak―Borough Park and Williamsburg, Brooklyn,New York City, November 2014*Signal date, 2014Cluster start date,No. daysRadius,No.No.Observed/Recurrence2014in clustermilesobservedexpectedexpectedinterval, dFriday, Nov 14Oct 20250.6891.386.53333Saturday, Nov 15Oct 20260.6891.386.53250Sunday, Nov 16Oct 20271.06132.614.98500Monday, Nov 17Oct 18301.53143.494.01111Tuesday, Nov 18Oct 20291.06153.194.701,000Wednesday, Nov 19Oct 20301.06163.434.661,000Thursday, Nov 20Oct 21300.86132.674.88500Friday, Nov 21Oct 24280.97122.454.89500Saturday, Nov 22Oct 24290.97132.644.921,000Sunday, Nov 23Oct 24300.86143.084.551,000*NYC DOHMH. Health Alert Network. Alert #39: Outbreak of shigellosis in Borough Park and Williamsburg. New York City Department of Health andMental Hygiene: New York. 2014 [cited 2015 Sep 24]. /AlertUpdateAdvisoryDocuments/HAN Shigella.pdfRationale for Space-Time Permutation Instead of Poisson or Bernoulli ProbabilityModelsFor count data such as reportable disease events, three probability models are availablefor spatiotemporal analyses using SaTScan (2,3). The Poisson model requires geographicallyaggregated cases and population counts, and the null hypothesis assumes that the probability ofbeing observed as a case is not spatially dependent. However, if case-patients residing in one partof a jurisdiction are more likely to present for care (e.g., due to insurance coverage or access tocare) and be tested, diagnosed, and reported with a disease, then the null hypothesis can beviolated. The Bernoulli model requires cases and controls with temporal and spatial attributes;e.g., controls might be defined as cases of a different disease. The null hypothesis assumes thatthe ratio of cases and controls is constant across space and time, but if the cases and controlshave different seasonal patterns or day-of-week effects, then the null hypothesis can be violated.Page 5 of 54
Publisher: CDC; Journal: Emerging Infectious DiseasesArticle Type: Dispatch; Volume: 22; Issue: 10; Year: 2016; Article ID: 16-0097DOI: 10.3201/eid2210.160097; TOC Head: DispatchPassively reported disease surveillance data likely violate the assumptions required for thePoisson and Bernoulli models. Thus, we selected the space-time permutation probability model,which requires only case data and automatically adjusts for any purely geographic and anycitywide purely temporal trends.System MaintenanceThe SAS program was run automatically by Microsoft Task Scheduler every morning,using data with event dates through the end of the prior day. The entire program analyzing alldiseases takes 40–60 minutes to run each morning on a dedicated computer (Quad Core i7 CPUwith 16GB RAM); the exact run time varied depending on disease volume and whether therewas a signal. Analyses were completed by open of business to inform activities for that workday.For each disease regardless of signal status, the daily case input file and SaTScan resultsfiles were archived. Cluster summary information (one row per disease per day) was appended toa cumulative SAS dataset to track how clusters strengthened or weakened over time.Timely cluster detection is dependent on up-to-date data. Delays resulted when diseaseswere reported by telephone or fax instead of electronically and reports were still awaiting dataentry at the time of analysis. Relevant spatial and temporal data elements obtained from caseinvestigation (e.g., work address and onset date) also needed to be entered quickly.Strong data quality control procedures must be maintained to avoid missed and falsesignals. Patient addresses that were not geocodable (e.g., due to typos) were reviewed andcorrected if possible to keep those cases in analysis and retain power. Multiple disease reports forthe same patient were de-duplicated to avoid false signals.Information technology problems need to be anticipated to avoid disrupting analyses. Ona few occasions, security updates and forced computer reboots interfered with programsscheduled to run automatically. Live, completely refreshed data were not always available. Inaddition, electronic reporting must be continuously maintained for all clinical laboratories,including during transitions when files are upgraded to meet Meaningful Use requirements. Theassumption of no spatial variation in data accrual delays can be violated if a laboratory servingpatients in one geographic area encounters difficulties in electronically transmitting reports.Page 6 of 54
Publisher: CDC; Journal: Emerging Infectious DiseasesArticle Type: Dispatch; Volume: 22; Issue: 10; Year: 2016; Article ID: 16-0097DOI: 10.3201/eid2210.160097; TOC Head: DispatchInterpreting signals can be challenging. With 35 diseases under surveillance and asignaling threshold of RI 100 days, we could expect to see over 100 false signals a year due tochance. Our observed signaling rate was much lower, because some diseases had very lowdisease counts. The number of signals could easily be reduced by setting a higher threshold, butthat could lead to missed or delayed signals of public health importance. Lower or highersignaling thresholds could have been used, considering the seriousness of an outbreak of aparticular disease and weighing the relative costs of investigating false signals versus notresponding to true signals. A higher signaling threshold of RI 365 days would have yielded 18unique (36% fewer) signals across 10 diseases, and a lower signaling threshold of RI 30 dayswould have yielded 70 unique (153% more) signals across 23 diseases (main text Table 2).Rather than using a fixed statistical threshold to launch a formal outbreak investigation, itis better to rely on experienced epidemiologists to weigh several factors, including the type ofdisease, the patient population, and the RI magnitude. Signals suggest excess disease activity andare intended to facilitate investigations, but provide only approximate spatial and temporalboundaries for a suspected outbreak. Some patients within the cluster likely representbackground, non-outbreak-associated cases, while some patients outside the cluster may havehad the outbreak-causing exposure. In addition, a geographically large cluster may have a lessclear public health action compared with highly spatially focused clusters.Analytic adjustments were warranted in response to false, delayed, and difficult-tointerpret signals. False signals were attributable to the inclusion of legionellosis cases with onlyantibody test results and Shiga toxin-producing E. coli cases with only culture-independentdiagnostic test results. These reports did not meet the case definitions and reflected the adoptionof specific tests by specific facilities rather than true disease increases. Case files were modifiedto exclude such cases (main text Table 1). A legionellosis outbreak in the East Bronx inSeptember 2015 was detected later than it might have been, because the only spatial elementincluded in analysis initially was the home address of NYC residents, whereas the outbreak alsoaffected those who worked or attended programs but did not live in the area. The case file wasmodified to include the NYC work address obtained from case investigation if a NYC homeaddress was unavailable (main text Table 1). In addition, in response to heightened publicconcern following a large community-acquired legionellosis outbreak, the RI signaling thresholdPage 7 of 54
Publisher: CDC; Journal: Emerging Infectious DiseasesArticle Type: Dispatch; Volume: 22; Issue: 10; Year: 2016; Article ID: 16-0097DOI: 10.3201/eid2210.160097; TOC Head: Dispatchwas lowered from 100 to 30 days to facilitate earlier cluster detection at the possible expense ofincreased false signaling.Several signals were difficult to interpret due to the influence of past outbreaks in thestudy period. Following a nosocomial legionellosis outbreak in a nursing home, the individualoutbreak-associated cases were excluded from the case file. Following large communityassociated legionellosis outbreaks, all cases citywide during each outbreak period were excludedfrom the case file. In addition, a shigellosis outbreak was so prolonged that after 3 months, thecenter of the cluster appeared to migrate to a different part of the city, despite continued excessshigellosis activity in the original outbreak location. The case file was modified to double thestudy period so that as older cases in the ongoing outbreak shifted from the temporal clusterwindow of interest into the baseline period, they would not unduly influence the baseline (maintext Table 1).Data StructureA case file was generated daily from BCD’s surveillance database (Maven, ConsilienceSoftware, Austin, TX) for each disease according to the specifications in main text Table 1. Foreach reported disease case, the “event date,” (the illness onset date if available; otherwise thediagnosis date) was noted. Cases were geocoded to census tracts in near real-time by integratingMaven with a custom geocoding web service referencing the NYC Department of CityPlanning’s Geosupport Desktop Edition software (4). Each case text file included: census tract,number of cases, event date, and a day-of-week indicator.A geographic coordinate file is also required for analysis in SaTScan. Cases wereassigned to the centroid of their census tract, defined using Census 2000 boundaries and aCartesian coordinate system. The coordinate file included: census tract, X-coordinate, and Ycoordinate.Sample Structure for Input Dataset of Analysis Parameters, Named “diseaselist”:Recurrence: Recurrence interval threshold (days)MaxTemp: Maximum temporal cluster size (days)Page 8 of 54
Publisher: CDC; Journal: Emerging Infectious DiseasesArticle Type: Dispatch; Volume: 22; Issue: 10; Year: 2016; Article ID: 16-0097DOI: 10.3201/eid2210.160097; TOC Head: DispatchMaxGeog: Maximum spatial cluster size (percent of cases in study period)Baseline: Length of study period (days)Montecarlo: Number of Monte Carlo replicationsLagtime: Number of days between day of analysis and end of study periodDisease codeAMBAMBARB YERRecurrence100100100 100MaxTemp303030 30MaxGeog505050 50Baseline365365365 365Montecarlo999999999 999Lagtime111 1AgeGroup5orYoungerAllAgesAllAges AllAgesSample SAS Code for Running SaTScan Analyses and Producing OutputThis code generates case and parameter files formatted for SaTScan for each disease,reads in the NYC census tract coordinate file, calls SaTScan in batch mode, reads in analysisresults, creates output files when a cluster is identified above the RI threshold, and sends e-mailsto Bureau of Communicable Disease (BCD) leadership and designated staff for follow-up. Thecode is partitioned into three files, which are presented here in the order they are run by SAS(5,6). The first file reads in a series of macros that establish SaTScan input, analysis, and outputparameters; call SaTScan in batch mode; flag new clusters above the RI threshold; and generatefigures and linelists for output. The second file creates an event-level dataset of all diseases andruns iteratively over a list of designated disease-analysis parameter combinations to createdisease-specific event-level datasets for analysis in SaTScan, then calls the macros to performanalyses and produce output files. The third file sends e-mails to alert staff to new and ongoingsignal summary output and inform BCD data unit staff that the program has run successfully.Jurisdictions seeking to adopt SaTScan for cluster detection should keep in mind that theparameters macro program presented here (TractParam) is only compatible with SaTScanversion 9.1.1. If using a different version of SaTScan, it will be necessary to replace this codewith parameters derived from the version of SaTScan to be used for analysis. This is done bysetting input, analysis, and output parameters in the SaTScan user interface, saving the SaTScansession as a .txt file, and replacing the code in the body of the TractParam macro progam withthe text of the saved .txt file. All lines of the substituted text will need to be enclosed in doublePage 9 of 54
Publisher: CDC; Journal: Emerging Infectious DiseasesArticle Type: Dispatch; Volume: 22; Issue: 10; Year: 2016; Article ID: 16-0097DOI: 10.3201/eid2210.160097; TOC Head: Dispatchquotation marks and preceded by a forward slash, except the first line of each parameter group(e.g., [Input], [Analysis], etc.) which should be preceded by two forward slashes. The [System]parameter group can be excluded from the TractParam macro program. Be sure to make note ofthe locations where macro variables are used in the original text of the TractParam macroprogram, as these will need to be reinserted after substituting new parameters from the .txt file toretain the capacity to automate analyses over multiple disease-analysis parameter combinations.Potential adopters should also recognize the need to modify or remove sections of the codepresented here that may not be relevant or applicable to their jurisdictions, including coderemoving STEC cases identified by BioFire testing, removing outbreak-associated diseaseevents, replacing non-geocodable addresses with secondary addresses, restricting inclusion ofencephalitis cases, identifying cases that do not match to a location in the geographic coordinatesfile, producing supplemental linelists in cluster output, and referencing NYC-specific (censustract, UHF neighborhood, borough) data elements.When setting up SaTScan for automated cluster detection, it is advisable to separate intothree steps. The first is preparing case files, reading them into SaTScan in batch mode foranalysis, and importing SaTScan output into SAS. Preparing case files from disease surveillancedata are the primary purpose of the analysis program (File 2) presented here, which requiresreferencing the analysis parameters dataset. Running SaTScan in batch mode is the focus of thefirst section of the macro programs file (File 1), and requires referencing the geographiccoordinates file and calling the TractParam and CallSatscan macro programs. The user shouldbe aware of the importance of setting the TXTFILES (temporary destination for case files),OUTPUT (temporary destination for SaTScan output files), and PARAM filepaths properlybefore attempting to run SaTScan in batch mode. If any of these folders do not exist in theSaTScan folder, they should be created, and the geographic coordinates file should be stored inthe PARAM folder. The callSatscan macro program calls SaTScan in batch mode and importsSaTScan result files (col.dbf and gis.dbf) into SAS.The second step is to format and evaluate SaTScan analysis results, and generate outputfor identified clusters. The relevant macro programs for this task are Switch, Choropleth Setup,Linelist Setup, NewIndividuals, AddToList, MakeChoropleth, MakeClusterLinelist, andPersonLinelist. To distinguish between new and previously identified clusters and diseasePage 10 of 54
Publisher: CDC; Journal: Emerging Infectious DiseasesArticle Type: Dispatch; Volume: 22; Issue: 10; Year: 2016; Article ID: 16-0097DOI: 10.3201/eid2210.160097; TOC Head: Dispatchevents, we maintain archive datasets (clusterhistory and satscanlinelist) of all identified clustersand events, which are referenced in several of the listed macro programs. A shapefile (.shp) ofthe area and geographic unit covered by the analysis is required to output a map of identifiedclusters. Our analysis is done on the census tract-level, but the code could be modified toaccommodate analyses using different geographic units. Maps and linelists are output as .rtf filesusing the SAS Output Delivery System (ODS), which can be opened in Microsoft Word. Desiredlocation for output should be specified in ODS RTF BODY and ODS RTF FILE statements inthe MakeChoropleth macro program.The third step is to distribute e-mail alerts to appropriate staff after the analysis has runand output is ready for review. To run successfully, the EMAILHOST and EMAILSYS optionsin SAS must be properly configured, and a dataset with disease codes and corresponding lists ofemails for distribution (enclosed in quotation marks, space-delimited) must be available forreference. This e-mail distribution component of the code is optional and will not affect theresults of the cluster detection analysis.References1. New York City Department of Health and Mental Hygiene. Health Alert Network. 2015 Alert 21:increase in Legionnaire’s disease in the Bronx. New York City Department of Health and MentalHygiene: New York. 2015 [cited 2015 Sep 24]. /AlertUpdateAdvisoryDocuments/HAN LegionellaSouthBronx.pdf2. Kulldorff M; Information Management Services, Inc. SaTScan v9.1.1: software for the spatial andspace-time scan statistics. 2015 [cited 2015 Sep 24]. http://www.satscan.org/3. Kulldorff M. SaTScan user guide for version 9.4. 2015 [cited 2015 Sep 24].http://www.satscan.org/techdoc.html4. Geographic Systems Section, Information Technology Division, New York City Department of CityPlanning. Geosupport Desktop Edition software. Version 15C. New York, USA: The Department[cited 2015 Dec 4]. ata/dwn-gde-home.page5. Abrams AM, Kleinman KP. A SaTScan macro accessory for cartography (SMAC) packageimplemented with SAS software. Int J Health Geogr. 2007;6:6. http://dx.doi.org/10.1186/1476072X-6-6Page 11 of 54
Publisher: CDC; Journal: Emerging Infectious DiseasesArticle Type: Dispatch; Volume: 22; Issue: 10; Year: 2016; Article ID: 16-0097DOI: 10.3201/eid2210.160097; TOC Head: Dispatch6. Chen J-H, Weng C, Chang H-G. Using space-time scan statistic to detect pertussis and shigellosisoutbreaks (poster). In: Abstracts of the 2013 Annual Conference of the Council of State andTerritorial Epidemiologists; Pasadena, California; 2013 Jun 10-13; Abstract 1614 [cited 2015 Sep18] AgendaAppWebPosterAwards.pdfFile 1: Macro *******************************//*PROGRAM NAME: SaTScan macros2*//*DATE CREATED: February 10, 2014*//*LAST UPDATED: November 4, 2015*//*PROGRAMMERS: Deborah Kapell*//*Eric Peterson*//**//*PURPOSE: Reads in SaTScan ***********************************/ods results off;/* Maven Business Intelligence (BI) Tables */libname maven odbc database MavenBCD RPT owner dbo;/* SaTScan Folder */libname satscan9 'C:\SaTScan9';/* Analyst Tools Folder */libname skt 'S:\BCD\COMDISshared\Analyst of the week\Tools';/* SAS Datasets of Maven Data for address histories */libname mavensas 'S:\BCD\COMDISshared\Analyst of the week\Maven\SAS data';/* SaTScan Output Archive Folder */libname satscan 'S:\BCD\COMDISshared\Analyst of the week\Maven\SaTScan';/* Permanent SaTScan SAS Datasets: *//*Cluster history archive – all most likely clusters identified for *//*each disease on each day of analysis *//*SaTScan linelist archive – all events that have been identified as *//*part of a SaTScan cluster exceeding RI threshold. Used to*//*determine if identified cluster has any new events *//*E-mail distribution list – BCD staff to be alerted to a new cluster *//*or event by disease */libname support'S:\BCD\COMDISshared\Analyst of the week\Maven\SaTScan\SupportingFiles';/* Set filepaths for output from batch runs of SaTScan. These locations/*are referenced in the TractParam and callSatscan macro programs,/*and in the Analysis Program file */%LET TXTFILES C:\SaTScan9\TXTFILES\;%LET PARAM C:\SaTScan9\PARAM\;Page 12 of 54*/*/ pag
Friday, Jul 24 Jul 8 16 2.47 21 4.45 4.72 1,000 Saturday, Jul 25 Jul 8 17 2.01 22 5.47 4.02 1,000 Sunday, Jul 26 Jul 8 18 2.47 21 4.72 4.45 1,000 *NYC DOHMH. Health Alert Network. Alert #21: Increase in Legionnaires' disease in the Bronx. New York City